Client satisfaction plays a critical role in business success. Every organization wants happy clients, repeat business, and positive word-of-mouth. However, without proper tracking and analysis, client feedback often stays unused. That is exactly where a Client Satisfaction Survey Dashboard in Power BI becomes extremely valuable.
Instead of reviewing raw survey files or disconnected Excel sheets, organizations use this interactive dashboard to visualize client feedback, identify trends, and take quick actions. Because Power BI offers advanced analytics and visualization capabilities, decision-makers can understand satisfaction levels instantly.
In this detailed article, you will learn what a Client Satisfaction Survey Dashboard in Power BI is, why it matters, how it works, its dashboard pages, features, advantages, best practices, and frequently asked questions. By the end, you will clearly understand how this dashboard improves customer experience and business performance.
What Is a Client Satisfaction Survey Dashboard in Power BI?
A Client Satisfaction Survey Dashboard in Power BI is an interactive reporting solution designed to analyze and visualize client feedback collected through surveys.
Instead of working with raw survey responses, teams use this dashboard to:
- Track overall satisfaction levels
- Analyze service quality and communication
- Monitor Net Promoter Score (NPS)
- Compare satisfaction across regions, channels, and services
- Identify trends over time
Because Power BI supports slicers, charts, and dynamic visuals, users can filter data easily and explore insights without technical knowledge.
Why Do Organizations Need a Client Satisfaction Survey Dashboard?
Client feedback holds valuable insights. However, many organizations fail to use this data effectively. Therefore, they miss opportunities to improve service quality and retention.
A Client Satisfaction Survey Dashboard in Power BI helps organizations because it:
- Converts survey data into meaningful insights
- Saves time by automating analysis
- Improves decision-making with real-time visuals
- Highlights problem areas quickly
- Supports customer-centric strategies
As a result, businesses move from reactive responses to proactive client experience management.
How Does a Client Satisfaction Survey Dashboard in Power BI Work?
The dashboard works by connecting survey data, usually captured in Excel or other sources, with Power BI.
The process works step by step:
- Data Collection
Teams collect survey responses using forms or survey tools and store them in Excel. - Data Import into Power BI
Power BI imports the survey file and prepares it for analysis. - Data Modeling and Measures
Measures calculate averages, NPS scores, timelines, and satisfaction metrics. - Visualization and Interaction
Charts, cards, and slicers display insights dynamically. - Analysis and Decision-Making
Users filter by region, service type, or channel to identify improvement areas.
Because of this structured workflow, organizations gain faster and more accurate insights.
Key Features of Client Satisfaction Survey Dashboard in Power BI
The Client Satisfaction Survey Dashboard in Power BI includes five powerful pages, each designed to answer specific business questions.
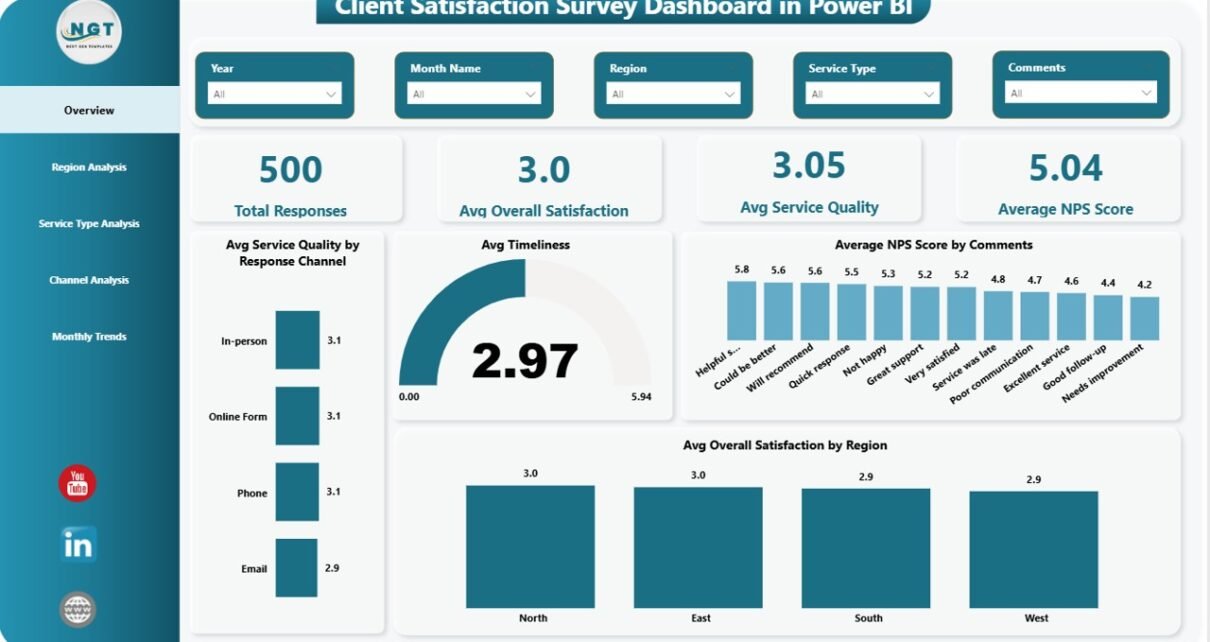
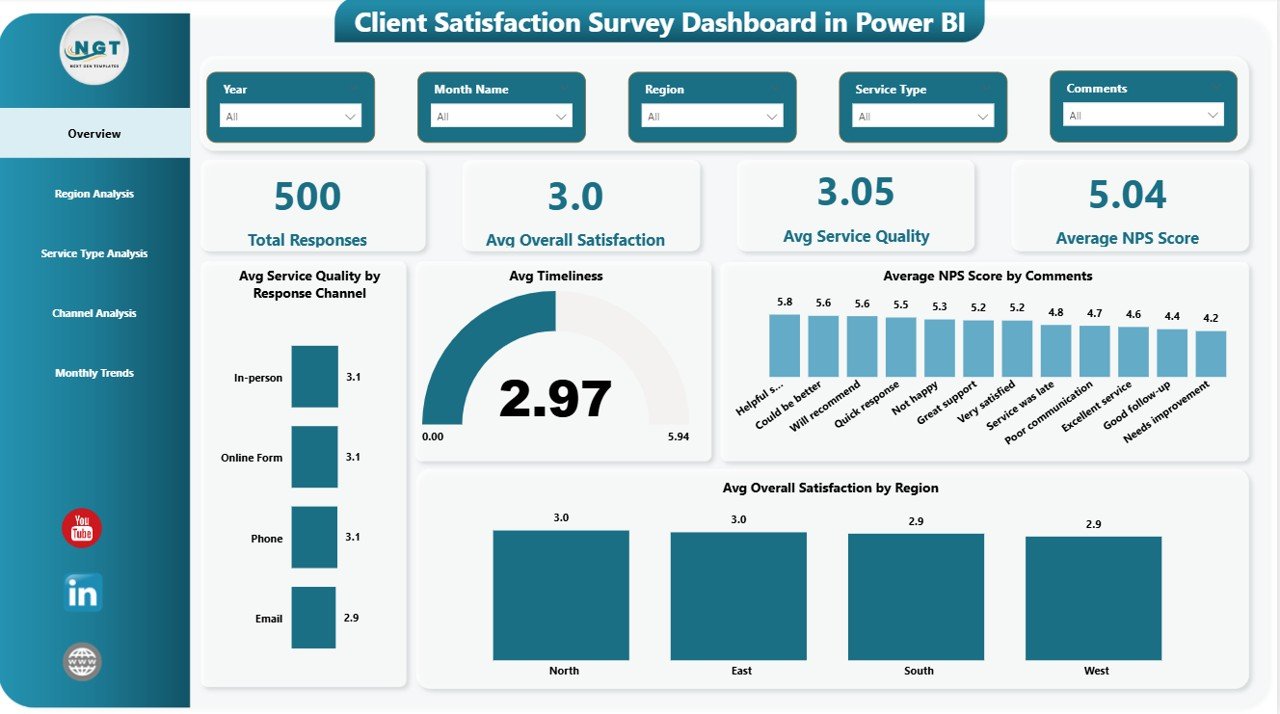
Overview Page: How Is Overall Client Satisfaction Performing?
The Overview Page acts as the main summary screen of the dashboard. It provides a quick snapshot of overall performance.
Key Elements on the Overview Page
- Slicers
Users filter data by key dimensions such as region, service type, or response channel. - KPI Cards
These cards highlight critical performance indicators:
Total Responses
Average Overall Satisfaction
Average Service Quality
Average NPS Score
Visual Insights
Average Service Quality by Response Channel
Average Timeliness
Average NPS Score by Comments
Average Overall Satisfaction by Region
Because everything appears on one page, leaders understand client sentiment within seconds.
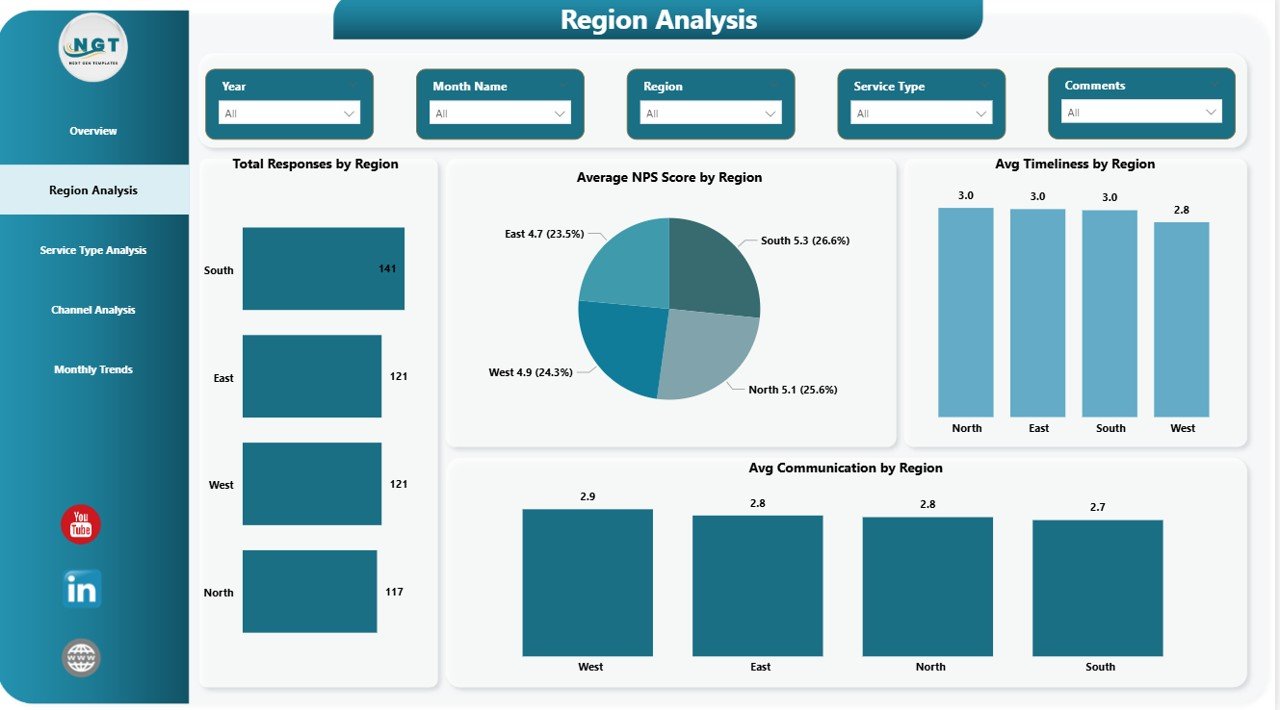
Region Analysis Page: How Do Clients Feel Across Different Regions?
Client satisfaction often varies by location. Therefore, regional analysis becomes essential.
Key Insights on the Region Analysis Page
- Total Responses by Region
Understand response volume across regions. - Average NPS Score by Region
Identify regions with loyal or dissatisfied clients. - Average Timeliness by Region
Track service delivery efficiency region-wise. - Average Communication by Region
Evaluate communication effectiveness.
With these visuals, management can focus improvement efforts on specific regions.
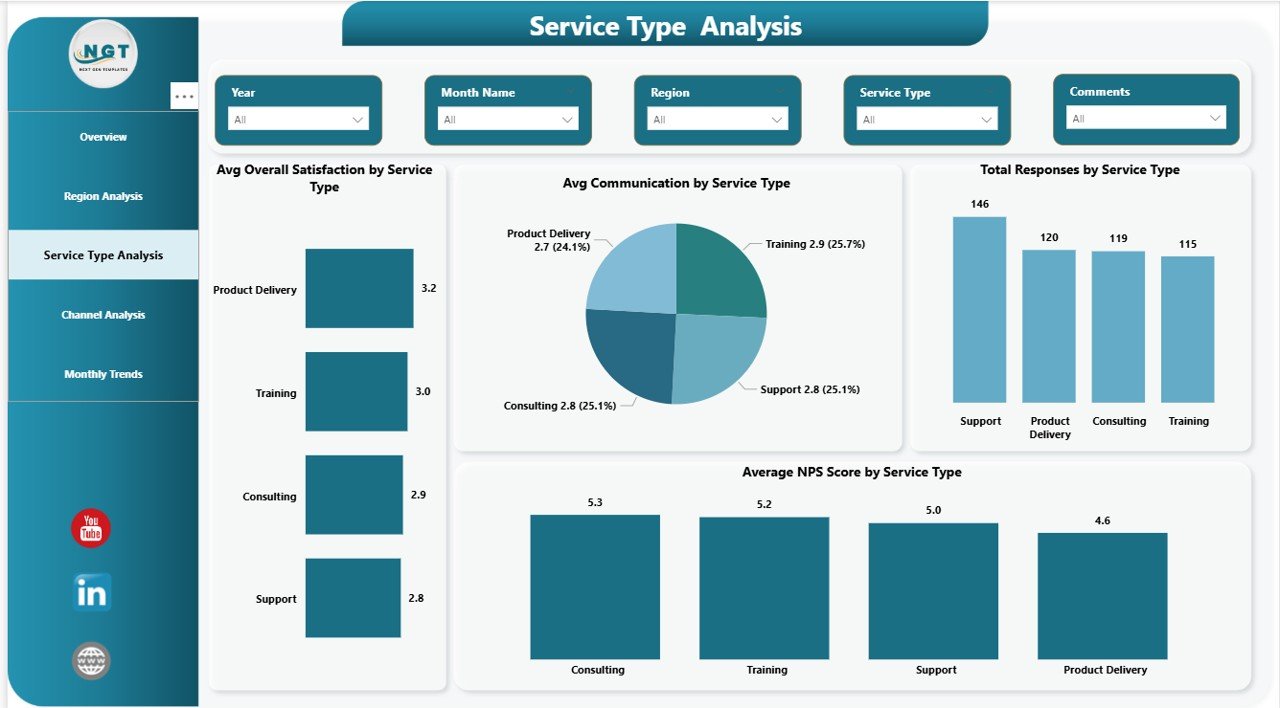
Service Type Analysis Page: Which Services Perform Better?
Not all services deliver the same client experience. Hence, service-level analysis matters.
Key Charts on the Service Type Analysis Page
- Average Overall Satisfaction by Service Type
Measure satisfaction levels for each service. - Average Communication by Service Type
Analyze how well teams communicate across services. - Total Responses by Service Type
Identify which services receive more feedback. - Average NPS Score by Service Type
Understand promoter and detractor patterns.
This page helps service managers improve underperforming offerings.
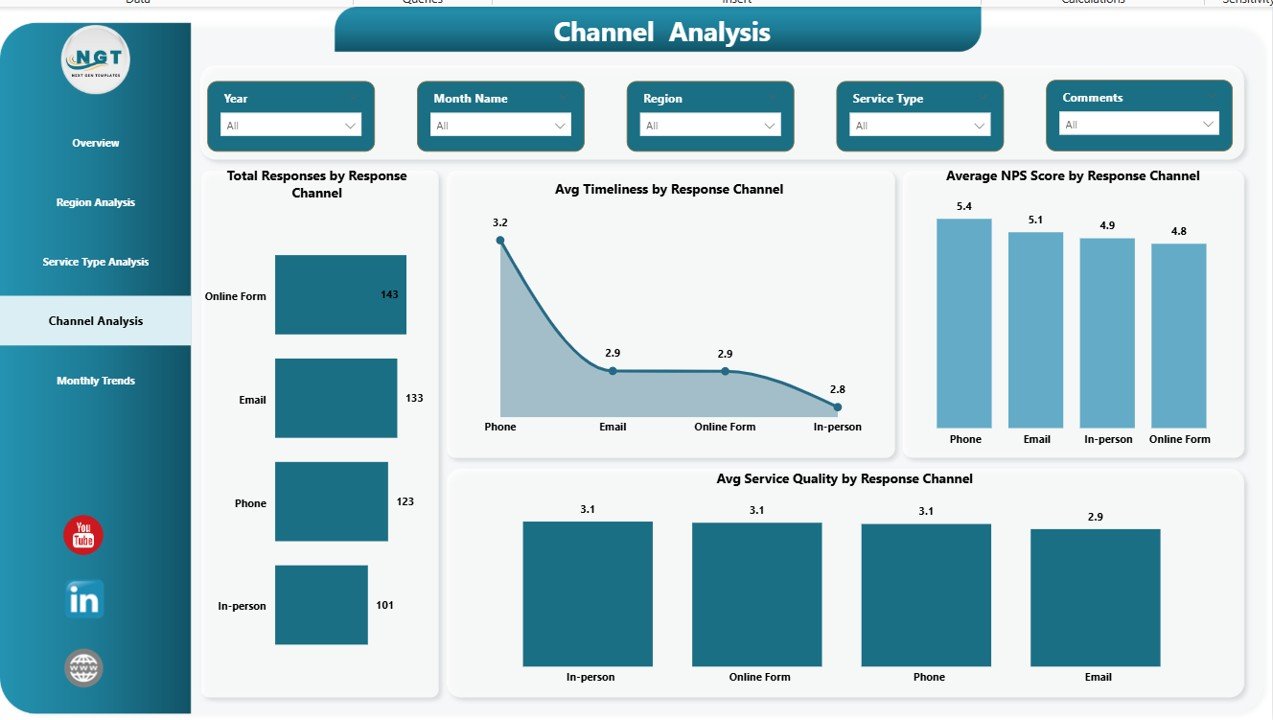
Channel Analysis Page: Which Channels Deliver the Best Experience?
Clients interact through multiple channels. Therefore, channel performance impacts satisfaction.
Key Metrics on the Channel Analysis Page
- Total Responses by Response Channel
Track usage of email, phone, chat, or in-person channels. - Average Timeliness by Response Channel
Measure response speed per channel. - Average NPS Score by Response Channel
Identify channels driving loyalty. - Average Service Quality by Response Channel
Compare service consistency.
As a result, organizations optimize their strongest channels while fixing weak ones.
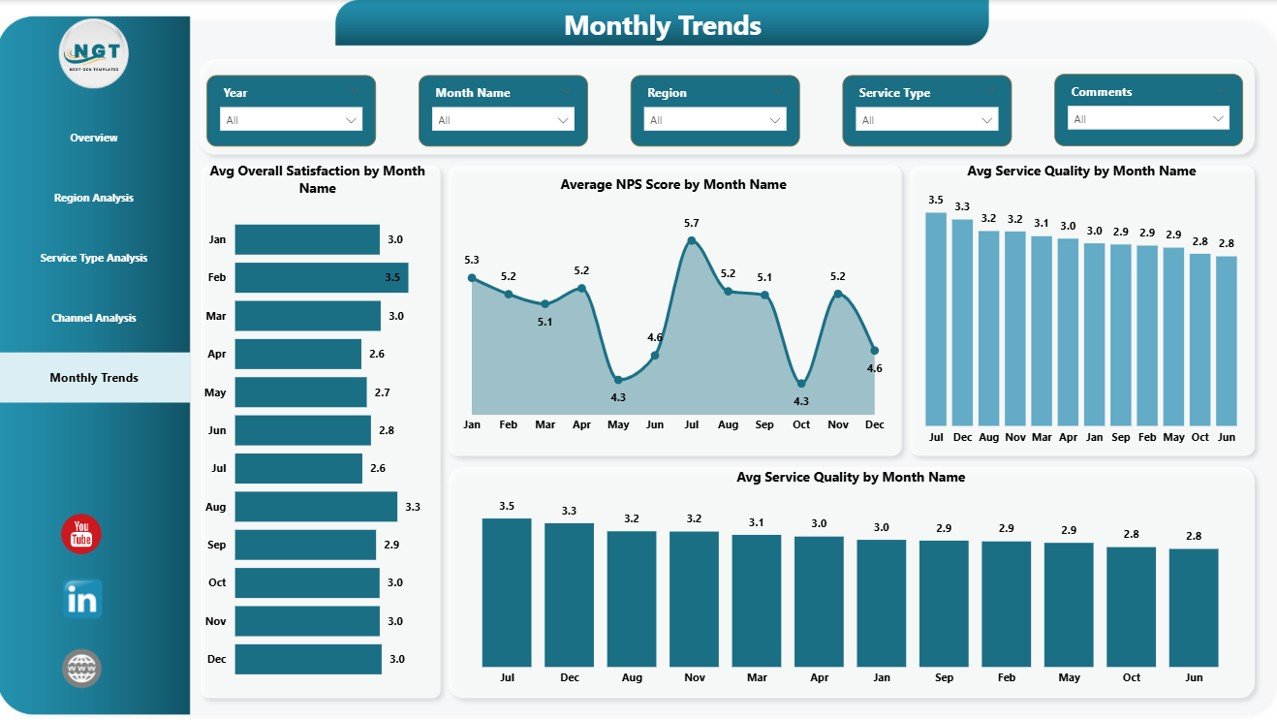
Monthly Trends Page: How Is Client Satisfaction Changing Over Time?
Trends reveal long-term performance patterns. Therefore, monthly analysis supports strategic planning.
Key Trend Visuals on the Monthly Trends Page
- Average Overall Satisfaction by Month
- Average NPS Score by Month
- Average Service Quality by Month
- Average Timeliness by Month
These visuals help teams track improvements, seasonal patterns, and declines early.
Advantages of Client Satisfaction Survey Dashboard in Power BI
Using a Client Satisfaction Survey Dashboard in Power BI offers several strong advantages.
Key Advantages
- Centralized Feedback Analysis
All survey insights appear in one dashboard. - Faster Decision-Making
Visual insights reduce analysis time. - Improved Client Retention
Early issue detection prevents churn. - Better Service Quality
Teams fix issues based on real data. - Scalable and Flexible
Power BI supports growing data volumes. - Professional Reporting
Clean visuals improve management presentations.
Because of these benefits, organizations gain a competitive edge.
Who Can Use a Client Satisfaction Survey Dashboard?
This dashboard works across industries and teams, including:
- Customer Experience Teams
- Service Operations Teams
- Sales and Account Managers
- Regional Managers
- Senior Leadership
- Consulting Firms
Therefore, it fits both operational and strategic use cases.
Best Practices for the Client Satisfaction Survey Dashboard in Power BI
Following best practices ensures maximum value from the dashboard.
- Use Clean and Consistent Survey Data
Always standardize rating scales and comments.
- Update Data Regularly
Refresh survey data weekly or monthly.
- Focus on Actionable KPIs
Track satisfaction, NPS, timeliness, and communication.
- Segment Data Smartly
Use regions, channels, and service types for deeper insights.
- Monitor Trends Continuously
Identify declines early before they impact retention.
- Share Insights with Teams
Use dashboards in review meetings.
- Combine Quantitative and Qualitative Feedback
Analyze scores along with comments.
By following these practices, organizations achieve consistent improvement.
How Does This Dashboard Improve Customer Experience?
The dashboard improves customer experience because it:
- Identifies service gaps quickly
- Highlights unhappy client segments
- Tracks improvement initiatives
- Aligns teams around customer goals
- Supports data-driven decisions
As a result, businesses build long-term client trust.
Conclusion: Why Should You Use a Client Satisfaction Survey Dashboard in Power BI?
Client feedback holds the key to business growth. However, without proper analysis, it loses value. A Client Satisfaction Survey Dashboard in Power BI transforms raw survey data into powerful insights.
With structured pages, interactive slicers, and trend analysis, this dashboard helps organizations understand clients better, improve services, and increase loyalty. Because Power BI delivers speed, accuracy, and flexibility, it becomes the ideal platform for client satisfaction analysis.
If your organization wants to improve customer experience and decision-making, this dashboard becomes a must-have solution.
Frequently Asked Questions (FAQs)
What is a Client Satisfaction Survey Dashboard in Power BI?
It is an interactive dashboard that visualizes client feedback, satisfaction scores, and NPS using Power BI.
Why should businesses use this dashboard?
It helps analyze survey data quickly, identify issues, and improve customer experience.
Can I use Excel as a data source?
Yes, the dashboard commonly uses Excel survey files as input.
Does this dashboard support filtering?
Yes, slicers allow filtering by region, service type, and channel.
Is this dashboard suitable for any industry?
Yes, it works across service-based and customer-focused industries.
How often should data be updated?
Organizations should update data monthly or weekly for best results.
Can this dashboard track trends over time?
Yes, the Monthly Trends page shows performance changes over time.
Visit our YouTube channel to learn step-by-step video tutorials
Watch the step-by-step video tutorial: