The medical devices industry demands precision, compliance, and consistent performance. Every month, teams monitor production output, defect rates, regulatory metrics, sales growth, and service performance. However, many organizations still rely on static Excel reports and manual consolidation.
As a result, managers lose time. Leaders miss trends. Decision-makers struggle to compare targets with actual results.
So, how can you track Month-to-Date (MTD) and Year-to-Date (YTD) KPIs, compare performance with previous year data, and monitor target achievement in one interactive system?You need a Medical Devices KPI Dashboard in Power BI.In this complete guide, you will learn:
- What a Medical Devices KPI Dashboard in Power BI is
- Why medical device companies need it
- Detailed explanation of all 3 dashboard pages
- Excel data structure used as source
- Important KPIs to track
- Advantages of the Medical Devices KPI Dashboard in Power BI
- Best Practices for the Medical Devices KPI Dashboard in Power BI
- Frequently Asked Questions
Click to buy Medical Devices KPI Dashboard in Power BI
What Is a Medical Devices KPI Dashboard in Power BI?
A Medical Devices KPI Dashboard in Power BI is a ready-to-use performance monitoring solution. It helps organizations track critical KPIs related to production, quality, compliance, sales, and operations.
Instead of managing multiple Excel files, you can centralize all KPI data in one interactive Power BI report. Moreover, you can instantly compare:
- Actual vs Target performance
- Current Year vs Previous Year results
- MTD vs YTD progress
- KPI groups and categories
Therefore, leadership teams gain clarity. At the same time, operational managers take faster actions.
Why Do Medical Device Companies Need a KPI Dashboard?
Medical device companies operate in a highly regulated and competitive market. Therefore, performance tracking becomes critical.
Without structured KPI monitoring:
- Production delays increase
- Defect rates rise
- Compliance risks grow
- Sales targets get missed
- Service response times slow down
However, when you implement a Medical Devices KPI Dashboard in Power BI:
- You monitor performance in real time
- You detect gaps early
- You compare targets with actual values
- You improve accountability
- You support data-driven decisions
As a result, your organization improves efficiency and reduces risk.
What Are the Key Features of the Medical Devices KPI Dashboard in Power BI?
This ready-to-use dashboard contains 3 interactive pages in the Power BI Desktop file. Moreover, it uses an Excel file as the data source, which makes data entry simple and structured.
Let us explore each page in detail.
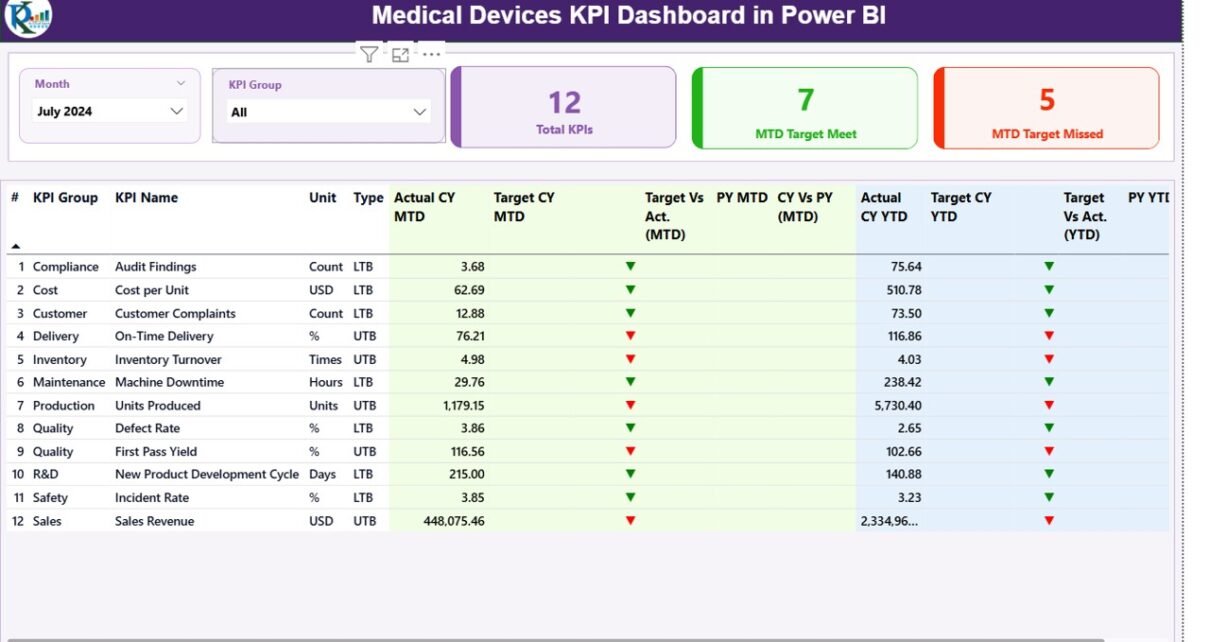
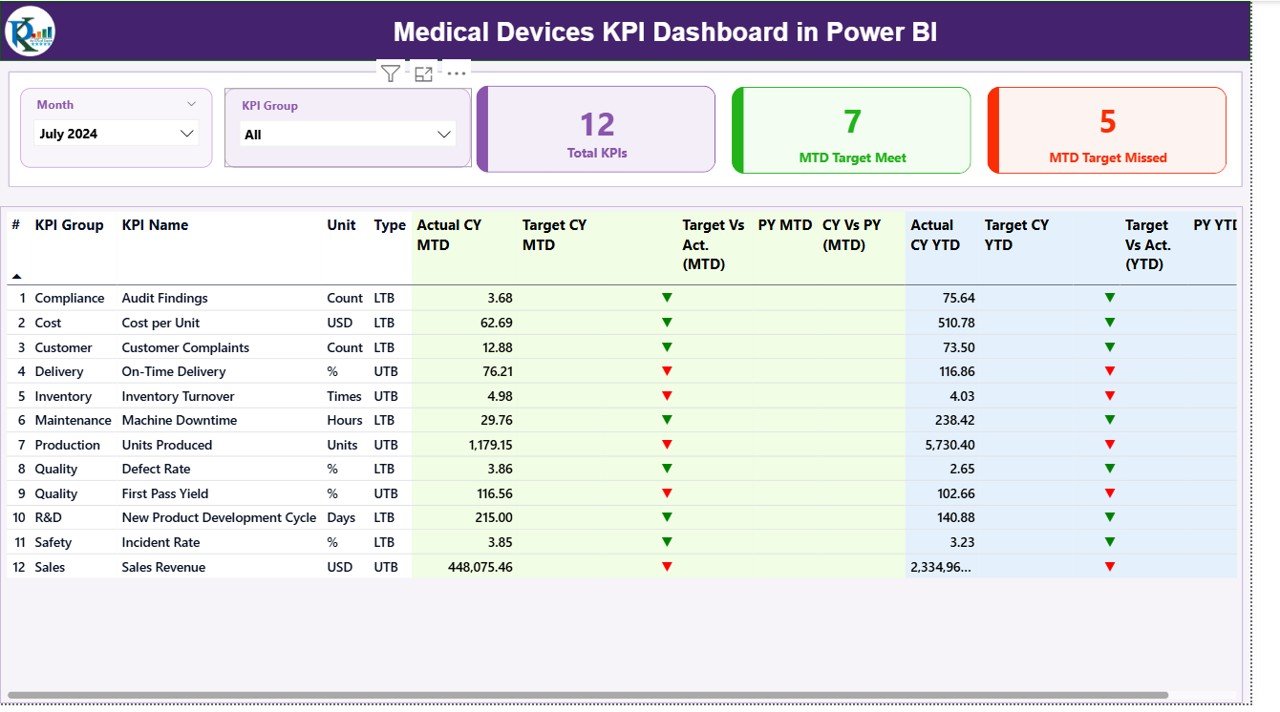
Summary Page – How Does It Provide Instant KPI Visibility?
The Summary Page acts as the main control center of the dashboard.
At the top, you will find:
- Month slicer
- KPI Group slicer
These slicers allow you to filter the dashboard dynamically. Therefore, you can analyze any month or KPI group instantly.
KPI Cards Section
On this page, you will see three powerful KPI cards:
- Total KPIs Count
- MTD Target Meet Count
- MTD Target Missed Count
These cards immediately show how many KPIs meet their targets and how many require attention.
Detailed KPI Table
Below the cards, you will find a detailed KPI performance table. This table contains the following fields:
- KPI Number – Sequence number of KPI
- KPI Group – Category of KPI
- KPI Name – Name of performance indicator
- Unit – Measurement unit
- Type – LTB (Lower the Better) or UTB (Upper the Better)
MTD Section
- Actual CY MTD
- Target CY MTD
- MTD Icon (▲ Green / ▼ Red)
- Target Vs Act. (MTD)
- PY MTD
- CY Vs PY (MTD)
The dashboard calculates:
Target vs Actual (MTD) = Actual MTD / Target MTD
CY vs PY (MTD) = Current Year MTD / Previous Year MTD
Therefore, managers instantly understand performance trends.
YTD Section
Similarly, the dashboard displays:
- Actual CY YTD
- Target CY YTD
- YTD Icon
- Target Vs Act. (YTD)
- PY YTD
- CY Vs PY (YTD)
These metrics help leadership evaluate long-term performance.
Click to buy Medical Devices KPI Dashboard in Power BI
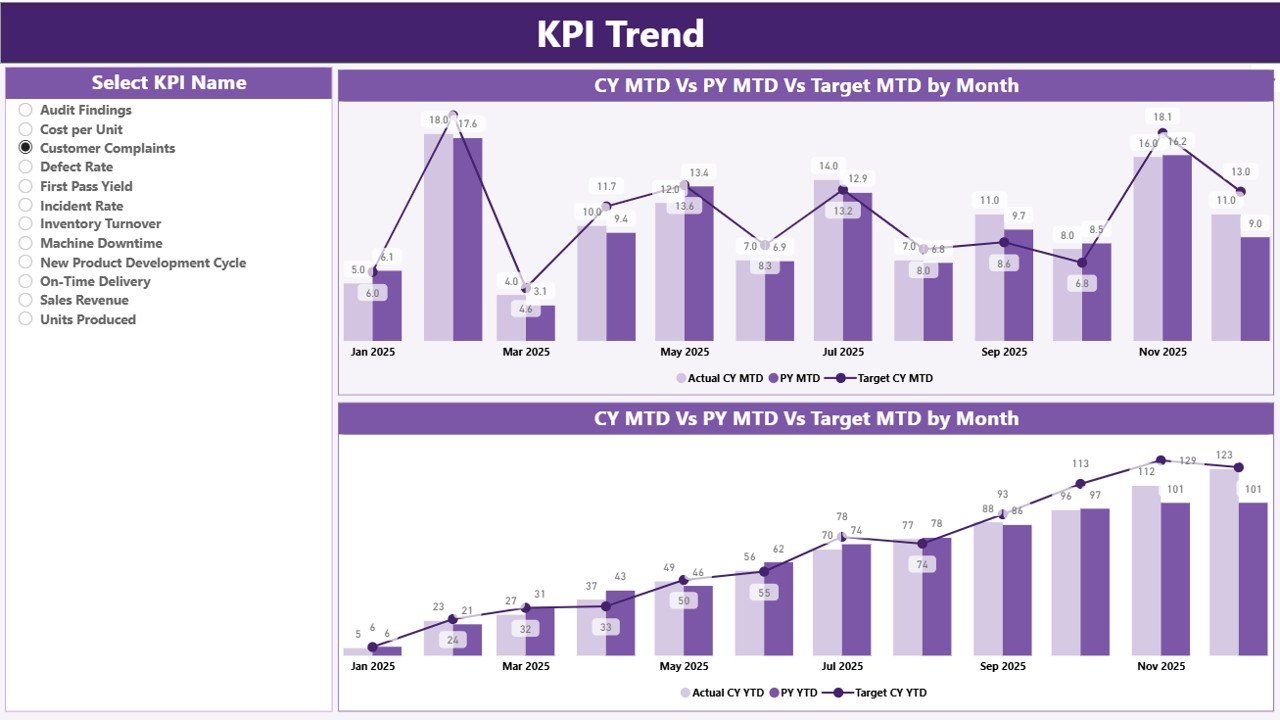
KPI Trend Page – How Can You Analyze Performance Over Time?
The KPI Trend Page focuses on visual trend analysis.
On the left side, you will find a KPI Name slicer. Therefore, you can select any KPI for detailed review.
This page includes:
- Combo chart for MTD
- Combo chart for YTD
Each chart displays:
- Current Year Actual
- Previous Year Actual
- Target
Because of this comparison, you can quickly identify:
- Growth patterns
- Declining performance
- Target gaps
- Year-over-year changes
As a result, you make better forecasting decisions.
Click to buy Medical Devices KPI Dashboard in Power BI
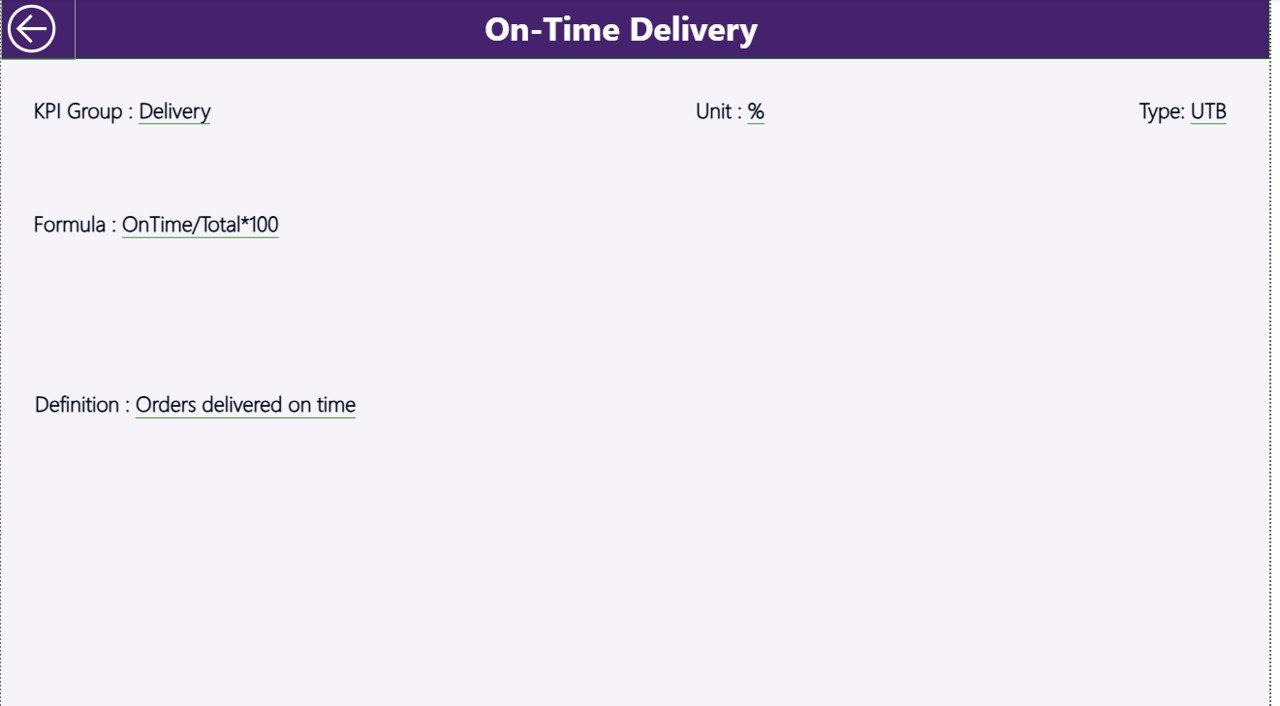
KPI Definition Page – Why Is KPI Clarity Important?
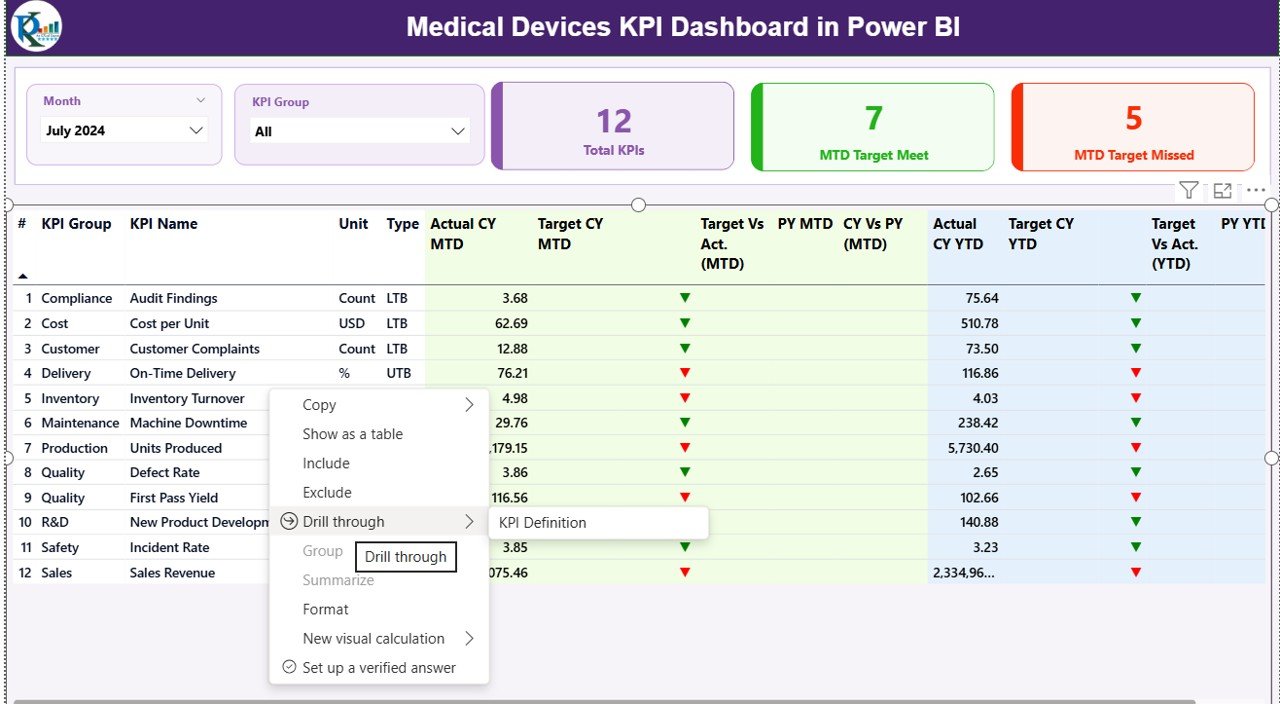
The KPI Definition Page acts as a drill-through page.
From the Summary Page, you can right-click on any KPI and drill through to see:
- KPI Formula
- KPI Definition
- KPI Type
This feature improves transparency. Moreover, it ensures that every department understands how you calculate each KPI.
To return to the main page, simply click the back button on the top left corner.
Click to buy Medical Devices KPI Dashboard in Power BI
What Excel Data Structure Does the Dashboard Use?
The dashboard uses an Excel file as the data source. Therefore, data entry remains simple and organized.
The Excel file contains three worksheets:
Input_Actual Sheet
In this sheet, you enter:
- KPI Name
- Month (use first date of month)
- MTD value
- YTD value
You only need to update numbers monthly.
Click to buy Medical Devices KPI Dashboard in Power BI
Input_Target Sheet
In this sheet, you enter:
- KPI Name
- Month
- MTD Target
- YTD Target
This sheet stores performance goals.
KPI Definition Sheet
In this sheet, you enter:
- KPI Number
- KPI Group
- KPI Name
- Unit
- Formula
- Definition
- Type (LTB or UTB)
This structured approach ensures accuracy and consistency.
What Important KPIs Should Medical Device Companies Track?
Although KPIs vary by organization, medical device companies commonly track:
Production KPIs
- Production Volume
- On-Time Production Rate
- Machine Utilization Rate
- Scrap Rate
Quality KPIs
- Defect Rate
- First Pass Yield
- CAPA Closure Rate
- Customer Complaint Rate
Regulatory KPIs
- Audit Findings
- Compliance Score
- Documentation Accuracy
Sales KPIs
- Monthly Revenue
- Order Fulfillment Rate
- Sales Growth Rate
- Distributor Performance
Service KPIs
- Service Response Time
- Device Downtime
- Warranty Claims
When you track these KPIs using Power BI, you gain real-time insights.
How Does MTD and YTD Tracking Improve Decision-Making?
MTD tracking helps you:
- Monitor short-term performance
- Take quick corrective action
- Stay aligned with monthly targets
On the other hand, YTD tracking helps you:
- Measure long-term trends
- Compare yearly performance
- Adjust annual strategies
Therefore, combining MTD and YTD gives a complete performance picture.
Advantages of Medical Devices KPI Dashboard in Power BI
Now let us look at the major benefits.
- Centralized Performance Monitoring
You manage all KPIs in one interactive report. Therefore, you eliminate scattered Excel files.
Real-Time Target Comparison
You instantly see whether KPIs meet targets. Moreover, visual icons make analysis simple.
Year-over-Year Comparison
You compare CY vs PY performance easily. As a result, you identify growth patterns.
Improved Accountability
Every KPI includes clear definitions. Therefore, teams understand responsibility.
Faster Decision-Making
Interactive slicers allow quick filtering. Consequently, leadership acts faster.
Scalable Structure
You can add new KPIs anytime. Thus, the dashboard grows with your business.
Best Practices for the Medical Devices KPI Dashboard in Power BI
To maximize results, follow these best practices:
- Define Clear KPI Ownership
Assign each KPI to a specific department. Therefore, accountability improves.
- Update Data Monthly Without Delay
Maintain a fixed update schedule. Consequently, reports stay accurate.
- Use LTB and UTB Correctly
Classify KPIs properly. For example:
- Defect Rate → Lower the Better
- Revenue → Upper the Better
This ensures correct performance interpretation.
- Validate Excel Inputs
Check data accuracy before refresh. Therefore, you avoid wrong analysis.
- Review Trends Regularly
Do not rely only on summary numbers. Instead, analyze trend charts frequently.
- Use Drill-Through for Clarity
Always review KPI definitions to avoid confusion.
How Can This Dashboard Improve Regulatory Compliance?
Medical device companies must follow strict regulations. Therefore, tracking compliance KPIs becomes critical.
This dashboard helps you:
- Monitor audit findings
- Track documentation accuracy
- Review CAPA closures
- Compare compliance targets
As a result, you reduce regulatory risk.
How Does This Dashboard Support Strategic Planning?
Strategic planning requires accurate data.
With this dashboard, you can:
- Identify underperforming KPIs
- Allocate resources efficiently
- Adjust production goals
- Improve forecasting
Therefore, leadership gains stronger strategic control.
Conclusion
The medical devices industry demands precision, compliance, and performance control. However, manual reporting slows down analysis and increases risk.
The Medical Devices KPI Dashboard in Power BI transforms performance tracking into a structured, interactive, and visual experience.
Because it integrates MTD, YTD, target comparison, and previous year analysis, it provides complete performance clarity. Moreover, its Excel-based data structure keeps updates simple and organized.
If you want to improve accountability, enhance visibility, and drive better decisions, this dashboard offers the perfect solution.
Frequently Asked Questions (FAQs)
- What is a Medical Devices KPI Dashboard in Power BI?
It is an interactive performance monitoring tool that tracks production, quality, compliance, and sales KPIs using Power BI.
- Can I customize KPIs in this dashboard?
Yes. You can add or modify KPIs in the Excel source file and update the dashboard.
- What does LTB and UTB mean?
LTB means Lower the Better. UTB means Upper the Better.
- How often should I update the dashboard?
You should update it monthly to maintain accurate MTD and YTD tracking.
- Do I need advanced Power BI skills to use it?
No. The dashboard comes ready to use. You only need to update Excel data.
- Can I track previous year comparisons?
Yes. The dashboard automatically calculates CY vs PY percentages.
Visit our YouTube channel to learn step-by-step video tutorials
Watch the step-by-step video tutorial:
Click to buy Medical Devices KPI Dashboard in Power BI