Marketing today moves fast. Campaigns launch every week. Products compete for attention. Teams spend budgets across channels. However, without clear data, even the best marketing strategy can fail.
So, how do you track revenue, conversion rate, campaign performance, and regional sales in one place?
The answer is simple.
Click to Purchases Product Marketing Dashboard in Power BI
You need a Product Marketing Dashboard in Power BI.
This detailed guide will help you understand everything about this powerful dashboard. Moreover, it will show you how to use it to increase revenue, improve conversion rates, and hit your sales targets consistently.
What Is a Product Marketing Dashboard in Power BI?
A Product Marketing Dashboard in Power BI is an interactive business intelligence tool that tracks marketing and sales performance across products, categories, channels, and regions.
Instead of using multiple Excel files, scattered reports, and manual calculations, you can:
-
Monitor revenue in real time
-
Compare actual sales vs target sales
-
Analyze conversion rates
-
Track campaign performance
-
Evaluate marketing managers
-
Study monthly trends
As a result, you make faster and smarter decisions.
Power BI allows you to:
-
Use slicers (filters) for dynamic analysis
-
Visualize KPIs using charts and cards
-
Drill down into detailed product performance
-
Compare regions and channels easily
Therefore, this dashboard becomes your central command center for product marketing.
Why Do Businesses Need a Product Marketing Dashboard?
Many businesses run multiple campaigns at once. However, they often struggle to answer simple questions:
-
Which product generates the highest revenue?
-
Which marketing manager delivers better conversions?
-
Which region misses sales targets?
-
Which channel drives better ROI?
-
Are monthly sales improving?
Without a structured system, teams guess instead of analyze.
However, when you implement a Product Marketing Dashboard in Power BI:
-
You remove guesswork.
-
You track performance clearly.
-
You improve accountability.
-
You align marketing and sales teams.
-
You increase profitability.
Therefore, this dashboard becomes a growth engine.
What Are the Key Pages of the Product Marketing Dashboard in Power BI?
This dashboard contains 5 powerful pages, each designed to analyze marketing performance from a different angle.
Let us explore them one by one.
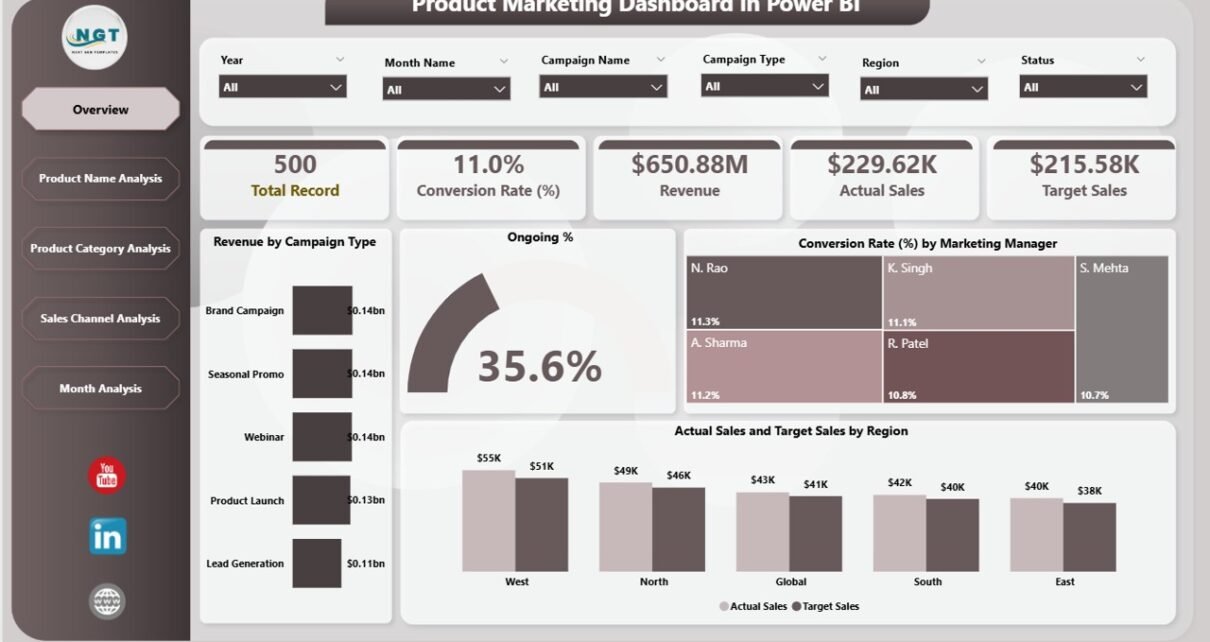
1️⃣ Overview Page – How Does Your Overall Marketing Performance Look?
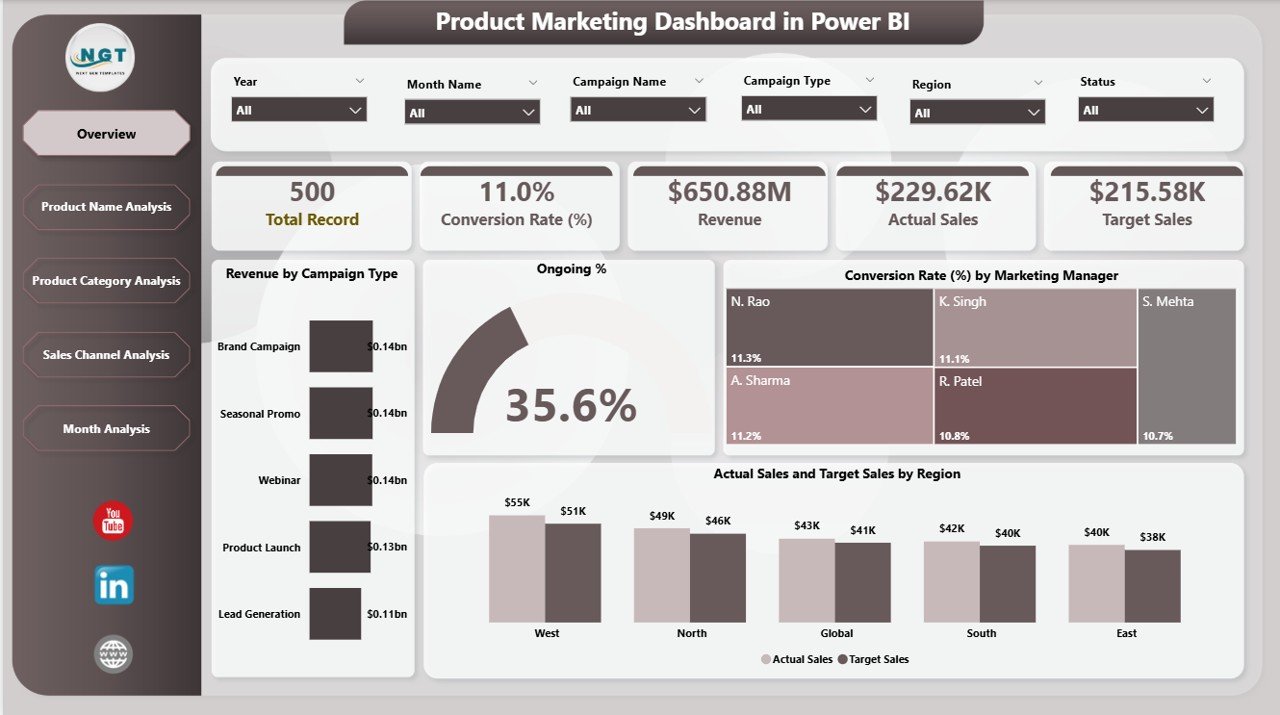
The Overview Page acts as the main control panel.
Here, you get a quick snapshot of your entire marketing performance.
Key Elements on the Overview Page:
-
Revenue by Campaign Type
-
Ongoing %
-
Conversion Rate by Marketing Manager
-
Actual Sales by Region
-
Target Sales by Region
What Can You Analyze Here?
✔ Which campaign type generates the most revenue
✔ Which marketing manager drives higher conversion rates
✔ Whether regions meet their sales targets
✔ Overall marketing health
Because this page gives instant visibility, management can make quick decisions during meetings.
Moreover, slicers allow you to filter data by:
-
Month
-
Region
-
Campaign type
-
Marketing manager
Therefore, you gain dynamic control over your data.
2️⃣ Product Name Analysis – Which Product Performs the Best?
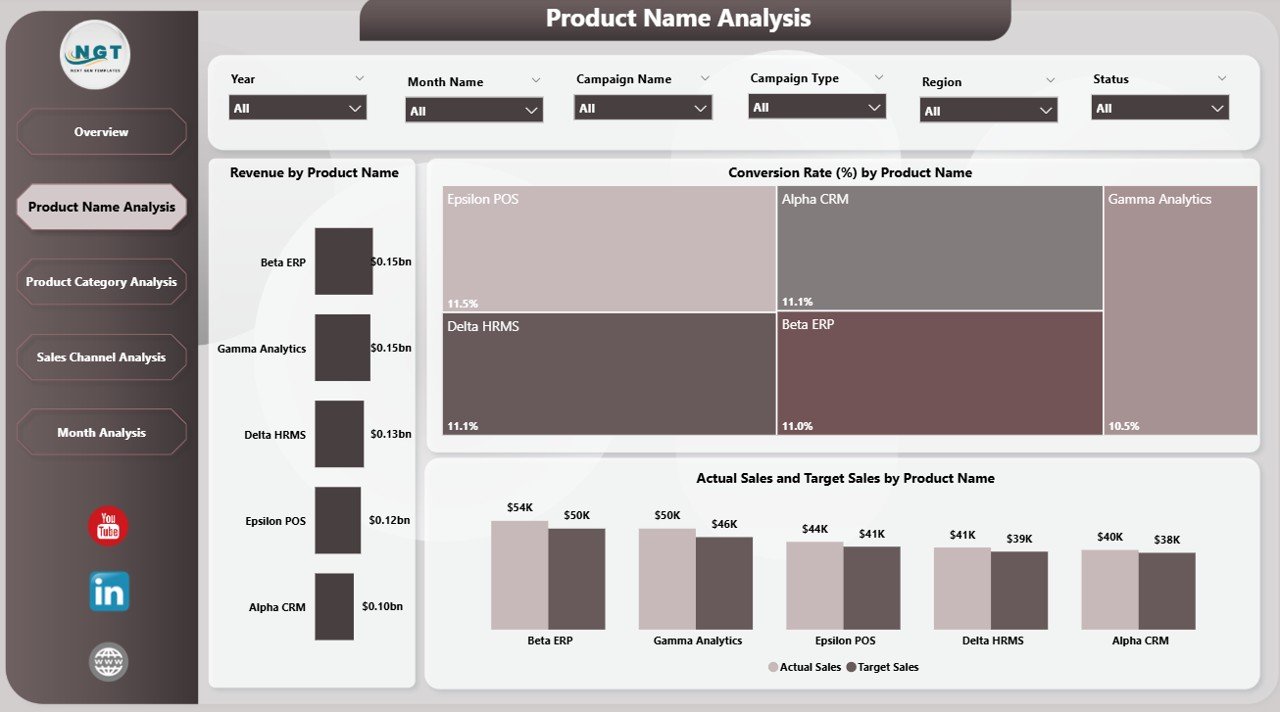
Products do not perform equally. Some drive high revenue. Others struggle.
The Product Name Analysis Page helps you understand product-level performance clearly.
Key Charts:
-
Revenue by Product Name
-
Conversion Rate by Product Name
-
Actual Sales vs Target Sales by Product Name
Why Is This Important?
Because product-level insights help you:
-
Identify top-performing products
-
Detect underperforming items
-
Improve marketing focus
-
Optimize product positioning
For example, if Product A shows high conversion but low revenue, you can increase pricing or upsell bundles.
On the other hand, if Product B shows high traffic but low conversion, you can improve landing pages.
Therefore, this page drives product strategy improvements.
Click to Purchases Product Marketing Dashboard in Power BI
3️⃣ Product Category Analysis – Which Category Drives Growth?
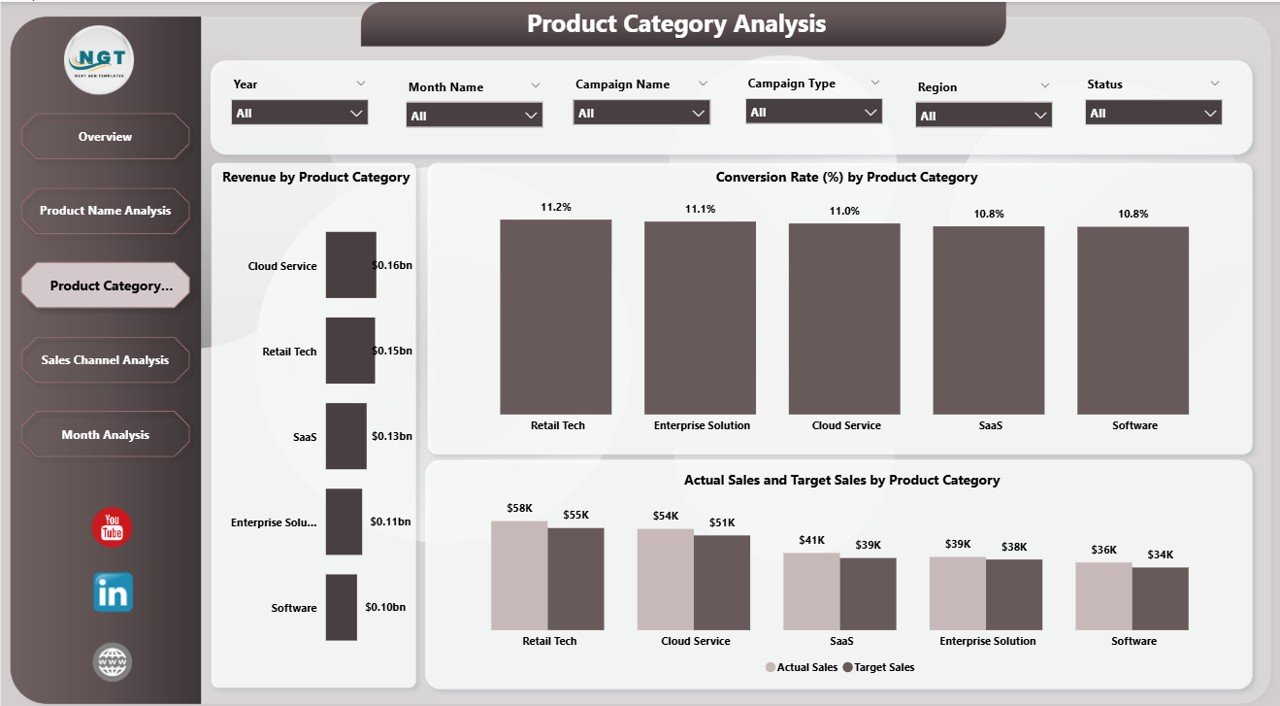
While product-level analysis helps with micro decisions, category-level analysis helps with macro strategy.
The Product Category Analysis Page includes:
-
Revenue by Product Category
-
Conversion Rate by Category
-
Actual vs Target Sales by Category
What Can You Learn?
✔ Which category generates maximum revenue
✔ Which category converts better
✔ Which category needs promotional push
Moreover, you can reallocate marketing budgets toward high-performing categories.
As a result, you maximize ROI.
4️⃣ Sales Channel Analysis – Which Channel Delivers the Best Results?
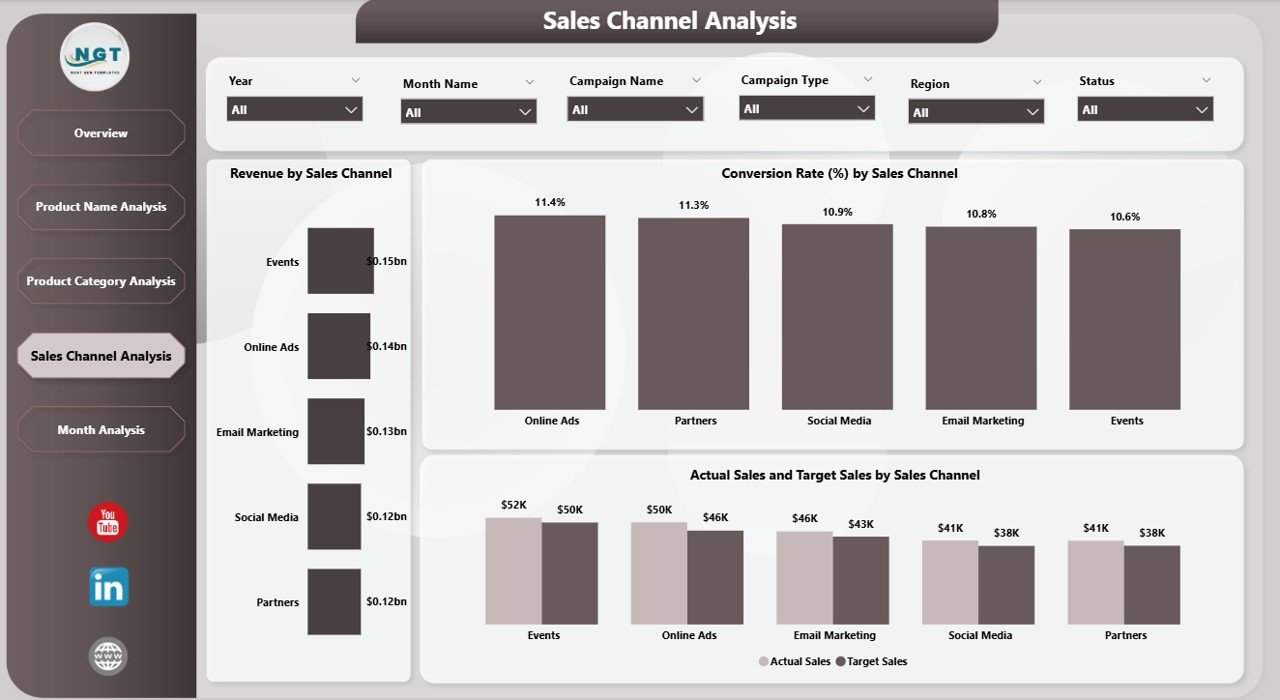
Marketing teams use multiple channels such as:
-
Social Media
-
Email Marketing
-
Paid Ads
-
Direct Sales
-
Website
-
Retail
However, without structured analysis, you cannot measure channel performance properly.
The Sales Channel Analysis Page provides:
-
Revenue by Channel
-
Conversion Rate by Channel
-
Actual Sales vs Target Sales by Channel
Why Does This Matter?
Because channel performance determines budget allocation.
For example:
-
If social media drives high revenue but low conversion, you may improve targeting.
-
If email marketing shows high conversion but low reach, you may increase campaign volume.
Therefore, this page helps optimize marketing spending.
5️⃣ Month Analysis – Are You Growing Month by Month?
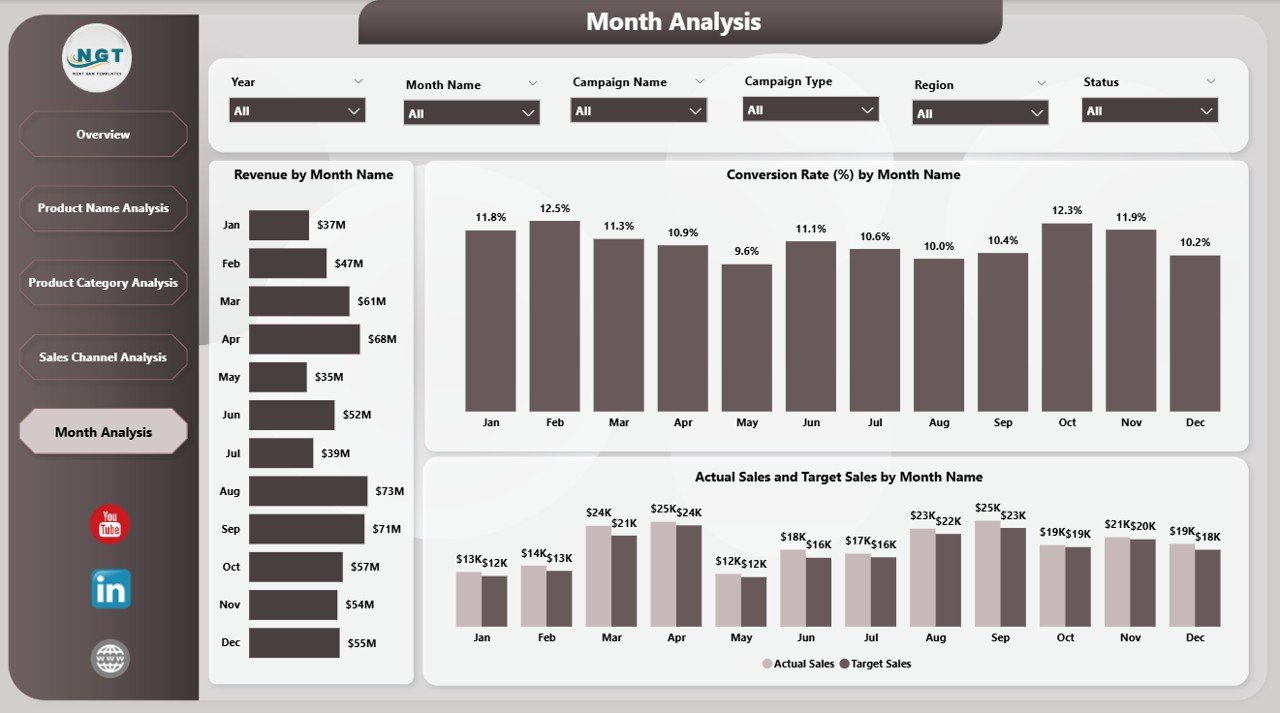
Growth tracking remains critical.
The Month Analysis Page includes:
-
Revenue by Month
-
Conversion Rate by Month
-
Actual Sales vs Target Sales by Month
Why Is Monthly Tracking Important?
Because:
-
You identify seasonal trends.
-
You compare month-over-month growth.
-
You evaluate campaign impact.
-
You plan future budgets better.
For example, if revenue drops in a specific month, you can investigate campaign changes.
Therefore, this page supports strategic forecasting.
Click to Purchases Product Marketing Dashboard in Power BI
What KPIs Should You Track in a Product Marketing Dashboard?
To make the dashboard effective, you should track strong KPIs.
Here are the essential ones:
-
Revenue
-
Target Sales
-
Actual Sales
-
Conversion Rate
-
Campaign Revenue
-
Ongoing Campaign %
-
Regional Sales Performance
-
Product-Level Revenue
-
Category-Level Revenue
-
Channel Performance
Moreover, you can add advanced KPIs like:
-
Customer Acquisition Cost (CAC)
-
Return on Marketing Investment (ROMI)
-
Lead-to-Sale Ratio
-
Sales Growth %
Therefore, your dashboard becomes comprehensive.
How Does Power BI Improve Marketing Reporting?
Power BI offers several advantages over traditional Excel reporting.
1️⃣ Interactive Visuals
Users can click and filter data instantly.
2️⃣ Real-Time Updates
When data updates, visuals refresh automatically.
3️⃣ Drill-Down Features
You can move from category level to product level easily.
4️⃣ Easy Sharing
You can share dashboards across teams.
5️⃣ Clean Data Modeling
Power BI manages relationships effectively.
Therefore, teams save time and reduce errors.
Advantages of Product Marketing Dashboard in Power BI
Let us explore the major benefits.
✔ Better Decision Making
You rely on data instead of assumptions.
✔ Increased Revenue
You focus on high-performing products and channels.
✔ Improved Accountability
Marketing managers track their performance clearly.
✔ Faster Reporting
You eliminate manual Excel reporting.
✔ Budget Optimization
You allocate funds to profitable campaigns.
✔ Target Achievement Monitoring
You compare actual vs target sales easily.
✔ Performance Transparency
Leadership views real-time data anytime.
Therefore, this dashboard directly supports business growth.
Best Practices for the Product Marketing Dashboard in Power BI
To get maximum results, follow these best practices.
1️⃣ Keep Data Clean
Ensure accurate and consistent data entry.
2️⃣ Use Meaningful KPIs
Do not overload the dashboard with unnecessary metrics.
3️⃣ Update Data Regularly
Schedule weekly or daily refresh.
4️⃣ Use Clear Visuals
Avoid clutter. Keep charts simple.
5️⃣ Align Targets Clearly
Define sales targets properly before analysis.
6️⃣ Review Monthly Trends
Always compare current month with previous month.
7️⃣ Train Your Team
Ensure marketing managers understand dashboard usage.
When you follow these practices, your dashboard delivers stronger insights.
How Can This Dashboard Improve ROI?
Marketing ROI depends on performance visibility.
Because this dashboard:
-
Identifies low-performing channels
-
Highlights profitable products
-
Tracks conversion rates
-
Monitors campaign efficiency
You can cut wasteful spending.
Moreover, you can increase investment in winning campaigns.
Therefore, ROI improves naturally.
Who Should Use the Product Marketing Dashboard?
Click to Purchases Product Marketing Dashboard in Power BI
This dashboard suits:
-
Marketing Managers
-
Sales Managers
-
Business Owners
-
E-commerce Companies
-
Product Managers
-
Regional Sales Heads
-
Digital Marketing Agencies
If your business sells products and runs campaigns, you need this dashboard.
How Do You Implement the Product Marketing Dashboard?
Follow these simple steps:
-
Prepare structured data in Excel.
-
Import data into Power BI.
-
Create relationships between tables.
-
Build measures for KPIs.
-
Design visual pages as described above.
-
Add slicers for dynamic filtering.
-
Publish dashboard to Power BI Service.
After implementation, monitor performance regularly.
Conclusion
Marketing success depends on data clarity.
However, scattered reports create confusion.
On the other hand, a Product Marketing Dashboard in Power BI brings structure, clarity, and insight into your marketing performance.
Because it tracks revenue, conversion rate, campaign performance, sales channels, product categories, and monthly trends, you gain full control over marketing strategy.
Moreover, you can:
-
Improve decision-making
-
Optimize budgets
-
Increase revenue
-
Achieve targets consistently
Therefore, if you want smarter marketing and measurable growth, you should implement this dashboard today.
Frequently Asked Questions (FAQs)
1️⃣ What is a Product Marketing Dashboard in Power BI?
It is an interactive dashboard that tracks marketing revenue, conversion rates, and sales performance using Power BI visuals.
2️⃣ How many pages does this dashboard include?
It includes 5 pages: Overview, Product Name Analysis, Product Category Analysis, Sales Channel Analysis, and Month Analysis.
3️⃣ Can I customize this dashboard?
Yes. You can add or modify KPIs based on business needs.
4️⃣ Does this dashboard support target vs actual comparison?
Yes. It compares actual sales and target sales across regions, products, channels, and months.
5️⃣ Who benefits the most from this dashboard?
Marketing managers, sales heads, and business owners benefit significantly.
6️⃣ Can small businesses use this dashboard?
Yes. Even small businesses can track marketing performance effectively using Power BI.
Visit our YouTube channel to learn step-by-step video tutorials