The insurance industry moves fast. Brokers handle hundreds of policies. Agents chase targets. Commissions change every month. Moreover, leaders need real-time numbers to make smart decisions.However, many brokerage firms still depend on scattered Excel sheets. As a result, managers struggle to track active policies, premium collection, and commission earnings clearly.So, how can insurance brokers monitor performance, revenue, payouts, and agent productivity in one place?You need an Insurance Brokers Dashboard in Power BI.This ready-to-use Power BI solution transforms raw insurance data into clear, interactive insights. Furthermore, it helps brokerage firms track total policies, premium collected, commission earned, and policy status instantly. Instead of reviewing multiple reports, leaders can filter, drill down, and analyze everything in seconds.
In this complete guide, you will learn:
- What an Insurance Brokers Dashboard in Power BI is
- Why insurance firms need it
- A detailed explanation of all 5 dashboard pages
- Key KPIs you can track
- Advantages of the Insurance Brokers Dashboard in Power BI
- Best Practices for the Insurance Brokers Dashboard
- Frequently Asked Questions with Answers
Click to buy Insurance Brokers Dashboard in Power BI
What Is an Insurance Brokers Dashboard in Power BI?
An Insurance Brokers Dashboard in Power BI is a centralized reporting system that helps brokers track policies, premiums, commissions, payouts, and agent performance in real time.
Instead of using manual summaries, this dashboard:
- Connects structured insurance data
- Calculates KPIs automatically
- Displays interactive charts
- Allows slicers for filtering
- Provides instant drill-down analysis
Moreover, it converts raw numbers into meaningful visuals. Therefore, management teams can make faster and smarter decisions.
Why Do Insurance Brokers Need a Power BI Dashboard?
Insurance brokerage firms manage complex data daily. For example:
- Multiple agents
- Different commission types
- Various payment modes
- Policy renewals
- Active, cancelled, and expired policies
Without a proper dashboard, decision-makers lose clarity.
However, when you use an Insurance Brokers Dashboard in Power BI, you:
- Monitor agent productivity
- Track commission structures
- Identify cancellation patterns
- Analyze revenue sources
- Improve payout planning
As a result, you increase transparency and profitability.
Complete Explanation of All 5 Dashboard Pages
This Insurance Brokers Dashboard includes five powerful analytical pages. Each page focuses on a specific business area.
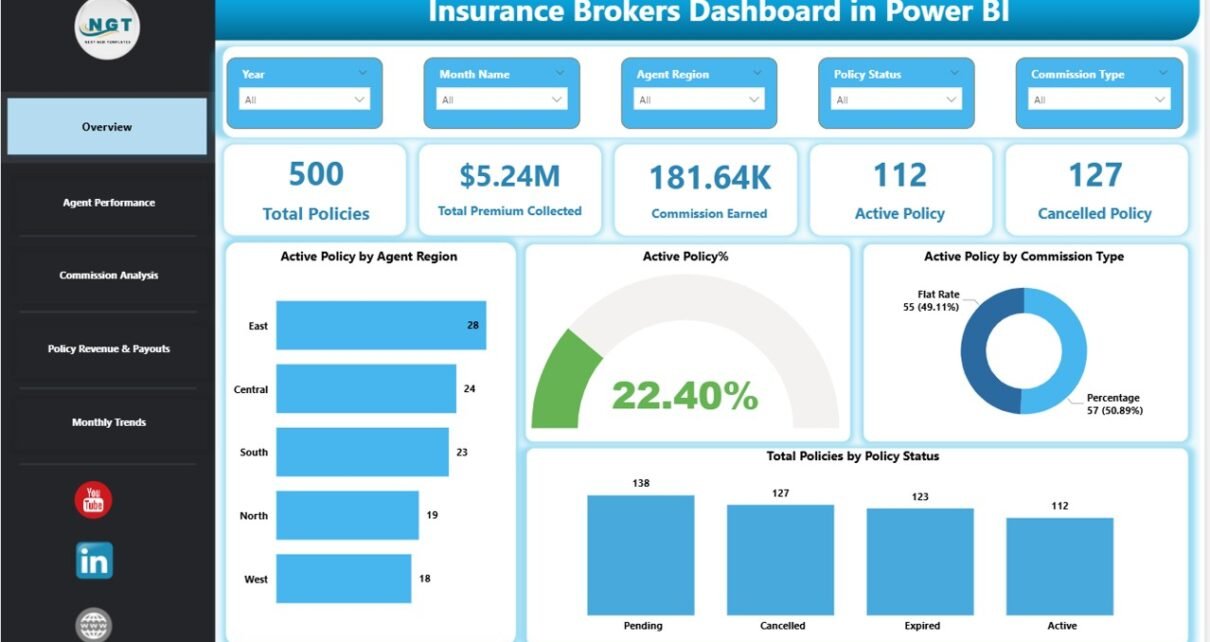
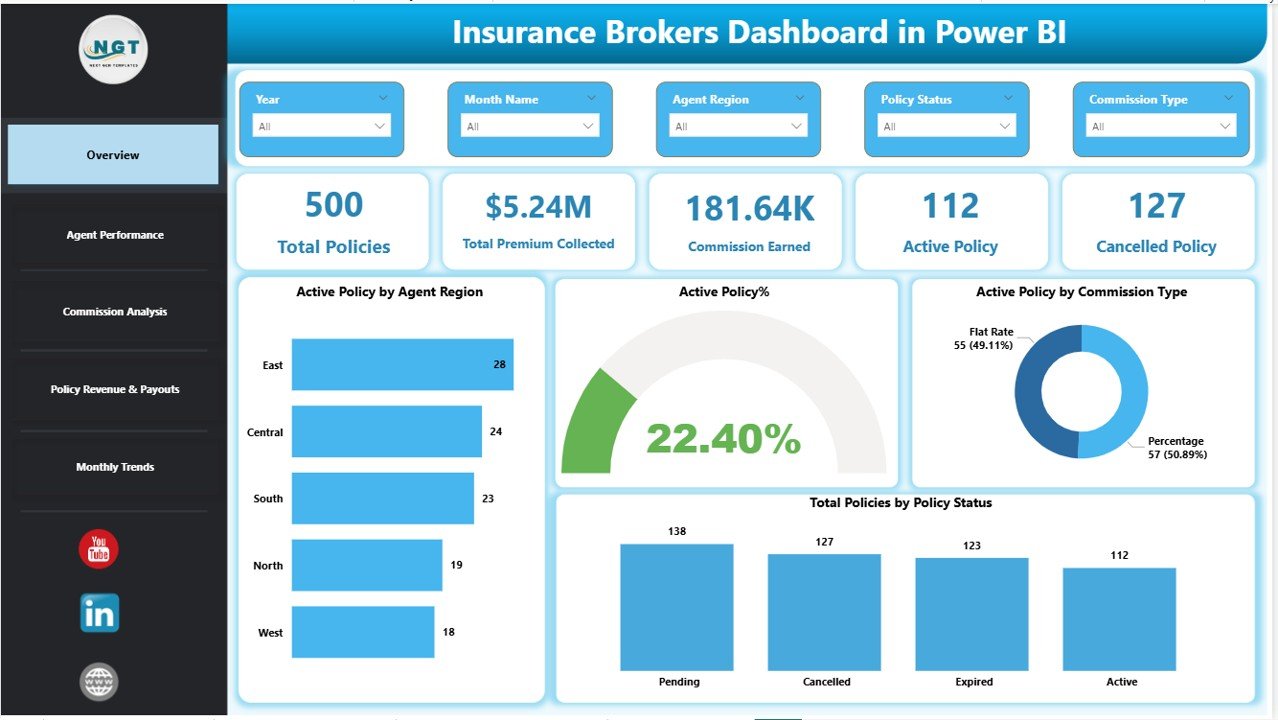
Overview Page – What Does It Show?
The Overview Page acts as the command center of the dashboard.
Key KPI Cards
This page displays 5 powerful KPI cards:
- Total Policies
- Total Premium Collected
- Commission Earned
- Active Policies
- Cancelled Policies
These cards instantly show business health.
Additional Insights on Overview Page
Besides KPI cards, this page includes:
- Active Policy by Agent Region
- Active Policy %
- Active Policy by Commission Type
- Total policy by policy status
Moreover, slicers allow filtering by:
- Agent
- Region
- Commission Type
- Policy Status
- Payment Mode
Therefore, managers can analyze performance within seconds.
Click to buy Insurance Brokers Dashboard in Power BI
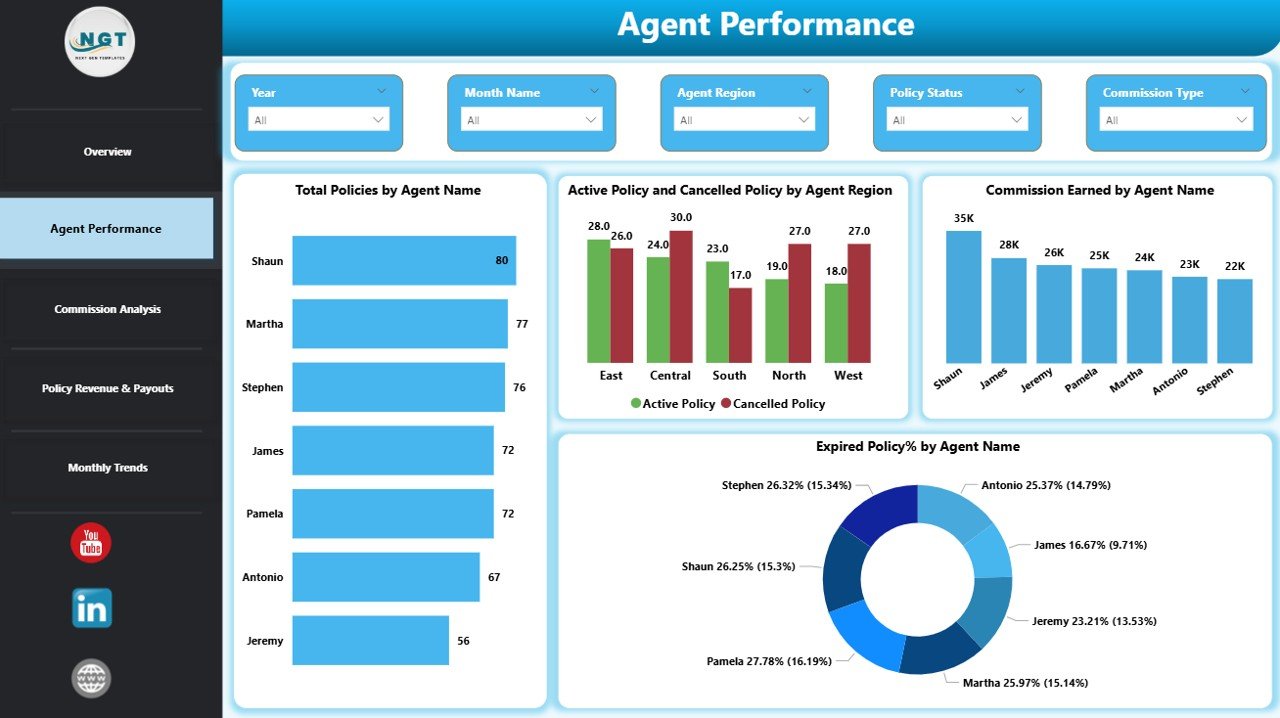
Agent Performance Dashboard – How Do Agents Perform?
Agent performance directly impacts revenue. Therefore, this page focuses on productivity and risk indicators.
Key Charts on Agent Performance Page
- Total Policies by Agent Name
- Active and Cancelled Policies by Agent Name
- Commission Earned by Agent Name
- Expired Policy % by Agent Name
As a result, management can:
- Identify top-performing agents
- Detect agents with high cancellations
- Monitor commission contribution
- Improve agent training strategies
Moreover, slicers help filter performance by time period or policy type.
Click to buy Insurance Brokers Dashboard in Power BI
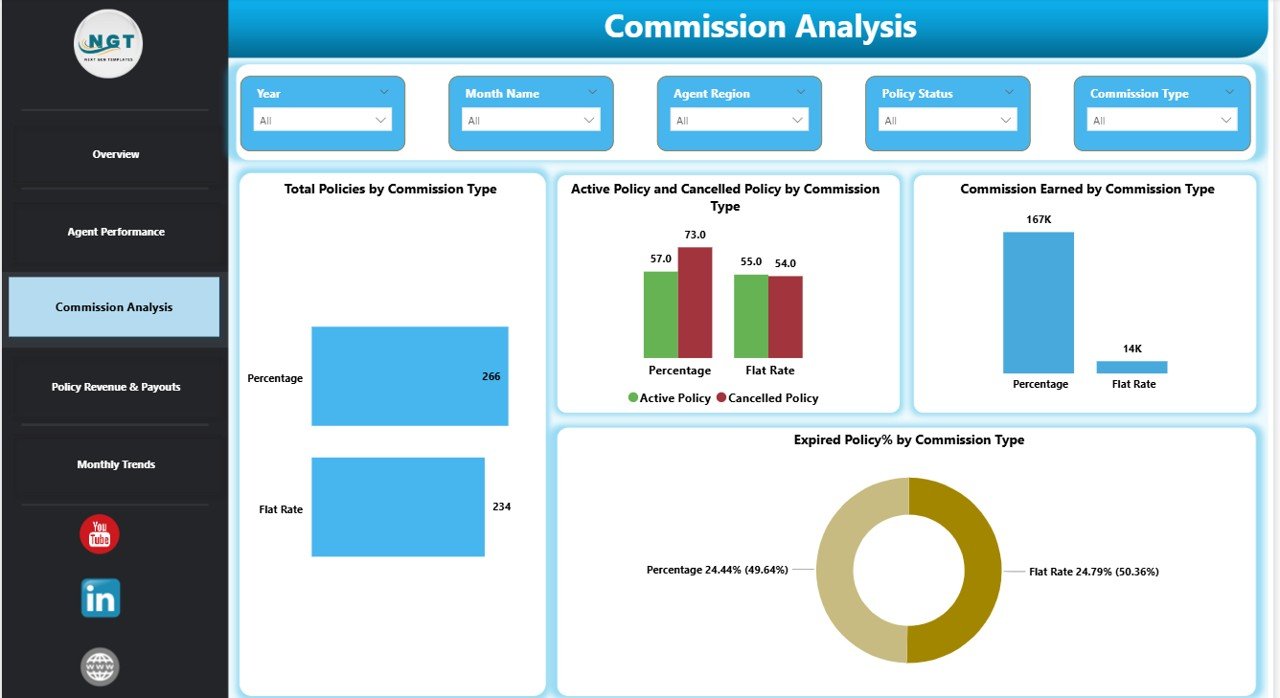
Commission Analysis – How Does Commission Structure Impact Revenue?
Commission types vary across policies. Therefore, this page analyzes commission performance.
Key Charts in Commission Analysis
- Total Policies by Commission Type
- Active and Cancelled Policies by Commission Type
- Commission Earned by Commission Type
- Expired Policy % by Commission Type
This analysis helps answer critical questions:
- Which commission type generates higher revenue?
- Does a specific commission type lead to more cancellations?
- Which structure produces stable earnings?
As a result, brokers can optimize commission planning.
Click to buy Insurance Brokers Dashboard in Power BI
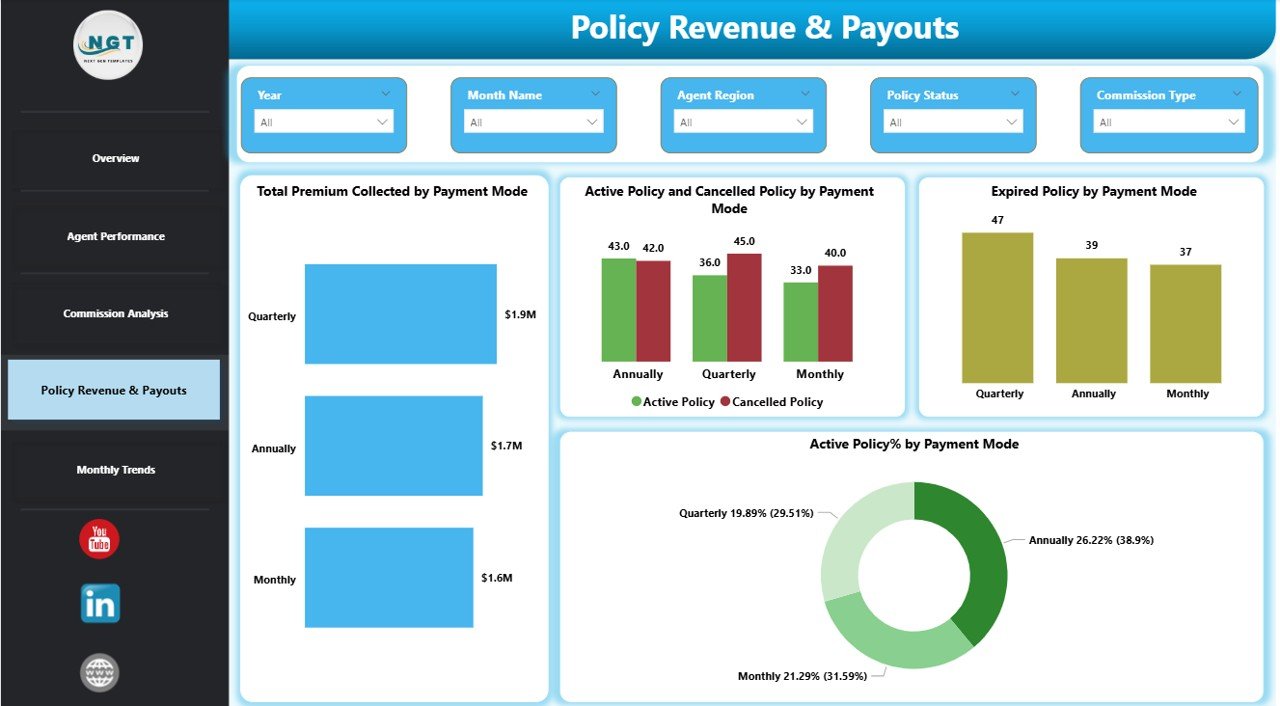
Policy Revenue & Payouts – Where Does the Money Come From?
Premium collection drives business growth. Therefore, this page focuses on payment behavior and policy revenue.
Key Charts in Policy Revenue & Payouts
- Total Premium Collected by Payment Mode
- Active and Cancelled Policies by Payment Mode
- Expired Policies by Payment Mode
- Active Policy % by Payment Mode
Payment modes may include:
- Monthly
- Quarterly
- Annual
- Online
- Bank Transfer
This page helps management understand:
- Which payment mode generates stable income
- Which payment method leads to higher cancellations
- How revenue spreads across payment channels
As a result, brokers improve cash flow planning.
Click to buy Insurance Brokers Dashboard in Power BI
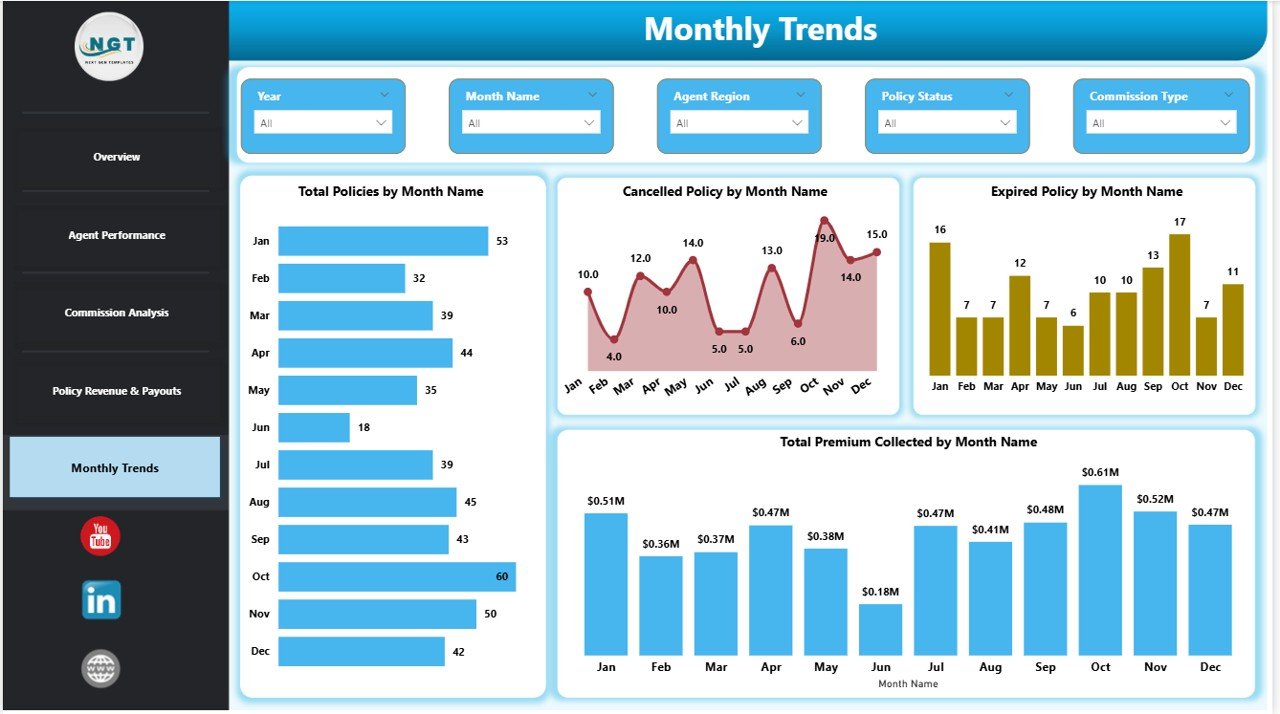
Monthly Trends – How Does Performance Change Over Time?
Trend analysis supports long-term planning.
Key Charts in Monthly Trends
- Total Policies by Month Name
- Cancelled Policies by Month Name
- Expired Policies by Month Name
- Total Premium by Month Name
This page helps answer:
- Which month generates the highest policies?
- Do cancellations spike during certain periods?
- How does premium fluctuate monthly?
Therefore, management can plan marketing campaigns and renewal drives effectively.
Click to buy Insurance Brokers Dashboard in Power BI
What Key KPIs Can You Track in This Dashboard?
This Insurance Brokers Dashboard tracks critical insurance metrics such as:
- Total Policies
- Active Policies
- Cancelled Policies
- Expired Policies
- Premium Collected
- Commission Earned
- Active Policy %
- Expired Policy %
- Agent Performance Metrics
- Commission Type Performance
Because these KPIs update automatically, managers always see accurate data.
Advantages of Insurance Brokers Dashboard in Power BI
Using this dashboard offers multiple benefits.
Real-Time Insights
You instantly track policies, revenue, and commissions.
Better Agent Monitoring
You identify top and low performers quickly.
Improved Commission Planning
You compare commission types and optimize payouts.
Reduced Manual Work
You eliminate spreadsheet dependency.
Faster Decision-Making
You analyze data within seconds using slicers.
Revenue Transparency
You clearly see premium sources and payment behavior.
Trend Visibility
You monitor monthly growth and risk patterns.
As a result, you improve operational efficiency.
Best Practices for the Insurance Brokers Dashboard
To get maximum value, follow these best practices.
Maintain Clean Data
Always update policy data accurately.
Define Clear Commission Rules
Ensure commission types remain consistent.
Use Standard Naming Conventions
Keep agent names and regions uniform.
Monitor Expired Policies
Track expiry rates to reduce policy loss.
Analyze Cancellation Reasons
Identify patterns and take corrective action.
Schedule Monthly Review Meetings
Discuss dashboard insights with the team.
Automate Data Refresh
Set automatic refresh to ensure real-time reporting.
When you follow these practices, you improve dashboard accuracy and impact.
How Does This Dashboard Improve Business Growth?
This dashboard directly impacts growth because:
- It reduces revenue leakage
- It increases agent accountability
- It improves renewal tracking
- It highlights risk trends
- It supports commission optimization
Therefore, brokers gain full control over operations.
Who Can Use This Insurance Brokers Dashboard?
This solution suits:
- Insurance Brokers
- Agency Managers
- Commission Analysts
- Financial Controllers
- Insurance Sales Teams
- Business Owners
Moreover, small and large firms can use it easily.
How to Implement the Insurance Brokers Dashboard in Power BI?
Follow these simple steps:
- Prepare structured insurance data in Excel.
- Import data into Power BI.
- Create relationships between tables.
- Build calculated measures for KPIs.
- Design interactive visuals.
- Add slicers for filtering.
- Publish dashboard to Power BI Service.
Conclusion
The insurance industry demands clarity, speed, and control. However, manual reports slow down decision-making.
The Insurance Brokers Dashboard in Power BI solves this problem effectively. It centralizes policies, premiums, commissions, agent performance, and monthly trends into one powerful system.
Moreover, it provides real-time insights. Therefore, brokerage firms can improve revenue, reduce cancellations, and optimize commissions confidently.
If you want smarter decisions and better growth, this dashboard becomes your ultimate control panel.
Frequently Asked Questions with Answers
What data do I need to create this dashboard?
You need structured policy data including:
- Policy ID
- Agent Name
- Region
- Commission Type
- Premium Amount
- Policy Status
- Payment Mode
- Policy Dates
Can small brokerage firms use this dashboard?
Yes. Small firms benefit greatly because the dashboard simplifies monitoring and reporting.
How often should I update the dashboard?
You should update it daily or weekly depending on transaction volume.
Can I customize the dashboard?
Yes. You can add additional KPIs, filters, or charts based on your business needs.
Does Power BI support automatic refresh?
Yes. You can schedule automatic refresh when you publish the report to Power BI Service.
How does this dashboard reduce cancellations?
It highlights cancellation patterns by agent, commission type, and payment mode. Therefore, management can take preventive action.
Can I track commission performance monthly?
Yes. The Monthly Trends page allows commission and premium tracking over time.
Visit our YouTube channel to learn step-by-step video tutorials
Watch the step-by-step video tutorial:
Click to buy Insurance Brokers Dashboard in Power BI