In today’s fast-moving logistics environment, postal organizations must track performance daily. Customers expect fast delivery. Managers demand accuracy. Regulators require compliance. Therefore, postal departments need clear visibility into their KPIs.
However, many postal offices still depend on scattered Excel sheets. As a result, leaders struggle to track monthly targets, compare year-over-year growth, and identify underperforming KPIs.
So, how can postal services monitor operational performance in one centralized system?
The answer is simple.
Click to Purchases Postal Services KPI Dashboard in Power BI
You need a Postal Services KPI Dashboard in Power BI.
This ready-to-use Power BI dashboard connects structured Excel data with interactive visuals. Moreover, it allows postal managers to track MTD and YTD performance, compare targets vs actuals, and analyze previous year comparisons instantly.
Let us explore everything step by step.
What Is a Postal Services KPI Dashboard in Power BI?
A Postal Services KPI Dashboard in Power BI is a structured performance tracking solution designed specifically for postal operations.
It helps organizations:
Track delivery performance
Monitor cost efficiency
Evaluate operational KPIs
Compare actual vs target results
Analyze month-to-date (MTD) and year-to-date (YTD) performance
Instead of manually calculating numbers, managers can use slicers and filters. Consequently, they can analyze insights in seconds.
Why Do Postal Services Need a KPI Dashboard?
Postal operations involve multiple branches, thousands of parcels, and strict timelines. Therefore, performance tracking becomes critical.
Without a centralized dashboard:
Teams miss targets.
Managers fail to identify delays.
Costs increase.
Customer satisfaction drops.
On the other hand, when you use a Power BI dashboard:
You see KPI status instantly.
You compare MTD and YTD performance.
You track target achievement clearly.
You make faster decisions.
Therefore, a Postal Services KPI Dashboard becomes essential.
Key Features of Postal Services KPI Dashboard in Power BI
This ready-to-use dashboard includes 3 powerful pages inside the Power BI desktop file.
Let us understand each page in detail.
1️⃣ Summary Page – The Command Center
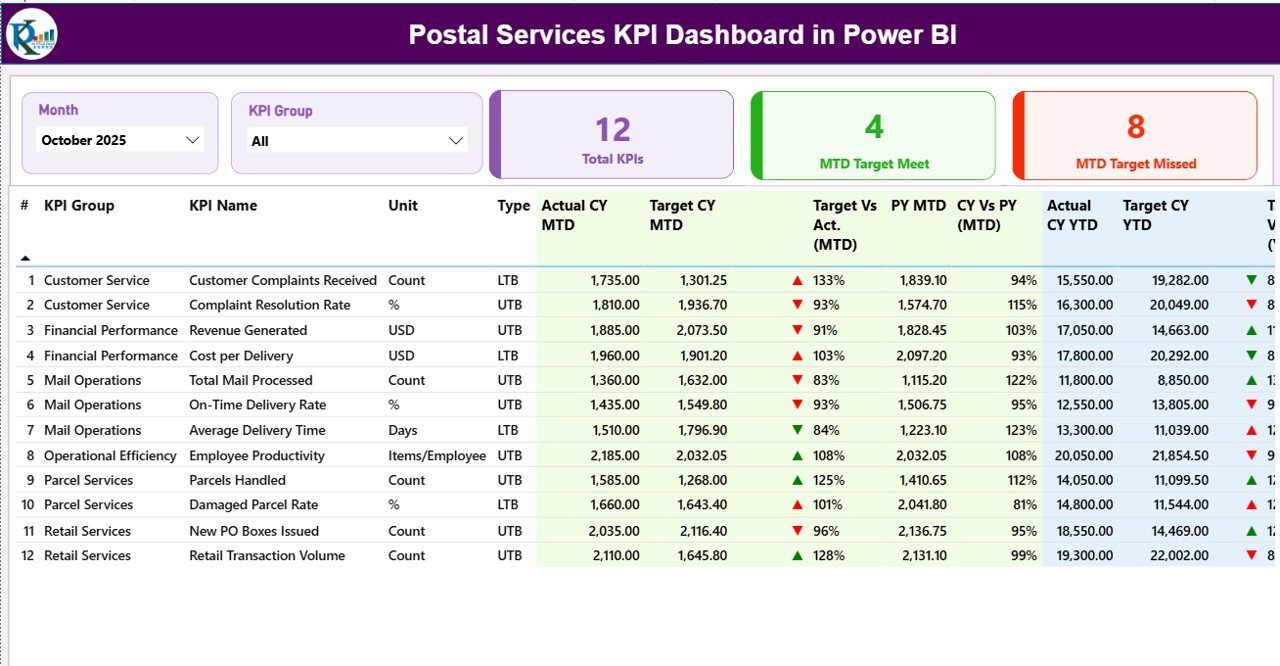
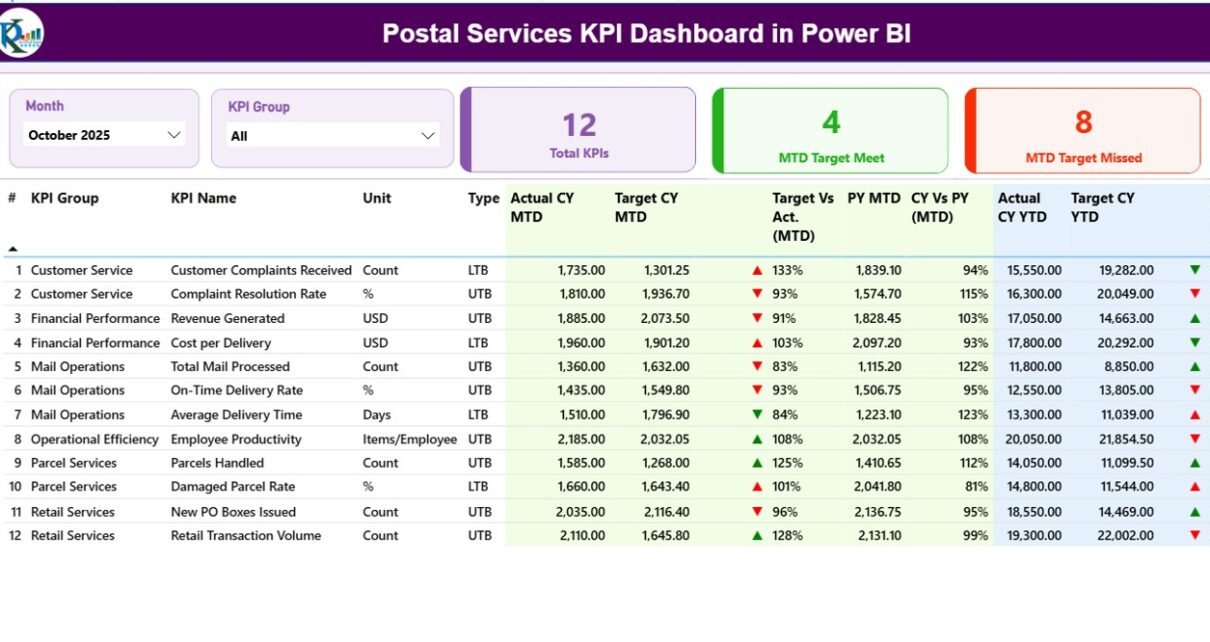
The Summary Page acts as the main control panel of the dashboard.
What Does the Top Section Show?
At the top, you see:
Month Slicer
KPI Group Slicer
These slicers allow you to filter data instantly. Therefore, you can analyze specific months or KPI categories easily.
KPI Cards on Summary Page
You see three powerful KPI cards:
Total KPIs Count
MTD Target Meet Count
MTD Target Missed Count
These cards provide a quick performance overview. As a result, leadership can identify performance gaps immediately.
Detailed KPI Performance Table
Below the cards, you find a structured KPI table with the following columns:
KPI Number
KPI Group
KPI Name
Unit
Type (LTB or UTB)
Actual CY MTD
Target CY MTD
MTD Icon (▲ or ▼ with color)
Target vs Actual (MTD %)
PY MTD
CY vs PY (MTD %)
Actual CY YTD
Target CY YTD
YTD Icon
Target vs Actual (YTD %)
PY YTD
CY vs PY (YTD %)
How Does the Dashboard Calculate MTD & YTD?
The dashboard uses simple formulas:
Target vs Actual (MTD) = Actual MTD ÷ Target MTD
CY vs PY (MTD) = Current Year MTD ÷ Previous Year MTD
Target vs Actual (YTD) = Actual YTD ÷ Target YTD
CY vs PY (YTD) = Current Year YTD ÷ Previous Year YTD
Therefore, managers can measure both performance achievement and growth trends.
What Do LTB and UTB Mean?
LTB (Lower the Better) – Example: Delivery Delay Rate
UTB (Upper the Better) – Example: On-Time Delivery Rate
The dashboard automatically shows:
🔺 Green ▲ when performance improves
🔻 Red ▼ when performance declines
As a result, users can interpret performance without complex analysis.
Click to Purchases Postal Services KPI Dashboard in Power BI
2️⃣ KPI Trend Page – Visual Performance Analysis
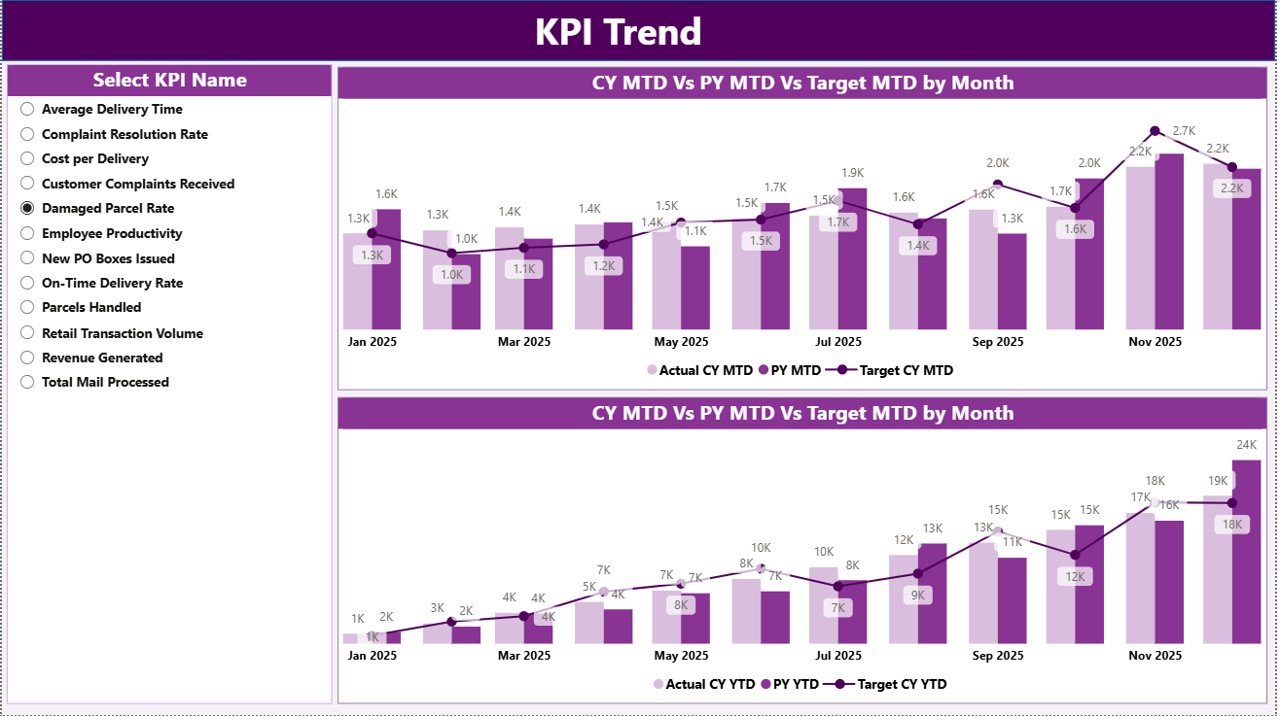
The KPI Trend page provides deeper insight into trends.
What Does This Page Include?
2 Combo Charts:
MTD Comparison (Actual vs Target vs Previous Year)
YTD Comparison (Actual vs Target vs Previous Year)
KPI Name Slicer on the left side
Why Is This Page Important?
Instead of reviewing numbers in a table, managers can:
Analyze trends visually
Identify seasonal patterns
Track monthly fluctuations
Compare performance growth
For example:
If parcel delivery time increases in festive months, managers can plan additional resources.
Therefore, the KPI Trend page improves decision-making.
3️⃣ KPI Definition Page – Drill-Through Insights
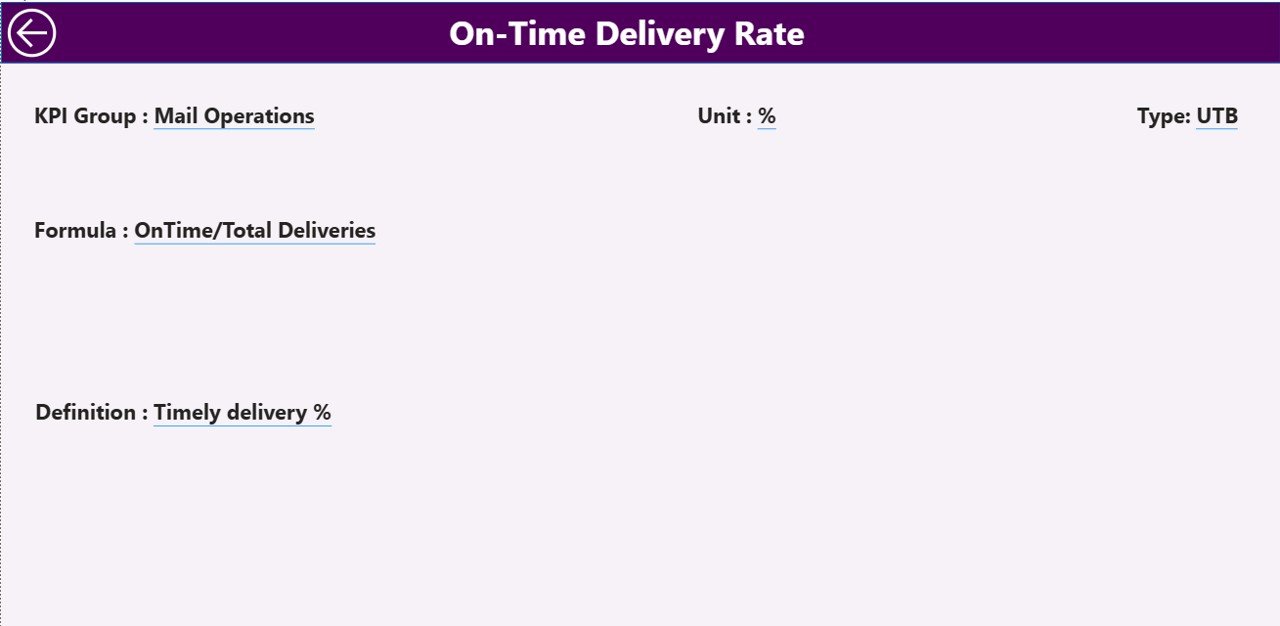
This page remains hidden. However, users can drill through from the Summary page.
What Information Does It Show?
KPI Number
KPI Group
KPI Name
Unit
Formula
Definition
Type (LTB or UTB)
This feature ensures transparency. Moreover, it helps teams understand KPI calculations clearly.
To return to the main page, users simply click the back button.
How Does the Excel Data Source Work?
The dashboard connects to an Excel file. Therefore, users can manage data easily.
The Excel file contains 3 worksheets:
1️⃣ Input_Actual Sheet
In this sheet, users fill:
KPI Name
Month (First date of month)
MTD Number
YTD Number
As soon as users update this sheet, the dashboard refreshes automatically.
2️⃣ Input_Target Sheet
Click to Purchases Postal Services KPI Dashboard in Power BI
Here users enter:
KPI Name
Month
Target MTD
Target YTD
Therefore, the system compares performance instantly.
3️⃣ KPI Definition Sheet
In this sheet, users define:
KPI Number
KPI Group
KPI Name
Unit
Formula
Definition
Type (LTB or UTB)
This sheet acts as the foundation of the dashboard.
What KPIs Can Postal Services Track?
Postal departments can monitor:
On-Time Delivery Rate
Parcel Damage Rate
Customer Complaint Ratio
Delivery Cost per Parcel
Revenue per Route
Fuel Efficiency
Employee Productivity
Sorting Accuracy Rate
Undelivered Mail Percentage
Branch Performance Index
Therefore, this dashboard supports both operational and financial KPIs.
Advantages of Postal Services KPI Dashboard in Power BI
This dashboard provides multiple benefits.
✅ Centralized Performance Monitoring
You view all KPIs in one place.
✅ Faster Decision-Making
You analyze trends instantly using slicers.
✅ Clear Target Tracking
You compare actual vs target without manual calculations.
✅ Year-over-Year Comparison
You evaluate growth using CY vs PY metrics.
✅ Improved Accountability
You identify underperforming KPIs quickly.
✅ Easy Excel Integration
You update data without technical expertise.
✅ Interactive Reporting
You drill through to detailed KPI definitions.
Therefore, postal leadership gains better control over operations.
Best Practices for the Postal Services KPI Dashboard in Power BI
To maximize dashboard value, follow these best practices:
🔹 Define Clear KPI Objectives
Align KPIs with postal operational goals.
🔹 Update Excel Data Regularly
Ensure accurate MTD and YTD tracking.
🔹 Use First Date of Month Format
Maintain consistent data structure.
🔹 Categorize KPIs Properly
Group KPIs under Delivery, Financial, Customer, and Operational.
🔹 Train Team Members
Ensure users understand LTB and UTB logic.
🔹 Review Trends Monthly
Do not rely only on summary numbers.
🔹 Monitor Missed Targets
Focus on KPIs with red indicators first.
🔹 Maintain Historical Data
Track at least 2–3 years for accurate trend analysis.
By following these practices, organizations can improve efficiency significantly.
How Does This Dashboard Improve Postal Efficiency?
Click to Purchases Postal Services KPI Dashboard in Power BI
This dashboard:
Reduces manual reporting time
Eliminates calculation errors
Improves data transparency
Enhances accountability
Supports strategic planning
Therefore, teams focus on performance improvement rather than spreadsheet maintenance.
Conclusion
Postal services operate in a performance-driven environment. Therefore, leaders must track KPIs accurately.
The Postal Services KPI Dashboard in Power BI provides:
Real-time performance visibility
MTD and YTD tracking
Target vs Actual comparison
Previous Year analysis
Interactive drill-through reporting
Instead of relying on manual Excel summaries, postal managers can use this structured Power BI solution.
As a result, they improve delivery performance, reduce costs, and enhance customer satisfaction.
If you want complete control over your postal KPIs, this dashboard provides the perfect solution.
Frequently Asked Questions (FAQs)
1. What data source does this dashboard use?
The dashboard uses an Excel file with three sheets: Input_Actual, Input_Target, and KPI Definition.
2. Can I add more KPIs?
Yes. You can add new KPIs in the KPI Definition sheet and update actual and target data accordingly.
3. What does LTB and UTB mean?
LTB means Lower the Better. UTB means Upper the Better. The dashboard adjusts indicators accordingly.
4. Can I track multiple years?
Yes. You can add historical data in Excel and compare CY vs PY easily.
5. Does this dashboard require advanced Power BI skills?
No. You only need basic Excel data entry knowledge. The dashboard works automatically after refresh.
6. Can postal branches use this dashboard separately?
Yes. You can filter by KPI group or create additional branch-level KPIs.
7. How often should I update the data?
You should update data monthly for accurate MTD and YTD tracking.
Visit our YouTube channel to learn step-by-step video tutorials