The printing and publishing industry moves fast. Clients expect quick turnaround. Costs fluctuate. Moreover, competition grows every year. Therefore, printing businesses must track performance carefully.
However, many printing companies still depend on scattered Excel sheets. As a result, managers waste hours consolidating reports. Meanwhile, decision-makers struggle to understand profit trends. Consequently, growth slows down.
So, how can printing and publishing businesses track profit, cost, revenue, and delivery performance in one powerful system?
The answer is clear.
You need a Printing and Publishing Dashboard in Power BI.
Click to Purchases Printing and Publishing Dashboard in Power BI
This ready-to-use dashboard transforms raw printing data into interactive visuals. Furthermore, it helps you monitor profit margin %, analyze client performance, evaluate product types, track printing technology efficiency, and review monthly trends — all in one place.
Let us explore everything step by step.
What Is a Printing and Publishing Dashboard in Power BI?
A Printing and Publishing Dashboard in Power BI is an interactive reporting solution designed specifically for printing houses, publishers, and commercial printing businesses.
It helps organizations:
-
Track on-time delivery performance
-
Monitor printing costs
-
Analyze revenue by region
-
Evaluate client profitability
-
Compare product type performance
-
Measure print technology efficiency
-
Review monthly profit trends
Instead of manually creating reports every month, you can use slicers and dynamic visuals. As a result, you save time. Moreover, you gain clarity.
Why Does the Printing Industry Need a Power BI Dashboard?
The printing industry operates on tight margins. Therefore, even a small cost increase can reduce profits. Additionally, clients demand faster delivery. At the same time, raw material prices change frequently.
Without structured reporting:
-
Managers cannot identify low-margin products.
-
Sales teams cannot track profitable client types.
-
Production teams cannot measure technology performance.
-
Owners cannot see regional revenue contribution.
However, with a Printing and Publishing Dashboard in Power BI, you can:
-
Detect profit gaps instantly
-
Compare cost vs revenue easily
-
Improve decision-making speed
-
Increase overall profitability
What Are the 5 Pages in the Printing and Publishing Dashboard in Power BI?
This dashboard contains 5 powerful pages. Each page focuses on a different business angle. Therefore, you get a complete 360-degree performance view.
Let us break them down.
Click to Purchases Printing and Publishing Dashboard in Power BI
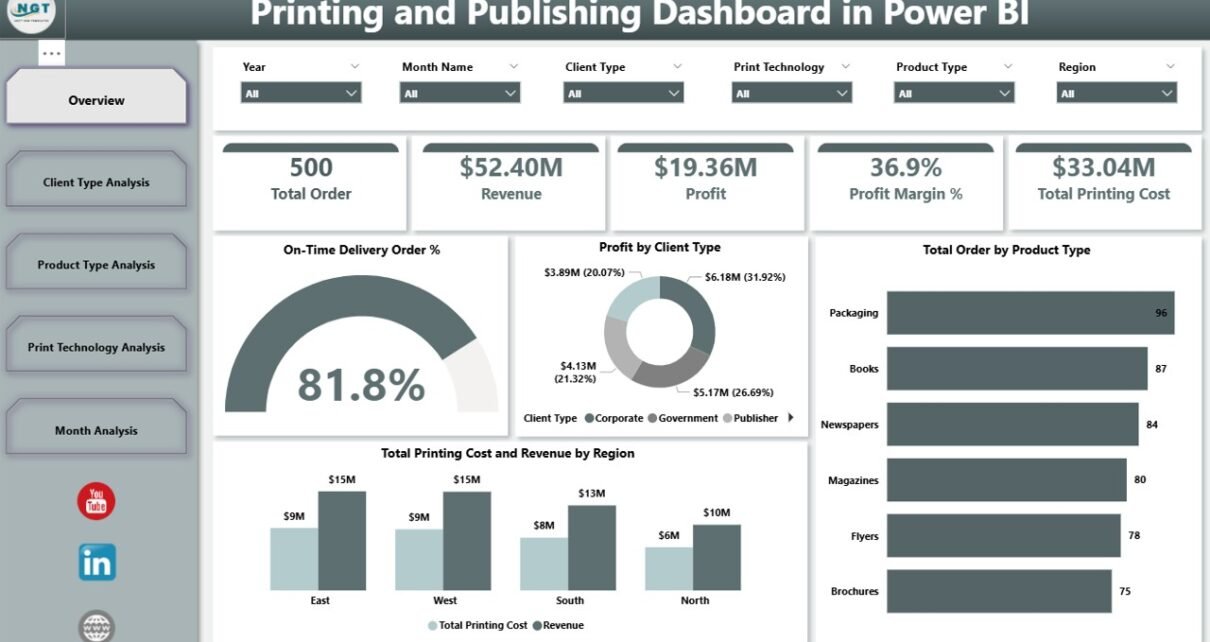
1️⃣ Overview Page – How Does It Give You Complete Business Visibility?
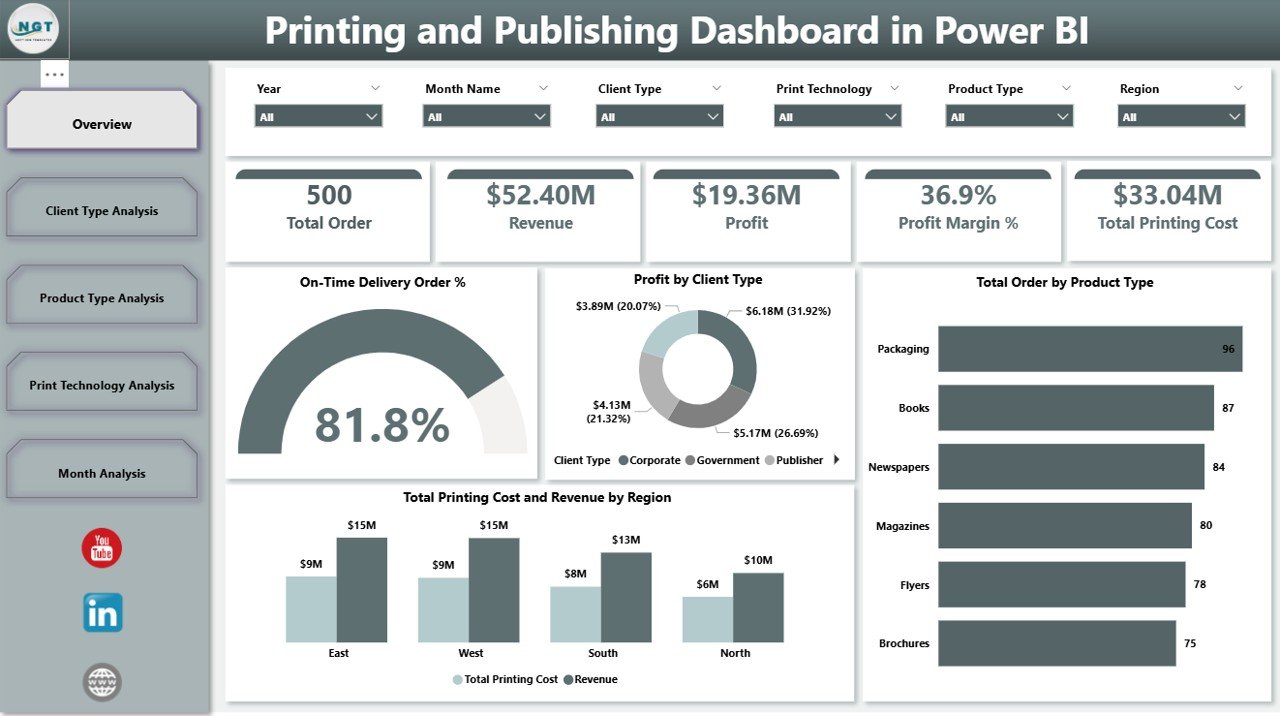
The Overview Page acts as the control center of the dashboard.
Key Elements on the Overview Page
-
Slicers (Filters)
You can filter data by:-
Region
-
Client Type
-
Product Type
-
Print Technology
-
Month
As soon as you change a slicer, all visuals update instantly. Therefore, analysis becomes effortless.
-
5 Key KPI Cards
-
On-Time Delivery Order %
-
Profit by Client Type
-
Total Order by Product Type
-
Total Printing Cost
-
Revenue by Region
Because of these KPI cards, you can see performance at a glance. Moreover, you can quickly identify red flags.
2️⃣ Client Type Analysis – Which Clients Generate the Highest Profit?
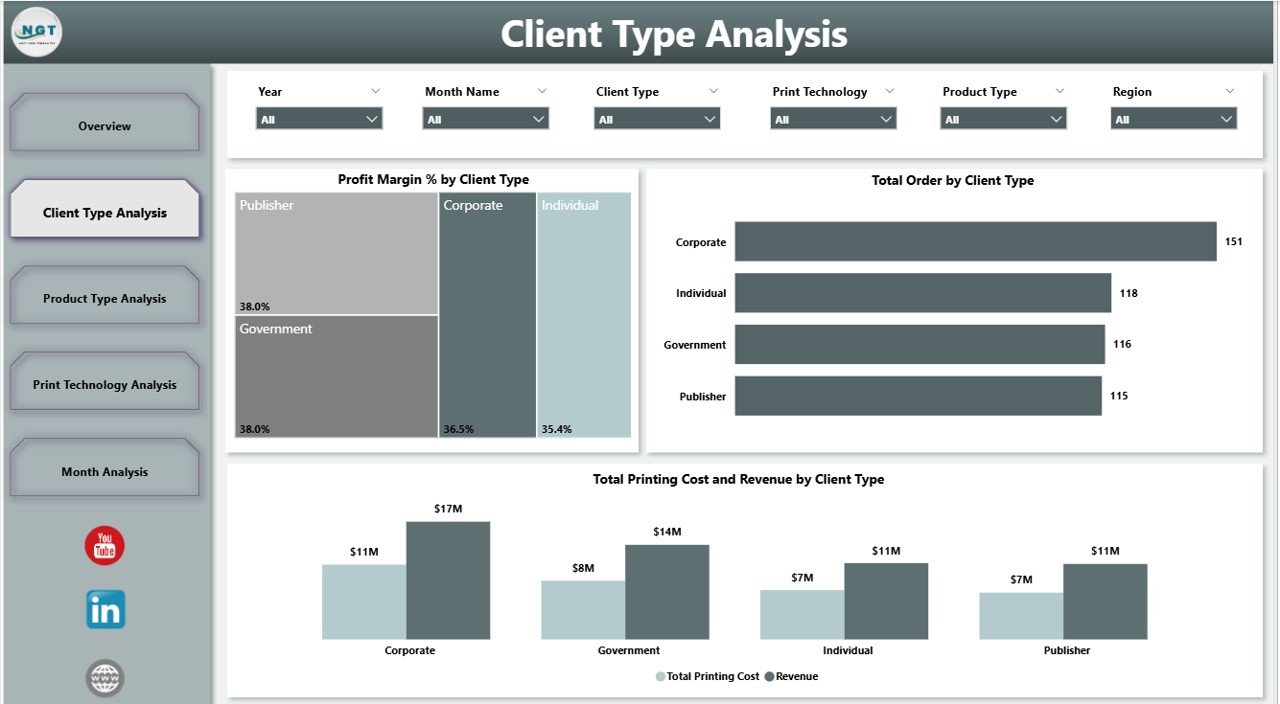
The second page focuses entirely on client segmentation.
Why Client Type Analysis Matters
Different clients behave differently. For example:
-
Corporate clients place bulk orders.
-
Retail clients order smaller quantities.
-
Government contracts offer stability.
-
Educational institutions provide recurring revenue.
Therefore, you must analyze profit by client type.
Charts on Client Type Analysis Page
-
Profit Margin % by Client Type
-
Total Orders by Client Type
-
Total Printing Cost and Revenue by Client Type
With this page, you can:
-
Identify high-margin client segments
-
Improve pricing strategy
-
Focus on profitable customer groups
3️⃣ Product Type Analysis – Which Printing Products Perform Best?
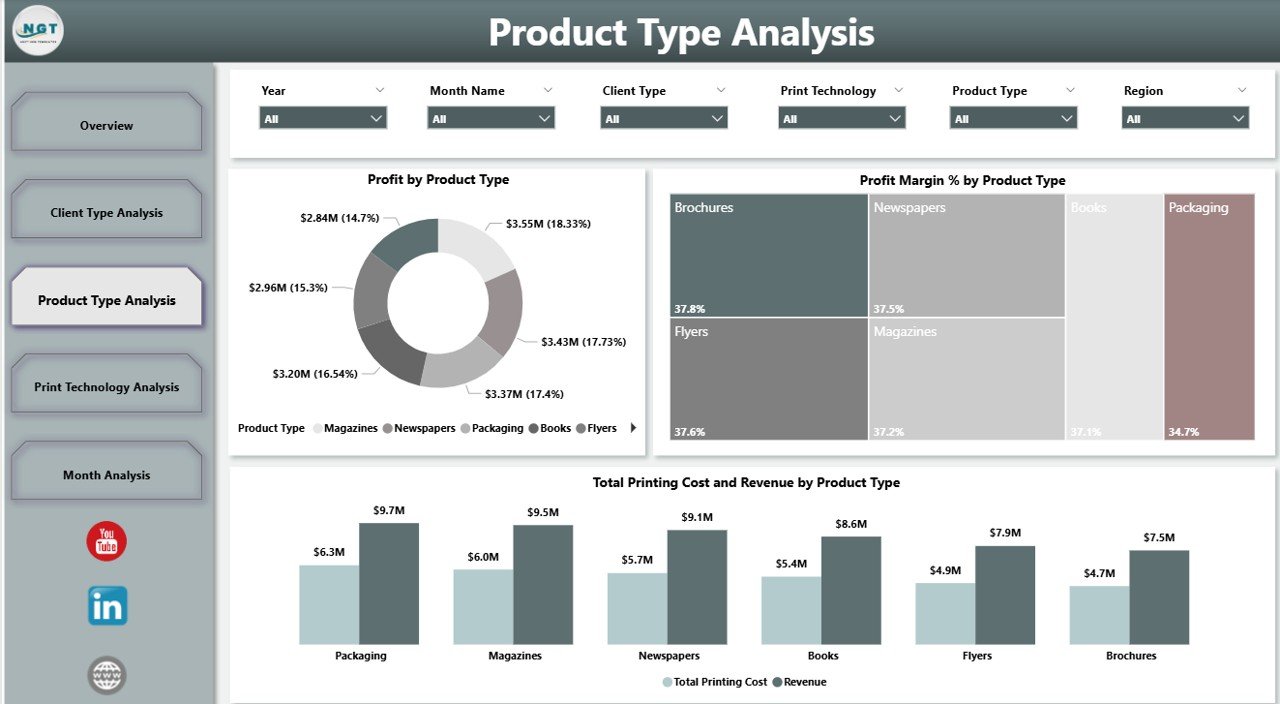
Printing businesses offer multiple products, such as:
-
Books
-
Magazines
-
Flyers
-
Packaging
-
Brochures
-
Business Cards
However, not all products generate equal profit.
Charts Included on Product Type Analysis Page
-
Profit Margin % by Product Type
-
Profit by Product Type
-
Total Printing Cost and Revenue by Product Type
Because of this page, you can:
-
Identify low-margin products
-
Adjust pricing
-
Focus on profitable product lines
-
Optimize production planning
-
Click to Purchases Printing and Publishing Dashboard in Power BI
4️⃣ Print Technology Analysis – Which Technology Delivers Maximum Profit?
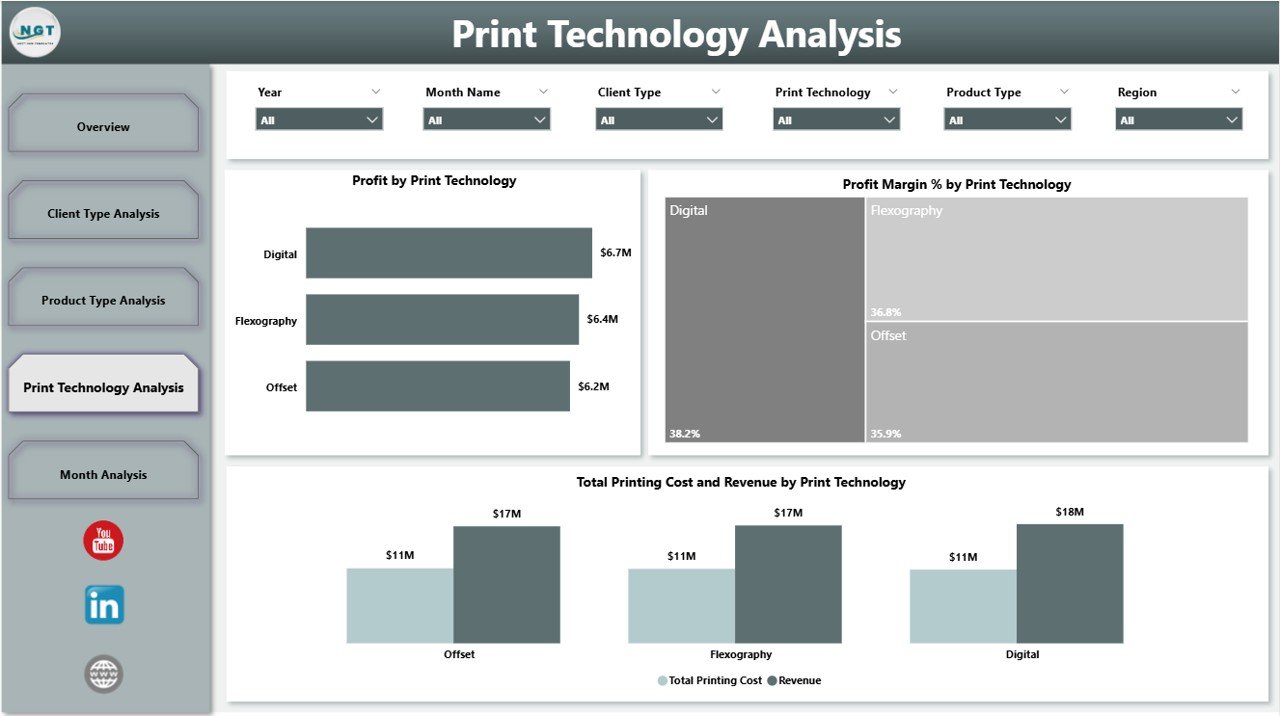
Printing companies use different technologies, such as:
-
Offset Printing
-
Digital Printing
-
Flexographic Printing
-
Screen Printing
-
Gravure Printing
Each technology involves different cost structures. Therefore, you must measure performance carefully.
Charts on Print Technology Analysis Page
-
Profit Margin % by Print Technology
-
Profit by Print Technology
-
Total Printing Cost and Revenue by Technology
With this analysis, you can:
-
Decide which technology needs investment
-
Reduce operational inefficiencies
-
Control machine-related costs
-
Improve production scheduling
5️⃣ Month Analysis – How Does Your Business Perform Over Time?
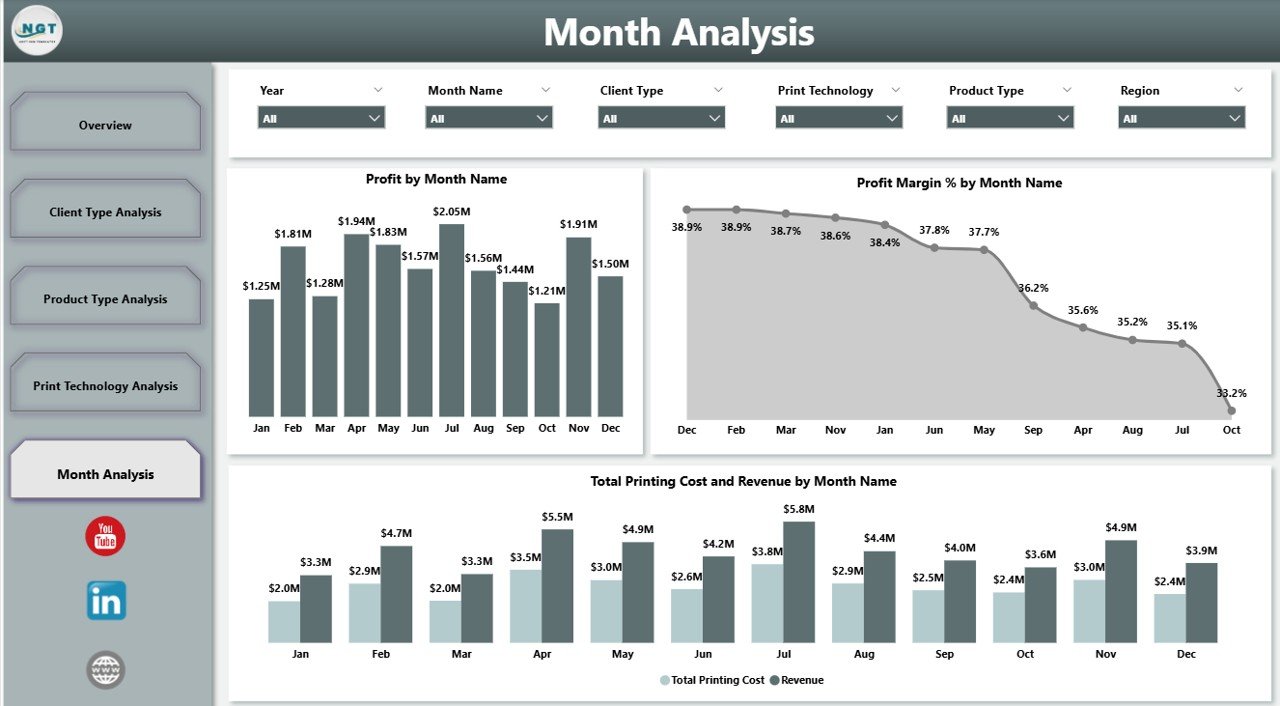
The Month Analysis page tracks performance trends.
Charts Included
-
Profit Margin % by Month
-
Profit by Month
-
Total Printing Cost and Revenue by Month
This page helps you:
-
Detect seasonal patterns
-
Compare monthly growth
-
Identify slow months
-
Improve forecasting
Because of monthly tracking, you can prepare better budgets. Furthermore, you can control costs proactively.
What KPIs Should You Track in a Printing and Publishing Dashboard?
A strong dashboard must include relevant KPIs.
Here are some essential KPIs:
-
On-Time Delivery %
-
Revenue
-
Printing Cost
-
Gross Profit
-
Profit Margin %
-
Total Orders
-
Revenue by Region
-
Cost per Order
-
Average Order Value
-
Client Retention Rate
Each KPI provides actionable insight. Therefore, you should define them clearly.
Advantages of Printing and Publishing Dashboard in Power BI
A Printing and Publishing Dashboard in Power BI offers several benefits.
1. Real-Time Business Visibility
You can see updated performance instantly. Therefore, you avoid reporting delays.
2. Better Profit Tracking
You can compare cost and revenue quickly. As a result, you control margins better.
3. Improved Client Segmentation
You can identify profitable client groups. Consequently, you increase revenue strategically.
4. Smarter Product Decisions
You can focus on high-margin products. Moreover, you can discontinue low-profit items.
5. Faster Decision-Making
Because visuals simplify data, managers make decisions quickly.
6. Regional Performance Analysis
You can analyze revenue by region. Therefore, you identify strong markets.
How Does This Dashboard Improve Business Growth?
This dashboard improves growth in several ways:
-
It highlights profit leaks.
-
It supports data-driven pricing.
-
It improves operational efficiency.
-
It enhances strategic planning.
-
It boosts accountability.
Because leaders rely on data instead of assumptions, growth becomes predictable.
Click to Purchases Printing and Publishing Dashboard in Power BI
Best Practices for the Printing and Publishing Dashboard in Power BI
To maximize value, follow these best practices.
1. Maintain Clean Data
Always structure your Excel source file properly. Therefore, Power BI calculations remain accurate.
2. Use Consistent KPI Definitions
Define profit, cost, and revenue clearly. Moreover, avoid changing formulas frequently.
3. Update Data Regularly
Refresh your data monthly or weekly. Consequently, decisions remain timely.
4. Monitor Slicers Carefully
Use slicers wisely to avoid misinterpretation. Always check filters before presenting reports.
5. Train Your Team
Ensure managers understand KPI meanings. As a result, they use the dashboard effectively.
6. Focus on Actionable Insights
Do not overload visuals. Instead, highlight decision-driving metrics.
How Can You Implement This Dashboard Successfully?
You can implement it in simple steps:
-
Collect structured printing data.
-
Import data into Power BI.
-
Build relationships between tables.
-
Create measures for Profit Margin %.
-
Design interactive visuals.
-
Add slicers for filtering.
-
Publish and share with management.
Because Power BI offers user-friendly tools, implementation remains smooth.
How Does This Dashboard Help in Cost Control?
Cost control matters in printing.
This dashboard helps by:
-
Comparing cost vs revenue instantly
-
Showing high-cost technologies
-
Highlighting low-margin products
-
Detecting inefficient client contracts
Therefore, you can reduce unnecessary expenses.
How Does It Support Strategic Planning?
This dashboard supports strategy by:
-
Revealing profitable segments
-
Identifying growth regions
-
Highlighting seasonal trends
-
Measuring delivery efficiency
As a result, leaders plan investments wisely.
Conclusion
The printing and publishing industry demands clarity, speed, and accuracy. However, manual reporting slows growth. Moreover, scattered spreadsheets create confusion.
Therefore, businesses must adopt structured analytics.
A Printing and Publishing Dashboard in Power BI offers complete performance visibility. It tracks profit margin %, cost, revenue, delivery performance, product analysis, technology efficiency, and monthly trends — all in one powerful system.
Because of its interactive design, managers gain instant insights. Furthermore, decision-making becomes faster and smarter.
If you want to improve profitability, control costs, and drive sustainable growth, this dashboard provides the perfect solution.
Frequently Asked Questions (FAQs)
1. What data do I need to create a Printing and Publishing Dashboard in Power BI?
You need structured data including orders, cost, revenue, client type, product type, print technology, region, and delivery status.
2. How often should I update the dashboard?
You should update it monthly. However, you can refresh weekly for better tracking.
3. Can small printing businesses use this dashboard?
Yes. Small and medium printing companies benefit greatly because the dashboard simplifies reporting.
4. Does Power BI require advanced technical skills?
No. Power BI offers user-friendly features. Moreover, basic knowledge helps you manage reports easily.
5. How does Profit Margin % get calculated?
You can calculate Profit Margin % using:
(Revenue – Printing Cost) / Revenue × 100
6. Can I customize the dashboard?
Yes. You can add new KPIs, charts, or filters based on business needs.
7. Why should I use slicers in Power BI?
Slicers help you filter data quickly. Therefore, you analyze specific segments instantly.
Visit our YouTube channel to learn step-by-step video tutorials