Cloud hosting services operate in a fast-moving and highly competitive environment. Companies expect 99.9% uptime. Customers demand instant performance. Moreover, security threats continue to grow every year. Therefore, cloud service providers must track performance carefully and consistently.
However, many cloud hosting companies still depend on scattered Excel sheets and manual reports. As a result, managers spend hours compiling data instead of improving service quality. Furthermore, leadership teams often struggle to see real-time performance trends.
So, how can cloud hosting companies monitor uptime, cost efficiency, security, and customer satisfaction in one structured system?
The answer is simple.
You need a Cloud Hosting Services KPI Dashboard in Excel.
This ready-to-use Excel dashboard transforms raw operational data into clear visuals and actionable insights. In addition, it helps operations managers, IT heads, and finance teams track MTD and YTD performance in one centralized place.
In this detailed guide, you will learn:
-
What a Cloud Hosting Services KPI Dashboard in Excel is
-
Why cloud service providers need it
-
Complete explanation of all 7 worksheets
-
Key cloud hosting KPIs you should track
-
Advantages of Cloud Hosting Services KPI Dashboard in Excel
-
Best Practices for the Cloud Hosting Services KPI Dashboard
-
Frequently Asked Questions with Answers
Let’s explore everything step by step.
Click to Purchases Cloud Hosting Services KPI Dashboard in Excel
What Is a Cloud Hosting Services KPI Dashboard in Excel?
A Cloud Hosting Services KPI Dashboard in Excel is a structured performance tracking template designed specifically for cloud service providers.
Instead of using disconnected files, you can:
-
Track MTD (Month-To-Date) performance
-
Monitor YTD (Year-To-Date) progress
-
Compare Actual vs Target
-
Analyze Previous Year comparisons
-
Monitor service reliability and financial health
Moreover, Excel provides flexibility and customization. Therefore, companies of all sizes can implement this dashboard without investing in expensive BI tools.
Why Do Cloud Hosting Companies Need a KPI Dashboard?
Cloud hosting businesses manage complex operations. Therefore, they must measure performance consistently.
Here’s why this dashboard becomes essential:
1️⃣ It Improves Service Reliability
You can track uptime, downtime, and server response time easily.
2️⃣ It Controls Costs
You monitor infrastructure costs, bandwidth expenses, and operational efficiency.
3️⃣ It Enhances Customer Experience
You track ticket resolution time and SLA compliance rates.
4️⃣ It Supports Growth Strategy
You analyze customer acquisition, churn rate, and revenue growth.
5️⃣ It Enables Data-Driven Decisions
Instead of relying on assumptions, you use measurable KPIs.
As a result, leadership teams gain clarity and confidence.
Click to Purchases Cloud Hosting Services KPI Dashboard in Excel
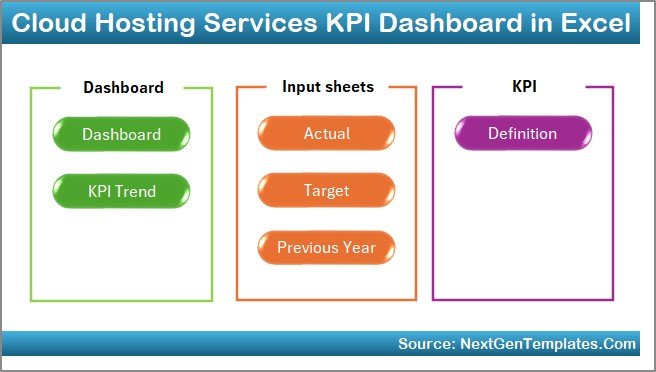
What Are the Worksheets Inside the Cloud Hosting Services KPI Dashboard in Excel?
This dashboard includes 7 structured worksheets:
-
Home Sheet
-
Dashboard Sheet
-
KPI Trend Sheet
-
Actual Numbers Input Sheet
-
Target Sheet
-
Previous Year Number Sheet
-
KPI Definition Sheet
Now let us understand each sheet in detail.
1️⃣ What Is the Home Sheet?
The Home Sheet works as an index page.
Key Features:
-
6 navigation buttons
-
Quick access to all sheets
-
Clean layout
Therefore, users can move across worksheets instantly without scrolling through tabs.
Click to Purchases Cloud Hosting Services KPI Dashboard in Excel
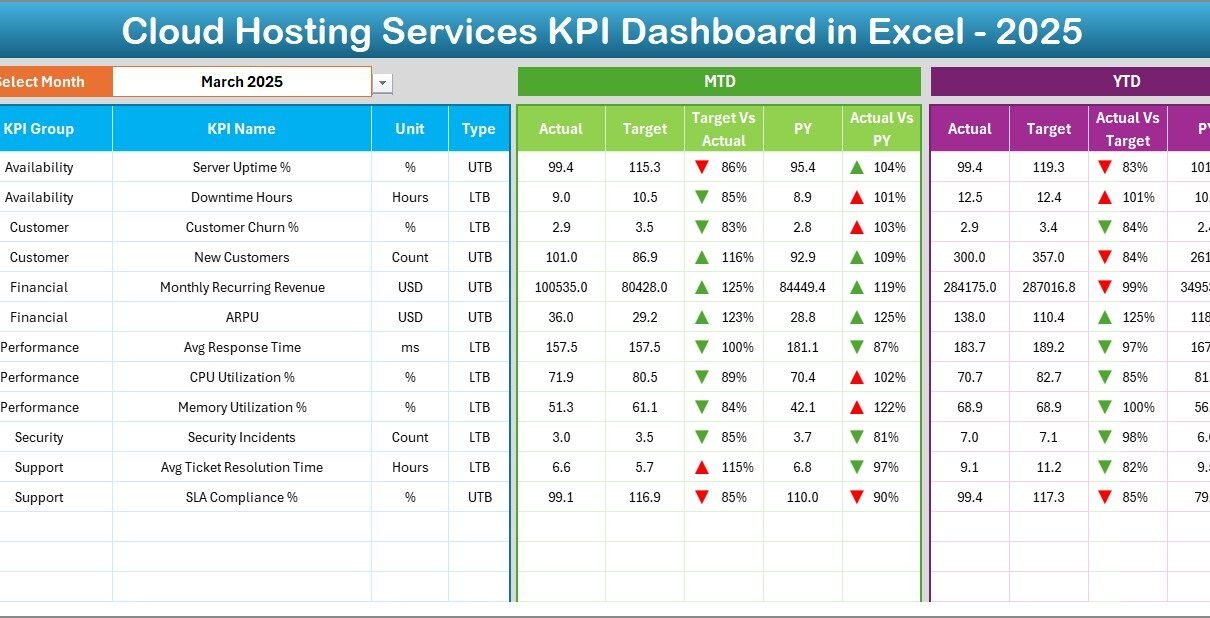
2️⃣ What Is the Dashboard Sheet?
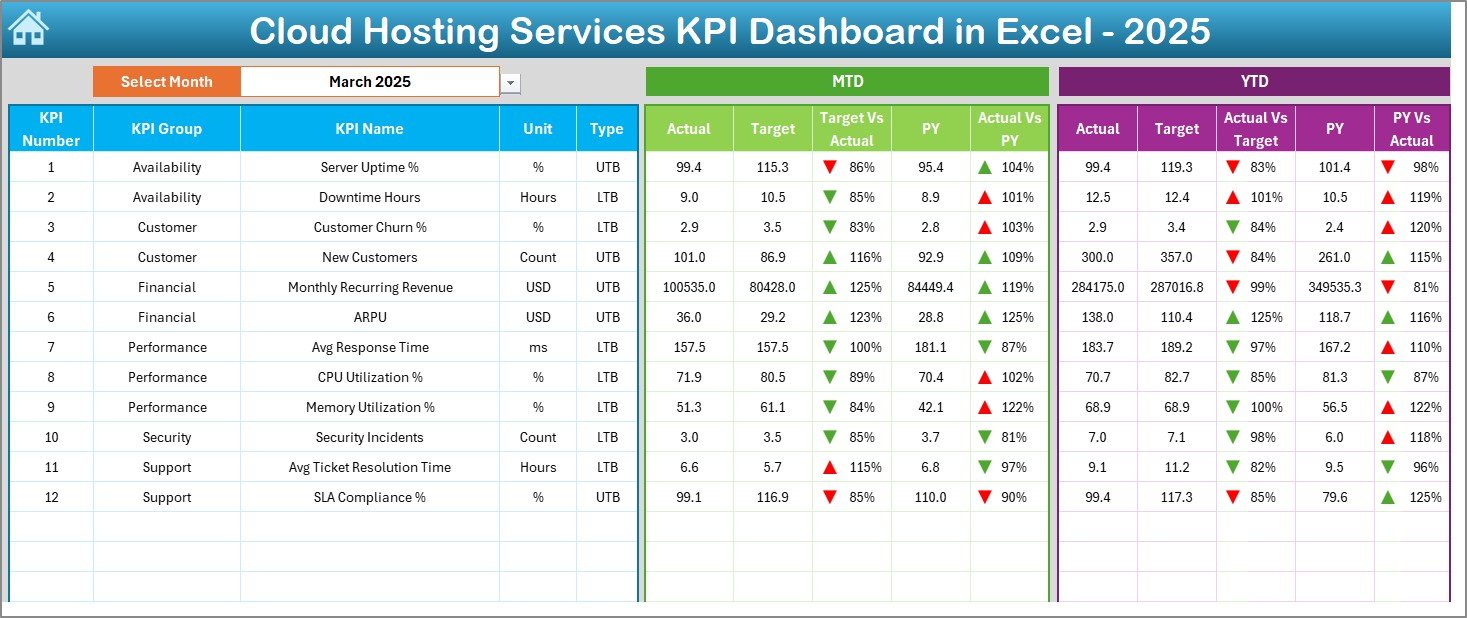
The Dashboard Sheet serves as the main analysis page.
On cell D3, you select the month from a dropdown menu. Immediately, all KPI numbers update automatically.
Here You Can See:
-
MTD Actual
-
MTD Target
-
MTD Previous Year
-
Target vs Actual (with up/down arrows)
-
Previous Year vs Actual comparison
-
YTD Actual
-
YTD Target
-
YTD Previous Year
Conditional formatting highlights performance visually:
-
Green arrow = performance above target
-
Red arrow = performance below target
Therefore, managers instantly understand which KPIs need attention.
Click to Purchases Cloud Hosting Services KPI Dashboard in Excel
3️⃣ What Is the KPI Trend Sheet?
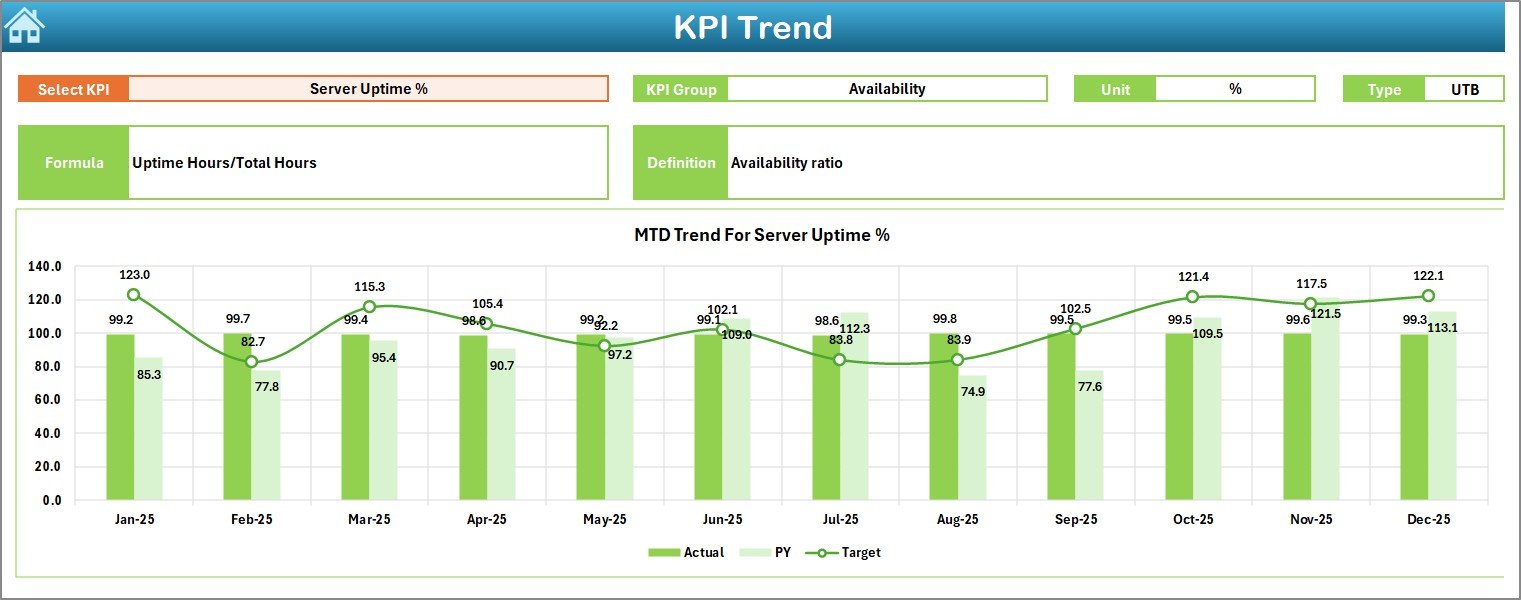
While the dashboard shows summary results, the KPI Trend Sheet provides detailed analysis.
On range C3, you select a KPI from the dropdown list. Then the sheet displays:
-
KPI Group
-
KPI Unit
-
KPI Type (Lower the Better or Upper the Better)
-
KPI Formula
-
KPI Definition
Moreover, it shows trend charts for:
-
MTD Actual vs Target vs Previous Year
-
YTD Actual vs Target vs Previous Year
As a result, you analyze performance patterns month by month.
Click to Purchases Cloud Hosting Services KPI Dashboard in Excel
4️⃣ What Is the Actual Numbers Input Sheet?
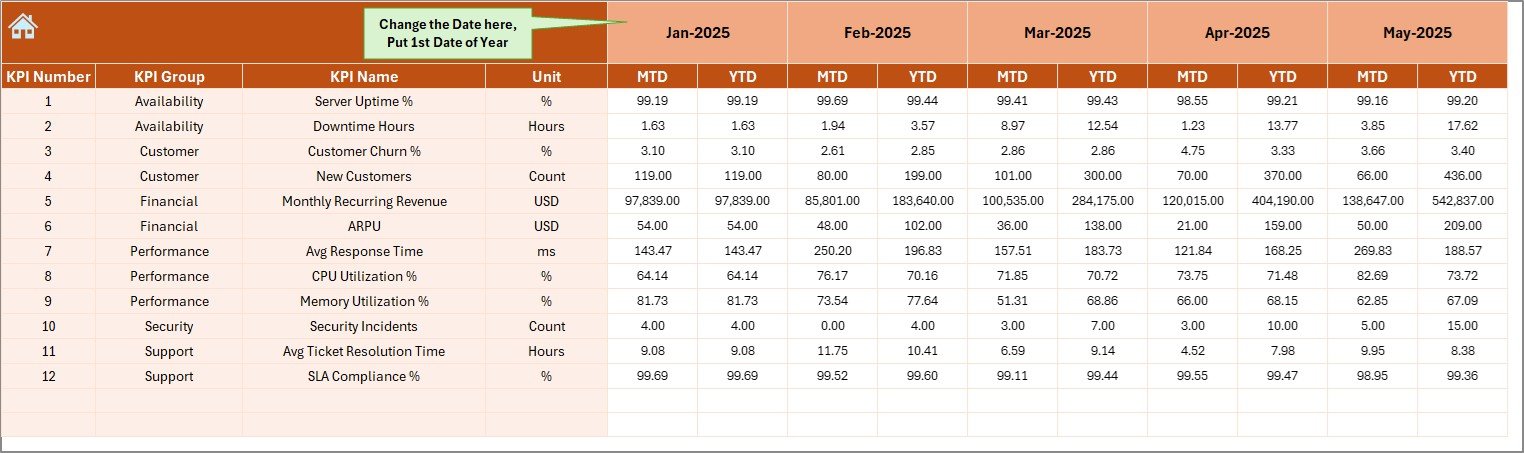
This sheet acts as the data entry center.
Here you:
-
Enter MTD actual numbers
-
Enter YTD actual numbers
-
Change month in cell E1
Once you input the first month of the year, the structure follows automatically.
Because formulas link this sheet to the dashboard, numbers update instantly.
5️⃣ What Is the Target Sheet?
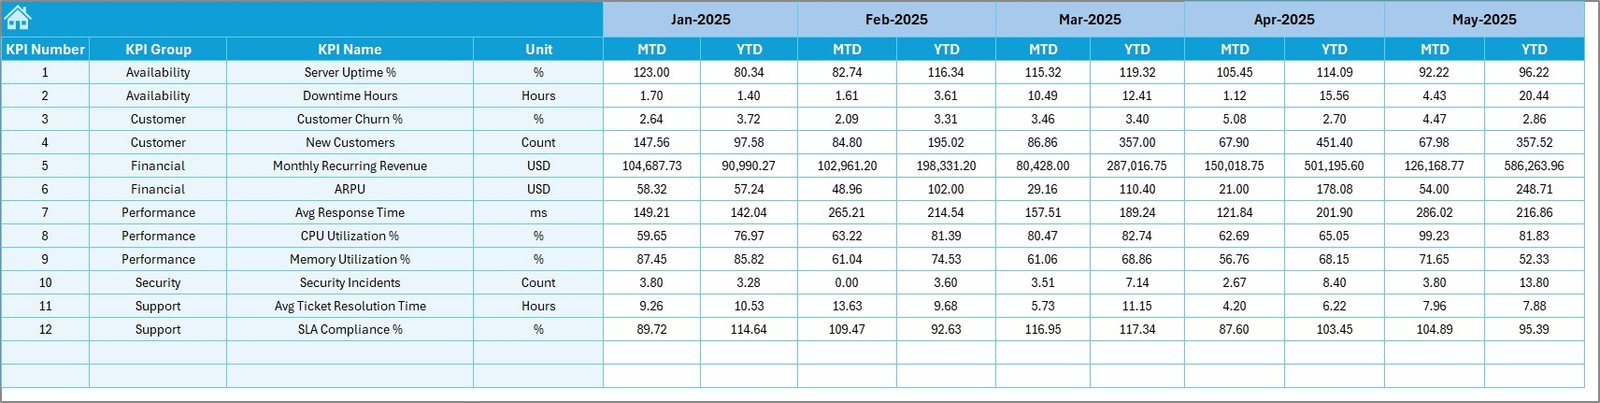
In the Target Sheet, you define:
-
Monthly MTD targets
-
Monthly YTD targets
Therefore, you create clear benchmarks for performance.
Without targets, you cannot measure success. However, this sheet ensures accountability.
6️⃣ What Is the Previous Year Number Sheet?
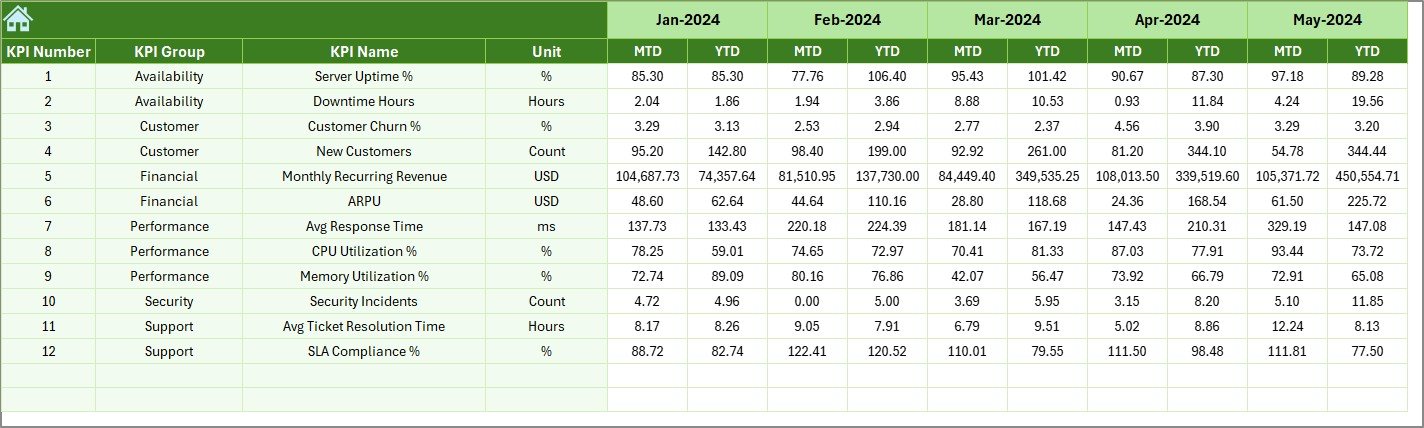
Performance comparisons become meaningful only when you compare historical data.
In this sheet, you enter previous year numbers similar to current year data.
As a result, you analyze:
-
Growth trends
-
Performance improvements
-
Year-over-year comparisons
7️⃣ What Is the KPI Definition Sheet?
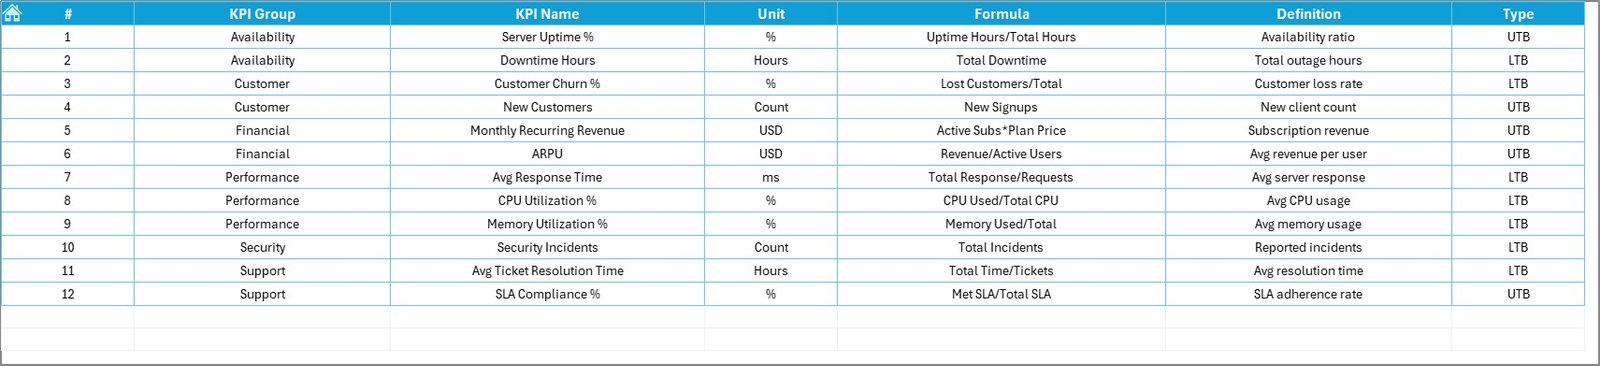
Clarity begins with definition.
In this sheet, you define:
-
KPI Name
-
KPI Group
-
Unit
-
Formula
-
KPI Definition
For example:
-
Uptime % = (Available Time ÷ Total Time) × 100
-
Churn Rate = (Lost Customers ÷ Total Customers) × 100
Therefore, every stakeholder understands the measurement logic clearly.
Click to Purchases Cloud Hosting Services KPI Dashboard in Excel
What KPIs Should You Track in Cloud Hosting Services?
Cloud hosting companies must track technical, financial, and customer KPIs.
🔹 Infrastructure KPIs
-
Server Uptime %
-
Downtime Hours
-
CPU Utilization Rate
-
Storage Utilization %
🔹 Performance KPIs
-
Average Response Time
-
Latency Rate
-
SLA Compliance %
🔹 Financial KPIs
-
Monthly Recurring Revenue (MRR)
-
Customer Acquisition Cost
-
Infrastructure Cost per User
-
Gross Margin %
🔹 Customer KPIs
-
Churn Rate
-
Customer Satisfaction Score
-
Ticket Resolution Time
Because cloud hosting services depend on reliability and scalability, these KPIs provide full visibility.
How Does This Dashboard Improve Operational Efficiency?
First, it centralizes data.
Second, it reduces manual reporting.
Third, it provides visual insights instantly.
For example:
If uptime drops below 99.5%, the red arrow alerts you immediately.
If churn rate increases, you investigate service quality.
Therefore, you take corrective actions quickly.
Click to Purchases Cloud Hosting Services KPI Dashboard in Excel
Advantages of Cloud Hosting Services KPI Dashboard in Excel
Now let’s explore the major benefits.
✅ Centralized KPI Monitoring
All KPIs stay in one structured file.
✅ Instant Visual Insights
Conditional formatting provides quick performance signals.
✅ Real-Time Updates
When you update input data, the dashboard reflects changes immediately.
✅ Easy Customization
You can:
-
Add new KPIs
-
Adjust formulas
-
Modify targets
-
Change KPI groups
✅ Budget-Friendly Solution
Excel eliminates the need for expensive BI software.
✅ Better Strategic Planning
Historical comparisons help forecast future growth.
✅ Improved Team Accountability
Clear targets encourage ownership.
Click to Purchases Cloud Hosting Services KPI Dashboard in Excel
Best Practices for the Cloud Hosting Services KPI Dashboard
To maximize effectiveness, follow these best practices:
1️⃣ Define Critical KPIs Clearly
Focus on service reliability, cost control, and customer satisfaction.
2️⃣ Avoid Too Many Metrics
Too many KPIs create confusion. Therefore, prioritize impact-driven metrics.
3️⃣ Update Data Monthly
Consistent updates maintain accuracy.
4️⃣ Conduct Monthly Review Meetings
Discuss MTD and YTD performance regularly.
5️⃣ Align KPIs with Business Strategy
Ensure each KPI supports growth, scalability, or service quality.
6️⃣ Use Historical Comparisons
Year-over-year analysis provides meaningful context.
7️⃣ Train Teams to Interpret Dashboard Data
Understanding data ensures better decisions.
How to Implement the Cloud Hosting Services KPI Dashboard Successfully?
Follow this step-by-step approach:
-
Identify business goals
-
Define KPIs and targets
-
Input baseline data
-
Assign KPI ownership
-
Review monthly performance
-
Adjust strategies based on insights
Because cloud technology evolves constantly, continuous monitoring ensures long-term success.
Conclusion
Cloud hosting services demand high reliability, cost efficiency, and strong customer satisfaction. However, without structured tracking, companies lose visibility.
The Cloud Hosting Services KPI Dashboard in Excel provides:
-
Clear performance monitoring
-
MTD and YTD analysis
-
Target vs Actual comparison
-
Historical trend analysis
-
Centralized KPI management
Therefore, if you want to scale your cloud hosting business confidently, you must implement a structured KPI dashboard today.
Click to Purchases Cloud Hosting Services KPI Dashboard in Excel
Frequently Asked Questions with Answers
1. What is a Cloud Hosting Services KPI Dashboard in Excel?
It is a structured Excel template that tracks cloud hosting performance using measurable KPIs.
2. Why should cloud service providers use Excel instead of complex tools?
Excel provides flexibility, simplicity, and cost efficiency without technical complexity.
3. What is the difference between MTD and YTD?
MTD shows performance for the current month.
YTD shows cumulative performance for the year.
4. How many KPIs should a cloud hosting company track?
Most companies track 15 to 25 key KPIs depending on business size.
5. Can startups use this dashboard?
Yes. Startups can customize the template according to their scale.
6. How often should we review the dashboard?
Review it monthly and analyze trends quarterly.
7. Does this dashboard support scalability?
Yes. You can add new KPIs as your business grows.
Click to Purchases Cloud Hosting Services KPI Dashboard in Excel
Visit our YouTube channel to learn step-by-step video tutorials