The tool and die industry drives modern manufacturing. Automotive plants, aerospace companies, electronics factories, and heavy equipment manufacturers all depend on precision tools and dies. However, many tool rooms still rely on scattered Excel sheets and manual reports.
As a result, managers struggle to track profit, cost, quality, and material usage in one place.
So, how can you monitor tool performance, die efficiency, material cost, and monthly profit in a single interactive system?
The answer is simple.
Click to Purchases Tool and Die Manufacturing Dashboard in Power BI
You need a Tool and Die Manufacturing Dashboard in Power BI.
This powerful dashboard transforms raw manufacturing data into clear, interactive insights. Moreover, it helps production managers, plant heads, and finance teams make faster and better decisions.
In this complete guide, you will learn:
-
What a Tool and Die Manufacturing Dashboard in Power BI is
-
Why tool and die manufacturers need it
-
Detailed explanation of all 5 dashboard pages
-
Advantages of Tool and Die Manufacturing Dashboard in Power BI
-
Best practices for implementation
-
Frequently Asked Questions with Answers
Let us explore everything step by step.
What Is a Tool and Die Manufacturing Dashboard in Power BI?
A Tool and Die Manufacturing Dashboard in Power BI is an interactive data visualization solution designed specifically for tool rooms, die manufacturing units, and precision engineering companies.
It collects data such as:
-
Tool type
-
Die type
-
Material type
-
Industry segment
-
Labor cost
-
Material cost
-
Total cost
-
Revenue
-
Profit margin
-
Quality rating
-
Monthly performance
Then, it transforms that data into dynamic charts, cards, and slicers.
Instead of searching through multiple spreadsheets, managers get real-time insights in one dashboard. Therefore, they save time and improve operational control.
Why Do Tool and Die Manufacturers Need a Power BI Dashboard?
Tool and die manufacturing involves tight tolerances, high material cost, and strict quality standards. Moreover, small mistakes can lead to large financial losses.
However, many companies still face these common challenges:
-
Poor visibility into material cost trends
-
Difficulty tracking quality ratings by region
-
Lack of profit margin analysis by die type
-
No clear view of monthly revenue patterns
-
Manual reporting delays
Because of these problems, decision-makers often react late.
On the other hand, a Power BI dashboard provides:
-
Real-time performance tracking
-
Interactive filtering
-
Clear comparison between cost and revenue
-
Visual profit margin analysis
-
Month-wise performance insights
Therefore, companies improve efficiency and profitability.
Detailed Explanation of All 5 Dashboard Pages
Now let us explore each dashboard page in detail.
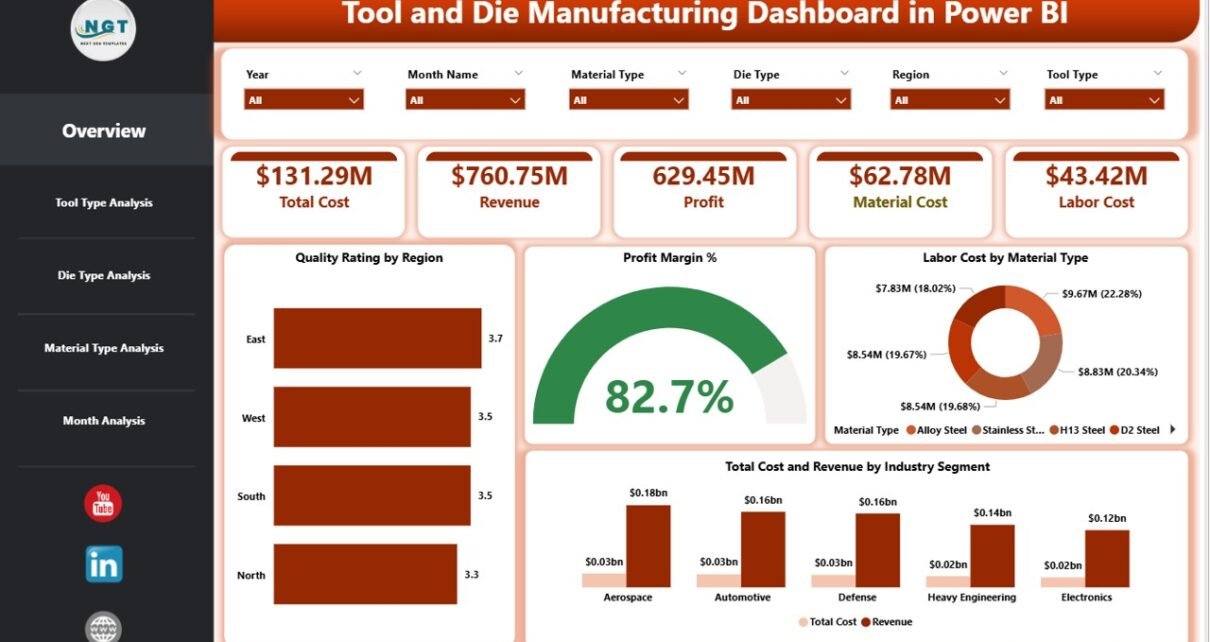
1️⃣ Overview Page – What Does the Main Dashboard Show?
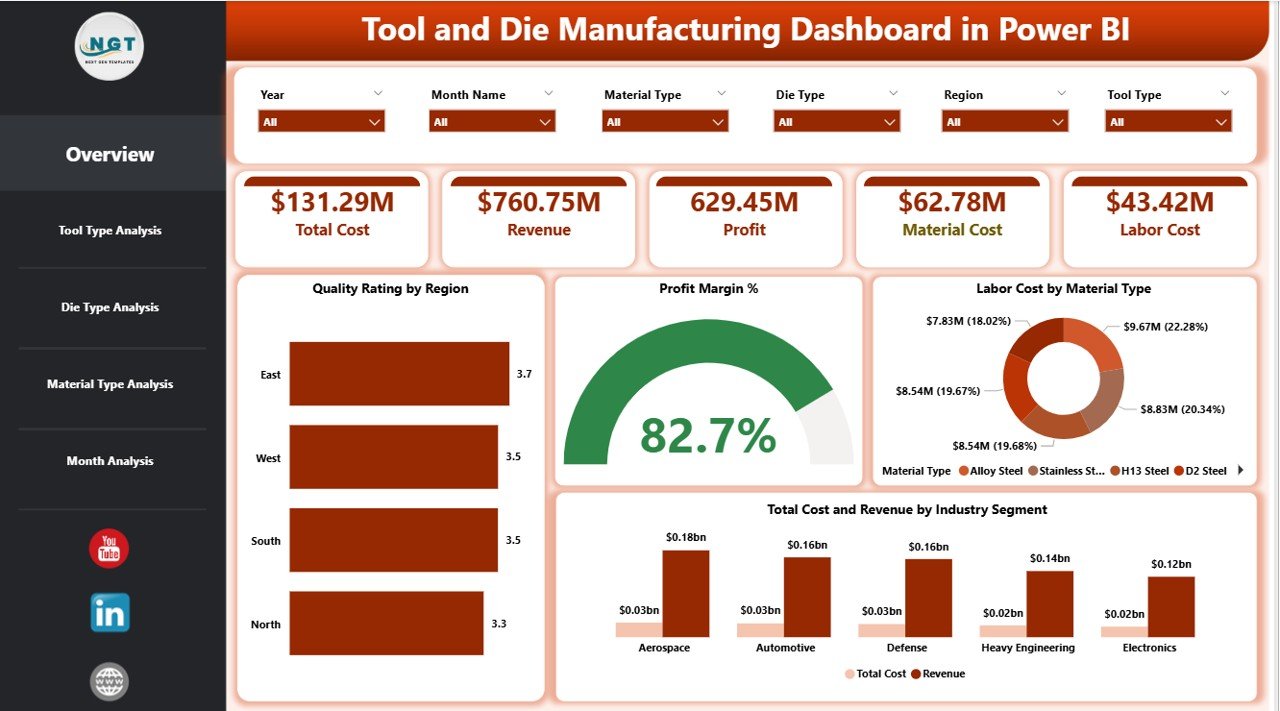
The Overview Page acts as the control center of the Tool and Die Manufacturing Dashboard in Power BI.
🔹 Key Features of the Overview Page
-
Interactive slicers (filters)
-
5 KPI cards
-
Multi-dimensional cost and revenue visuals
🔹 KPI Cards on the Overview Page
The dashboard displays five important cards:
-
Quality Rating by Region
-
Profit Margin %
-
Labor Cost by Material Type
-
Total Cost
-
Revenue by Industry Segment
Because these KPIs appear at the top, managers quickly understand performance status.
🔹 Why Is the Overview Page Important?
The Overview page:
-
Provides instant performance snapshot
-
Highlights profit margin changes
-
Shows regional quality comparison
-
Identifies high-cost materials
-
Displays revenue distribution across industries
Therefore, management can take quick action without switching pages.
Click to Purchases Tool and Die Manufacturing Dashboard in Power BI
2️⃣ Tool Type Analysis – How Do Different Tools Perform?
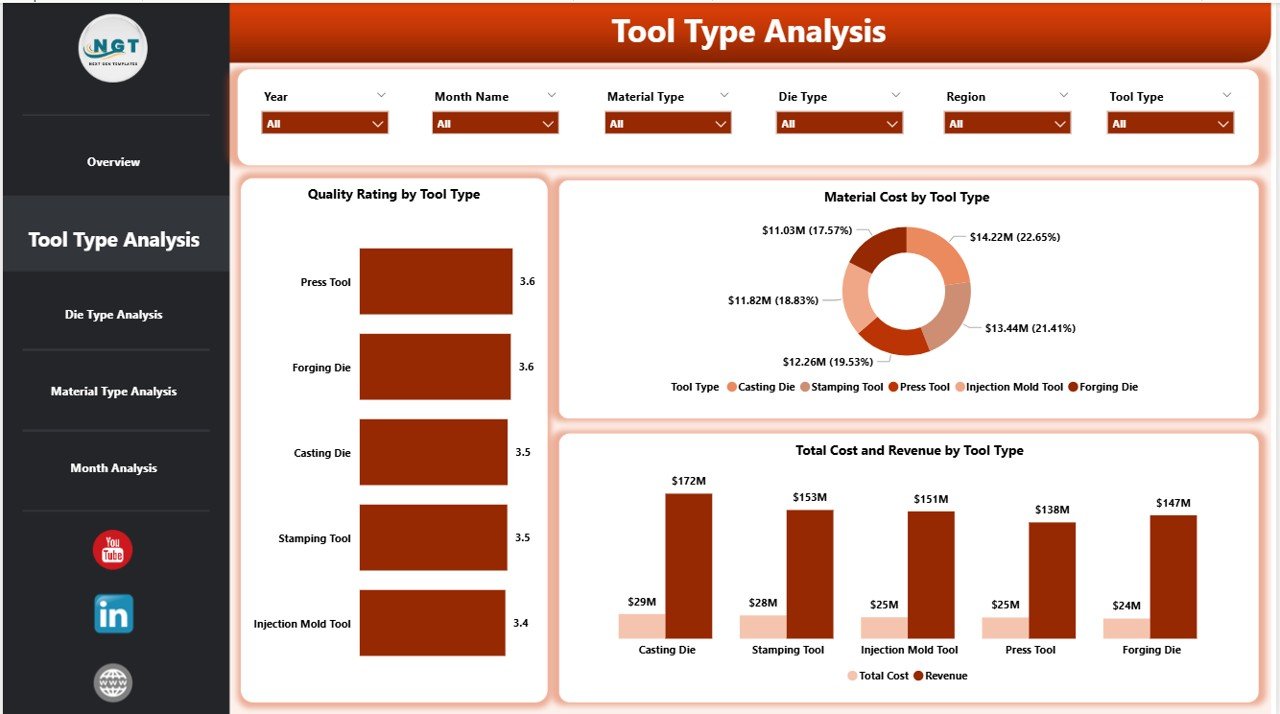
The Tool Type Analysis page focuses on performance by tool category.
🔹 Charts Included on Tool Type Analysis Page
-
Quality Rating by Tool Type
-
Total Cost and Revenue by Industry Tool Type
-
Material Cost by Tool Type
🔹 What Insights Can You Gain?
Using this page, you can:
-
Identify high-performing tool types
-
Compare cost vs revenue per tool category
-
Detect tools with high material consumption
-
Improve pricing strategies
For example, if progressive dies generate higher revenue but also higher material cost, management can review procurement strategies.
As a result, profitability improves.
3️⃣ Die Type Analysis – Which Die Types Generate More Profit?
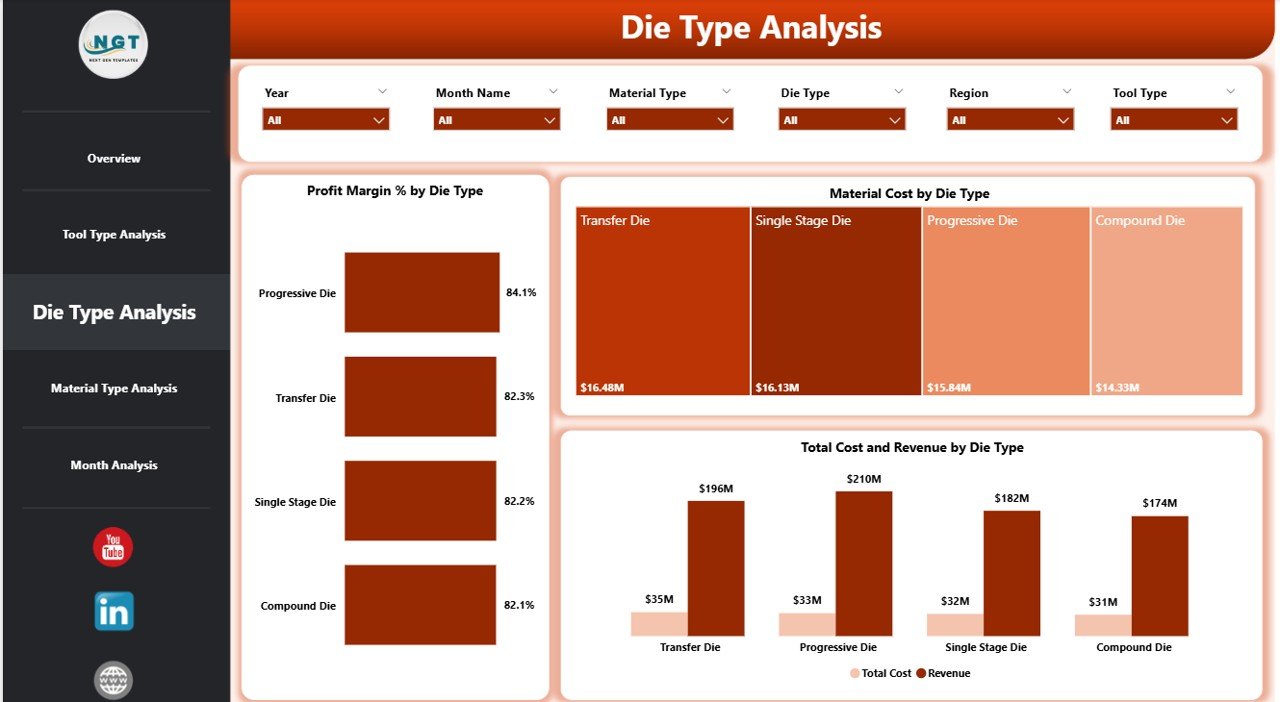
The Die Type Analysis page examines performance based on die categories.
🔹 Charts Included
-
Profit Margin % by Die Type
-
Total Cost and Revenue by Industry Die Type
-
Material Cost by Die Type
🔹 Why Is This Page Valuable?
Die manufacturing often varies in complexity. Therefore, different die types may produce different profit margins.
This page helps you:
-
Compare simple vs complex dies
-
Detect low-margin die types
-
Analyze material usage patterns
-
Optimize production allocation
If a certain die type shows low profit margin but high cost, management can review pricing or reduce waste.
Thus, the company increases efficiency.
4️⃣ Material Type Analysis – Which Materials Impact Profit the Most?
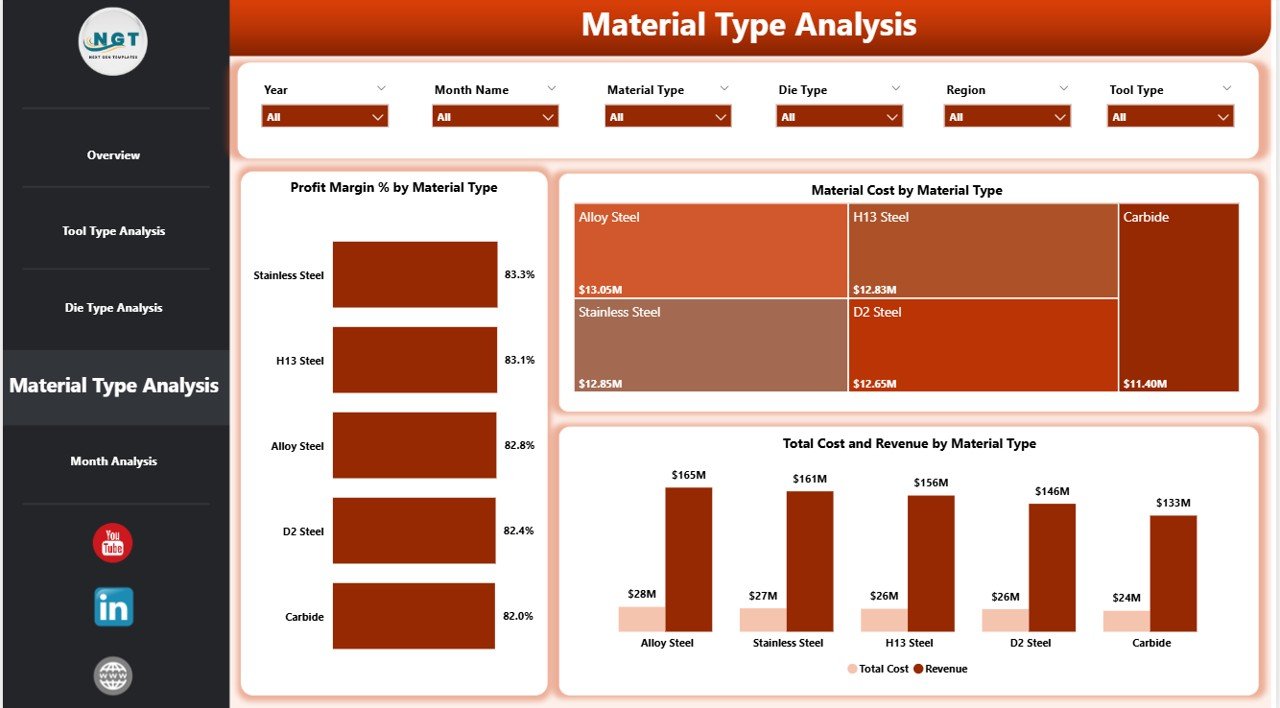
Material cost plays a major role in tool and die manufacturing.
Therefore, the Material Type Analysis page provides deep cost insight.
🔹 Charts Included
-
Profit Margin % by Material Type
-
Total Cost and Revenue by Material Type
-
Material Cost by Material Type
🔹 What Can You Analyze?
Using this page, you can:
-
Identify expensive material categories
-
Track profit margin impact by material
-
Compare revenue generated using different materials
-
Negotiate better supplier rates
For example, if alloy steel increases total cost significantly, management can explore alternative suppliers.
As a result, cost control improves.
Click to Purchases Tool and Die Manufacturing Dashboard in Power BI
5️⃣ Month Analysis – How Does Performance Change Over Time?
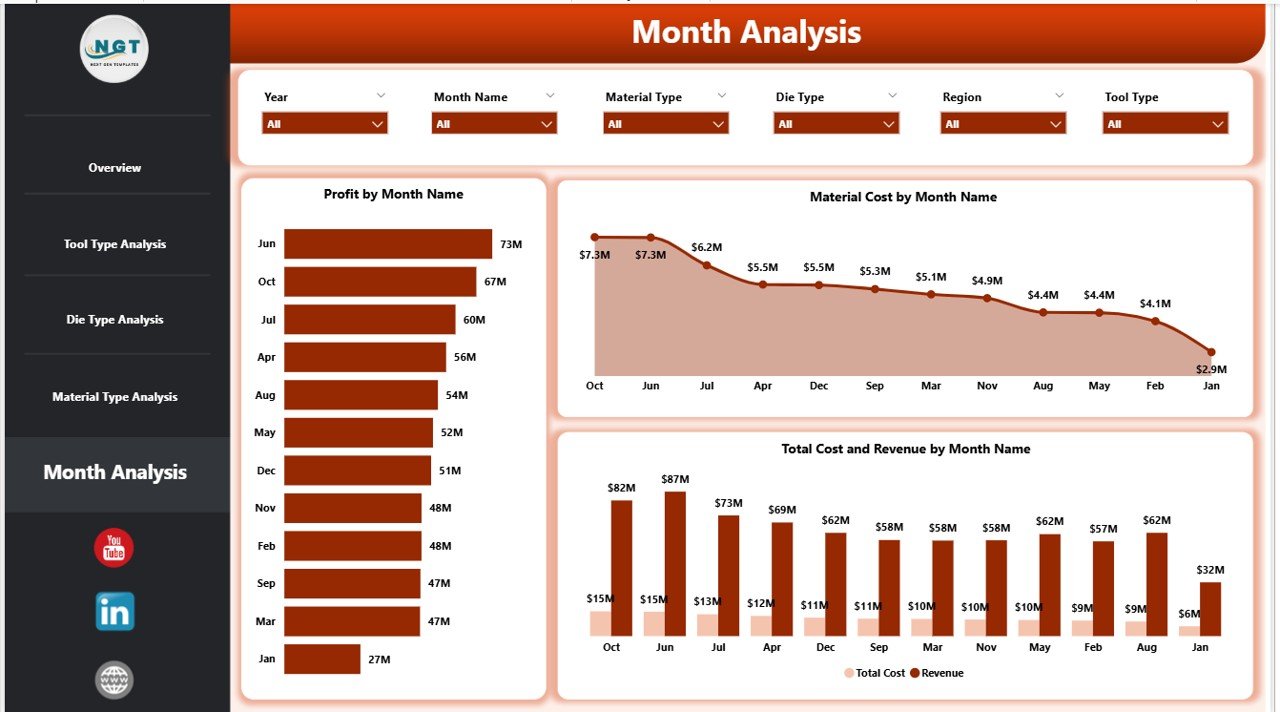
The Month Analysis page tracks time-based performance.
🔹 Charts Included
-
Profit by Month
-
Total Cost and Revenue by Month
-
Material Cost by Month
🔹 Why Is Month Analysis Critical?
Manufacturing performance changes monthly due to:
-
Order fluctuations
-
Raw material price changes
-
Labor shifts
-
Seasonal demand
Therefore, this page helps you:
-
Detect profit trends
-
Identify cost spikes
-
Track revenue growth
-
Plan future production
With monthly insights, companies improve forecasting and budgeting.
Advantages of Tool and Die Manufacturing Dashboard in Power BI
Now let us explore the major benefits.
1️⃣ Real-Time Data Visibility
You can monitor performance instantly. Therefore, you avoid reporting delays.
2️⃣ Improved Profit Margin Tracking
You can compare revenue and cost visually. As a result, you quickly detect low-margin areas.
3️⃣ Better Material Cost Control
You can identify expensive materials. Moreover, you can negotiate better pricing.
4️⃣ Quality Monitoring by Region
You can track quality rating across regions. Therefore, you improve production standards.
5️⃣ Faster Decision-Making
Interactive slicers allow quick filtering. Consequently, managers save time.
6️⃣ Clear Industry Segment Insights
You can analyze revenue by industry segment. Hence, you focus on profitable sectors.
7️⃣ Professional Reporting
Power BI visuals create clean and executive-ready reports. Therefore, management meetings become more data-driven.
Best Practices for the Tool and Die Manufacturing Dashboard in Power BI
To get maximum value, follow these best practices.
1️⃣ Maintain Clean Data
Always update data regularly. Moreover, remove duplicate entries.
2️⃣ Standardize Material Naming
Use consistent naming for materials. Otherwise, analysis becomes inaccurate.
3️⃣ Monitor Monthly Trends
Review month analysis regularly. Consequently, you detect cost fluctuations early.
4️⃣ Focus on High-Cost Categories
Analyze material and labor cost monthly. Then, optimize production processes.
5️⃣ Use Slicers Smartly
Filter data by region, industry, tool type, or die type. Therefore, you gain detailed insights.
6️⃣ Review Low Profit Margin Items
If profit margin falls below target, investigate immediately.
7️⃣ Align Dashboard with Business Goals
Track KPIs that directly impact profitability and quality.
How Does This Dashboard Improve Manufacturing Strategy?
Click to Purchases Tool and Die Manufacturing Dashboard in Power BI
A Tool and Die Manufacturing Dashboard in Power BI supports strategic decisions.
It helps companies:
-
Improve pricing strategies
-
Reduce material waste
-
Optimize labor cost
-
Increase quality standards
-
Focus on profitable industry segments
-
Strengthen supplier negotiations
Because of these improvements, companies grow faster and operate smarter.
Who Can Benefit from This Dashboard?
This dashboard benefits:
-
Tool room managers
-
Production supervisors
-
Plant heads
-
Finance managers
-
Cost accountants
-
Manufacturing directors
-
Operations analysts
Therefore, both operational and financial teams gain value.
Conclusion
Tool and die manufacturing requires precision, cost control, and quality monitoring. However, manual spreadsheets slow down analysis and reduce clarity.
A Tool and Die Manufacturing Dashboard in Power BI solves these problems.
It provides:
-
Clear profit margin tracking
-
Cost and revenue comparison
-
Tool and die performance analysis
-
Material cost insights
-
Monthly trend monitoring
As a result, managers make faster and smarter decisions.
If you want to improve manufacturing performance, reduce cost, and increase profitability, this dashboard becomes a powerful solution.
Frequently Asked Questions with Answers
1️⃣ What is a Tool and Die Manufacturing Dashboard in Power BI?
It is an interactive reporting system that tracks cost, revenue, profit margin, material usage, and quality rating for tool and die manufacturers.
2️⃣ How does this dashboard help improve profit?
It shows cost and revenue comparisons clearly. Therefore, you can identify low-margin products and optimize pricing.
3️⃣ Can I analyze monthly trends using this dashboard?
Yes. The Month Analysis page tracks profit, cost, and material usage month by month.
4️⃣ Does this dashboard support filtering by tool and die type?
Yes. You can filter performance using slicers by tool type, die type, material type, region, and industry segment.
5️⃣ Is this dashboard suitable for small manufacturing companies?
Yes. Both small and large manufacturing units can use this dashboard to improve data visibility.
6️⃣ What KPIs are included in this dashboard?
It includes:
-
Quality Rating
-
Profit Margin %
-
Total Cost
-
Revenue
-
Labor Cost
-
Material Cost
7️⃣ Why should I use Power BI instead of Excel?
Power BI offers interactive visuals, dynamic filtering, and better scalability. Therefore, it improves decision-making speed.
Visit our YouTube channel to learn step-by-step video tutorials