Cyber threats grow every day. Meanwhile, regulations become stricter. At the same time, organizations face constant pressure to protect sensitive data. So, how do you measure whether your IT security audits truly work?You need a structured, data-driven system.That is exactly where the IT Security Auditing KPI Dashboard in Excel becomes powerful.Instead of checking reports manually, you can track audit performance, compliance levels, risk exposure, and remediation progress in one centralized dashboard. Moreover, you can monitor monthly and yearly trends instantly. As a result, security leaders make faster and smarter decisions.
In this complete guide, you will learn:
- What an IT Security Auditing KPI Dashboard in Excel is
- Why organizations need it
- Detailed explanation of all 7 worksheets
- Key KPIs for IT security auditing
- Advantages of using this dashboard
- Best practices for implementation
- Frequently Asked Questions with answers
Click to buy IT Security Auditing KPI Dashboard in Excel
What Is an IT Security Auditing KPI Dashboard in Excel?
An IT Security Auditing KPI Dashboard in Excel is a ready-to-use performance tracking system designed to monitor key security audit metrics in a structured format.
It transforms raw audit data into:
- Clear KPI comparisons
- Monthly and yearly performance tracking
- Target vs Actual evaluation
- Previous year benchmarking
- Visual trend charts
Instead of using scattered spreadsheets, this dashboard centralizes everything into one interactive system.
Moreover, it allows users to select any month from a drop-down menu. Immediately, the entire dashboard updates automatically. Therefore, decision-makers gain instant insights without manual calculations.
Why Do Organizations Need an IT Security Auditing KPI Dashboard?
Every organization conducts security audits. However, many struggle to measure effectiveness.
Without structured tracking:
- Security gaps remain hidden
- Compliance issues increase
- Remediation actions get delayed
- Leadership lacks visibility
On the other hand, when you use a KPI dashboard:
- You track audit findings in real time
- You monitor compliance percentage
- You evaluate remediation speed
- You compare performance year-over-year
Consequently, you reduce risks and strengthen governance.
What Are the Key Features of the IT Security Auditing KPI Dashboard in Excel?
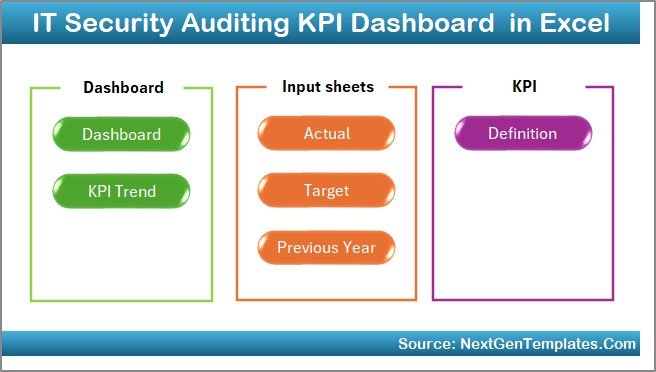
This dashboard contains 7 structured worksheets. Each sheet plays a specific role in performance monitoring.
Let us examine each one carefully.
Summary Page
The Summary Page works as an index sheet.
Here, you will find:
- 6 navigation buttons
- Quick access to all major sheets
- Structured layout for easy movement
Instead of searching manually, you simply click a button and jump to the desired section.
Therefore, it improves user experience and saves time.
Click to buy IT Security Auditing KPI Dashboard in Excel
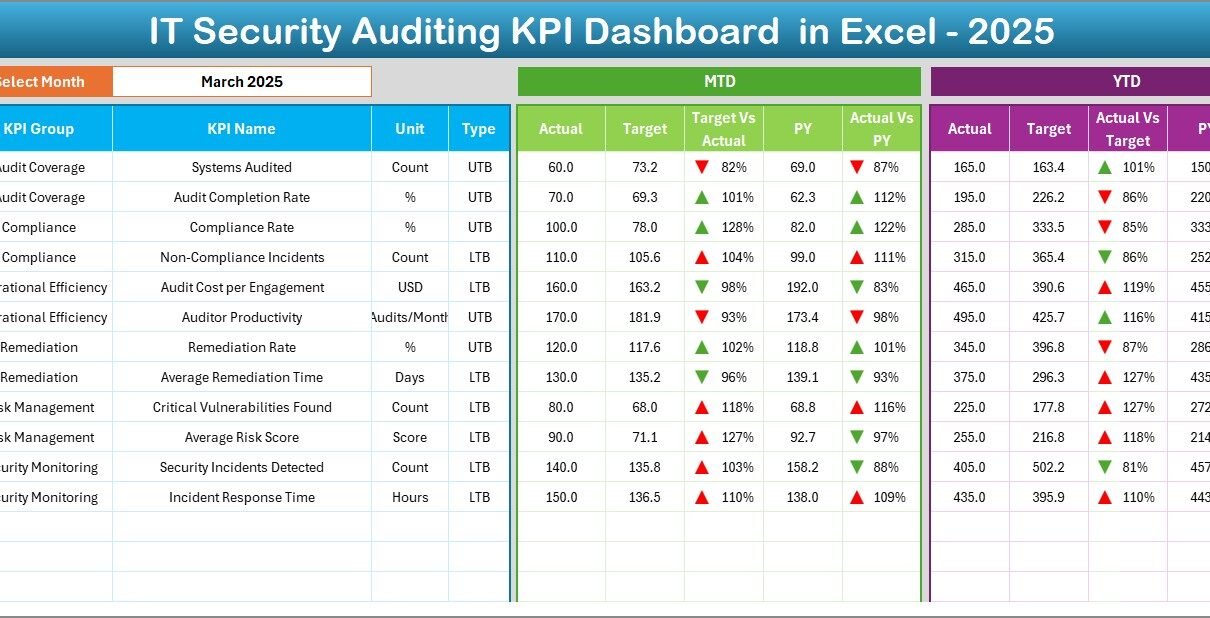
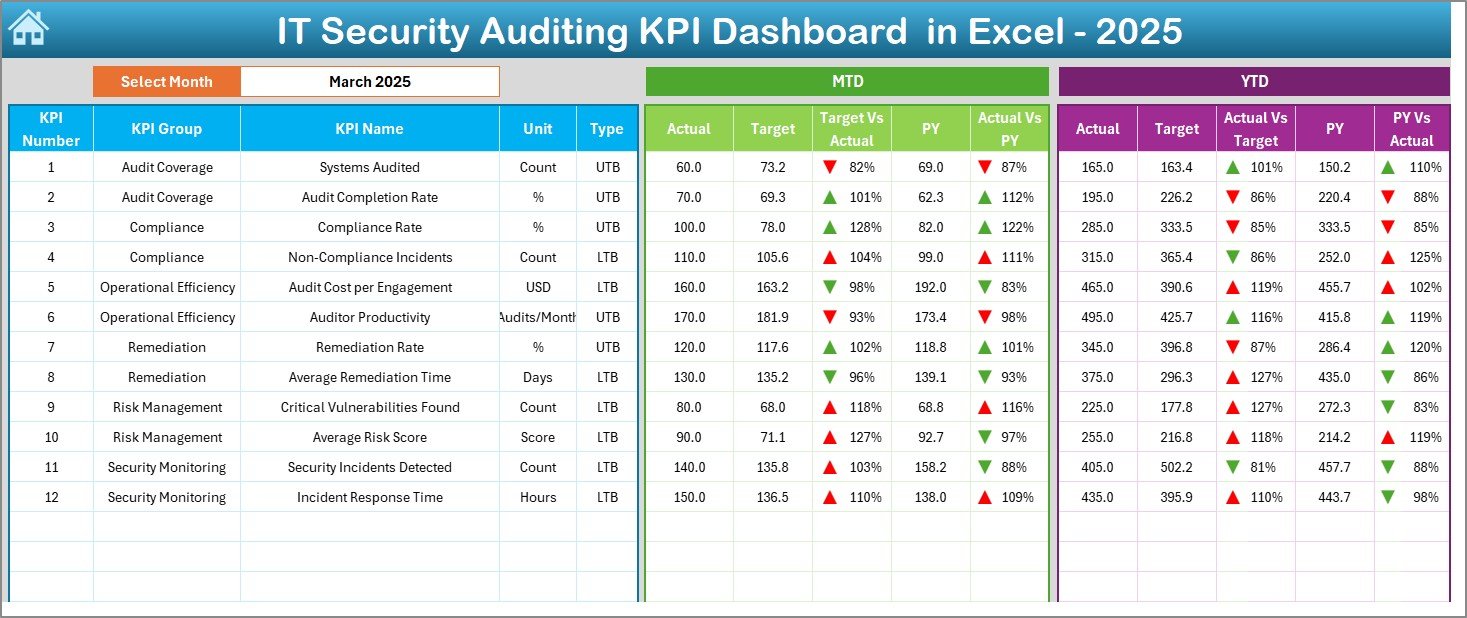
Main Dashboard Sheet
The Dashboard Sheet acts as the central performance screen.
On cell D3, you can select any month from the drop-down list. As soon as you change the month:
- All KPI values update automatically
- All comparisons refresh instantly
- Charts adjust dynamically
What Does the Dashboard Show?
It displays:
MTD (Month-to-Date) Metrics
- MTD Actual
- MTD Target
- MTD Previous Year
- Target vs Actual comparison
- Previous Year vs Actual comparison
- Conditional formatting with up/down arrows
YTD (Year-to-Date) Metrics
- YTD Actual
- YTD Target
- YTD Previous Year
- Target vs Actual
- Previous Year vs Actual
- Visual indicators for performance direction
As a result, leadership quickly identifies:
- Underperforming audit areas
- Overachieving compliance metrics
- Risk trends
Click to buy IT Security Auditing KPI Dashboard in Excel
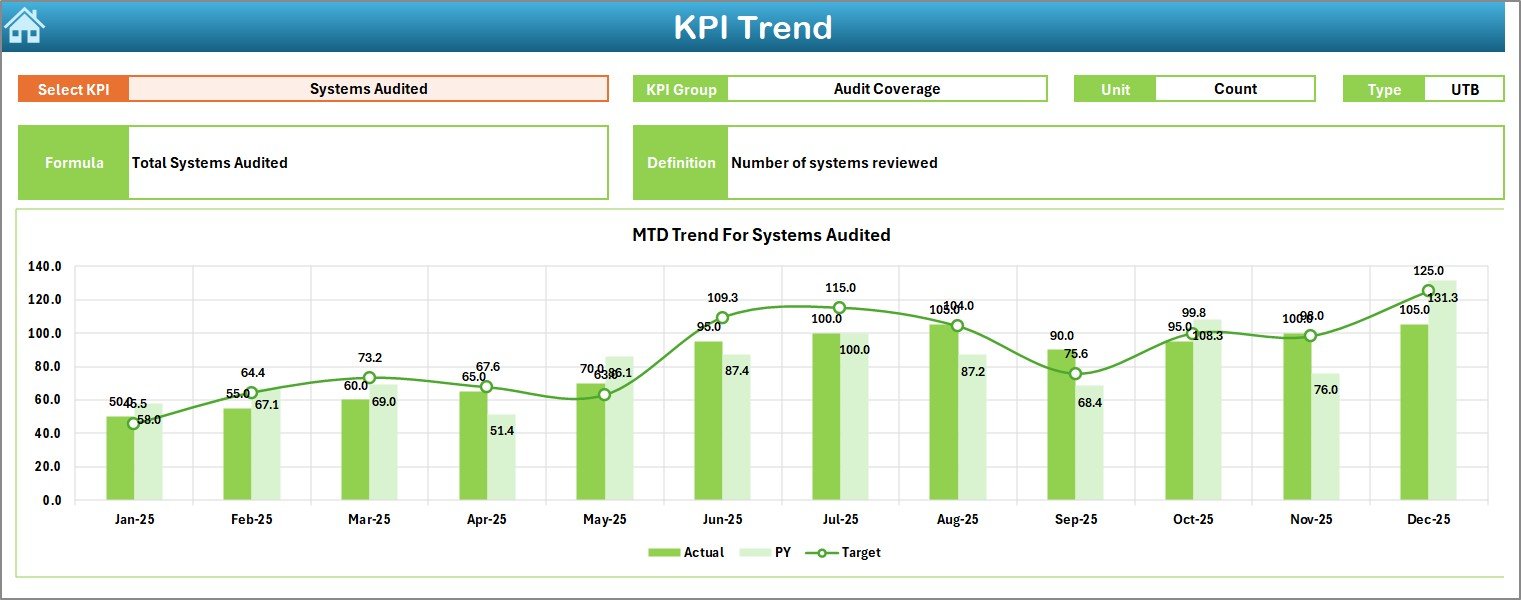
Trend Sheet Show
The Trend Sheet provides deep analysis.
On cell C3, you select any KPI from the drop-down list.
Immediately, the sheet displays:
- KPI Group
- KPI Unit
- KPI Type (Lower the Better or Upper the Better)
- KPI Formula
- KPI Definition
Additionally, it shows:
- MTD Trend Chart (Actual vs Target vs Previous Year)
- YTD Trend Chart (Actual vs Target vs Previous Year)
Therefore, instead of reviewing raw numbers, you visualize performance trends over time.
Click to buy IT Security Auditing KPI Dashboard in Excel
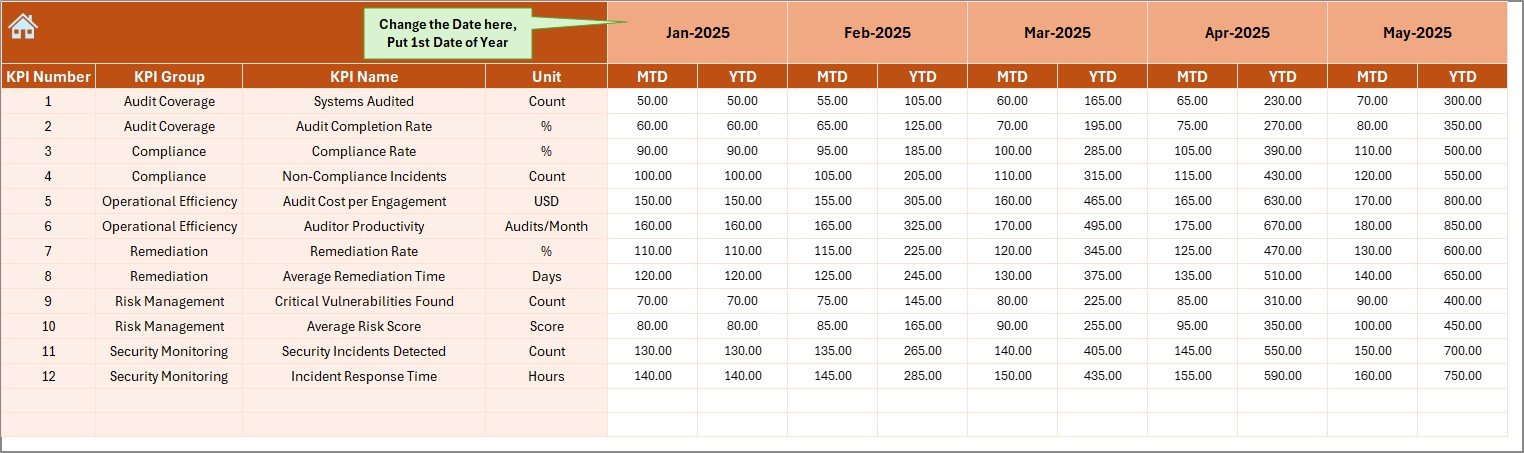
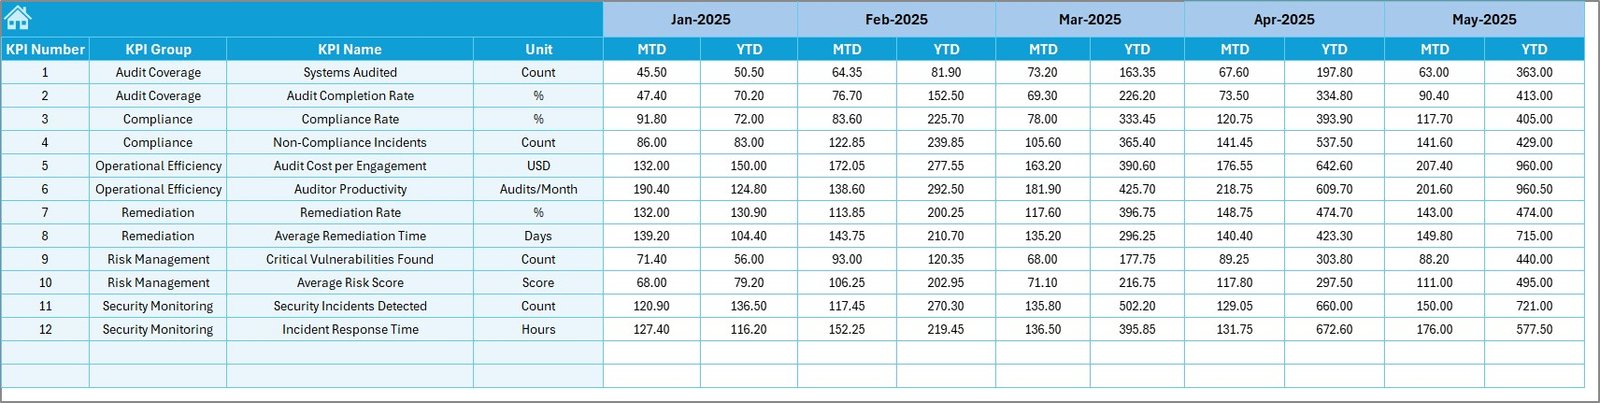
Actual Numbers Input Sheet
The Actual Numbers Input Sheet stores real-time data.
You simply:
- Enter the first month of the year in cell E1
- Input MTD and YTD values
- Update monthly performance
Once you enter the data, the dashboard updates automatically.
This structure ensures:
- Data consistency
- Controlled input process
- Easy maintenance
Click to buy IT Security Auditing KPI Dashboard in Excel
Target Sheet
The Target Sheet contains KPI goals.
Here, you enter:
- Monthly targets
- YTD targets
- KPI-specific performance goals
Because of this structured target entry, you can:
- Compare actual performance with goals
- Identify compliance gaps
- Improve accountability
Click to buy IT Security Auditing KPI Dashboard in Excel
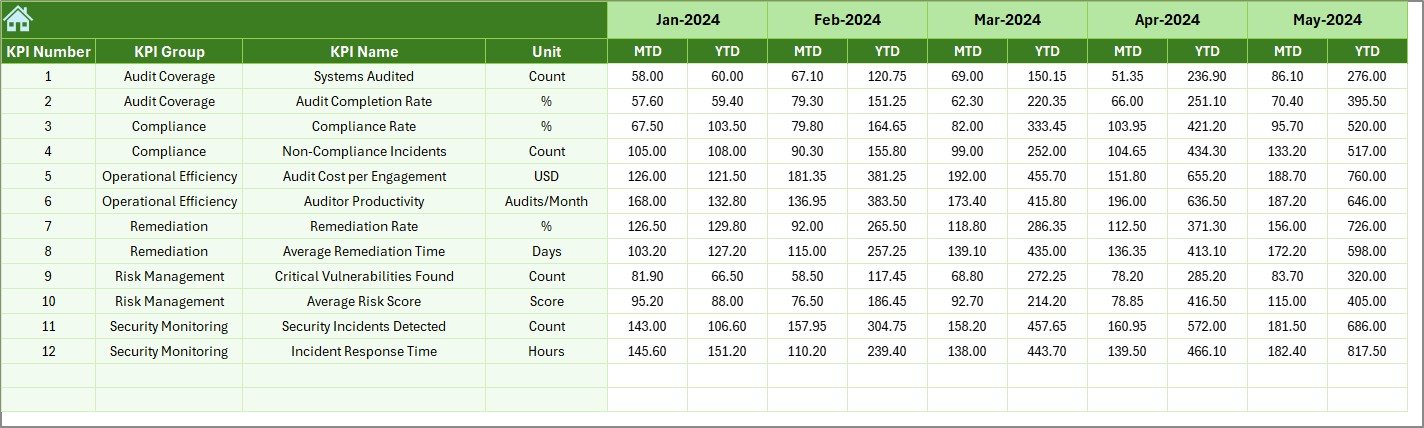
Previous Year Sheet
The Previous Year Number Sheet allows year-over-year comparison.
You enter last year’s:
- MTD numbers
- YTD numbers
Then, the dashboard compares:
- Current vs Previous Year
- Growth trends
- Performance consistency
Therefore, management sees long-term improvements clearly.
Click to buy IT Security Auditing KPI Dashboard in Excel
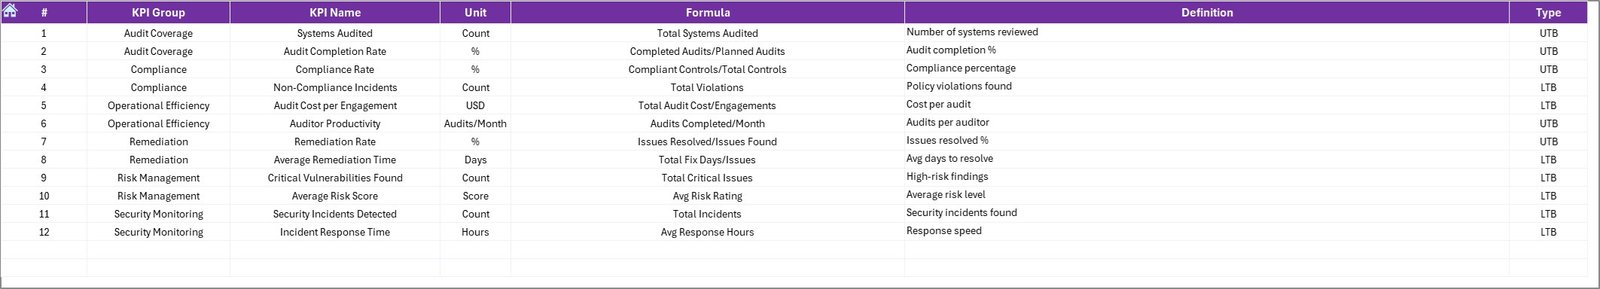
KPI Definition Sheet
The KPI Definition Sheet provides clarity.
Here, you enter:
- KPI Name
- KPI Group
- Unit
- Formula
- Definition
This ensures:
- No confusion about calculations
- Standardized KPI understanding
- Easy audit documentation
Consequently, teams align with common definitions.
Click to buy IT Security Auditing KPI Dashboard in Excel
Which KPIs Should You Track in an IT Security Auditing Dashboard?
A strong IT security auditing dashboard includes measurable and actionable KPIs.
Here are common examples:
- Number of Security Audits Conducted
- Audit Findings per Audit
- Critical Vulnerabilities Identified
- Average Remediation Time
- Compliance Rate (%)
- Patch Management Compliance
- Incident Response Time
- Risk Exposure Score
- Control Effectiveness Score
- Failed Security Checks
You can categorize them into groups such as:
- Compliance KPIs
- Risk KPIs
- Operational KPIs
- Governance KPIs
How Does MTD and YTD Tracking Improve Audit Performance?
MTD tracking helps you:
- Monitor short-term performance
- Identify current month issues
- Adjust quickly
Meanwhile, YTD tracking helps you:
- Measure long-term progress
- Evaluate annual goals
- Identify seasonal patterns
Therefore, combining both provides complete visibility.
Advantages of IT Security Auditing KPI Dashboard in Excel
Using this dashboard provides multiple benefits.
Centralized Data Control
You store all KPI data in one structured workbook.
Real-Time Performance Monitoring
You instantly compare Actual vs Target.
Year-Over-Year Benchmarking
You measure long-term improvements.
Improved Audit Transparency
Leadership views clear metrics instead of raw reports.
Easy Customization
You can modify KPIs based on your organization’s requirements.
Cost-Effective Solution
Excel eliminates the need for expensive software tools.
Data-Driven Decision Making
You rely on numbers instead of assumptions.
Best Practices for the IT Security Auditing KPI Dashboard in Excel
To maximize results, follow these best practices:
Define Clear KPI Objectives
First, align KPIs with business security goals.
Standardize KPI Definitions
Use the KPI Definition Sheet properly.
Update Data Regularly
Enter data monthly without delay.
Validate Data Accuracy
Cross-check audit numbers before entry.
Use Conditional Formatting Wisely
Ensure visual signals clearly show performance direction.
Review Trends Monthly
Conduct monthly review meetings using dashboard visuals.
Limit KPI Overload
Focus on high-impact security metrics.
How Can This Dashboard Improve Compliance and Governance?
Strong compliance requires measurable control.
This dashboard helps you:
- Track regulatory adherence
- Monitor audit findings
- Improve remediation timelines
- Document performance history
Therefore, governance becomes structured and transparent.
How Does This Dashboard Help Security Managers?
Security managers benefit in many ways:
- They detect risk trends early
- They justify security budgets with data
- They present audit reports clearly
- They prioritize remediation tasks
As a result, they gain credibility within the organization.
Conclusion: Why Should You Use an IT Security Auditing KPI Dashboard in Excel?
Cybersecurity requires continuous monitoring. However, manual tracking creates confusion and delays.
On the other hand, an IT Security Auditing KPI Dashboard in Excel provides:
- Structured KPI tracking
- Clear monthly insights
- Visual trend analysis
- Target comparison
- Year-over-year evaluation
Therefore, organizations improve security posture, strengthen compliance, and reduce risks.
If you want better audit visibility and stronger governance, this dashboard offers a simple yet powerful solution.
Frequently Asked Questions (FAQs)
What is the purpose of an IT Security Auditing KPI Dashboard?
It helps organizations measure audit performance, compliance levels, and risk exposure using structured KPIs.
Can I customize the KPIs in Excel?
Yes, you can easily add, remove, or modify KPIs in the KPI Definition Sheet.
What is the difference between MTD and YTD tracking?
MTD measures current month performance, while YTD measures performance from the beginning of the year until the selected month.
Do I need advanced Excel skills to use this dashboard?
No. Basic Excel knowledge allows you to update data and review performance.
How often should I update the dashboard?
You should update it monthly. However, you can update it more frequently if required.
Can this dashboard support compliance audits?
Yes. It helps track compliance KPIs and maintain audit documentation records.
Is Excel secure enough for audit tracking?
Yes, when you protect the workbook and control access properly.
Visit our YouTube channel to learn step-by-step video tutorials
Watch the step-by-step video tutorial:
Click to buy IT Security Auditing KPI Dashboard in Excel