In today’s fast-moving tech world, DevOps teams cannot rely on guesswork. They must track deployment speed, system stability, defect trends, and operational efficiency in real time. However, many teams still use scattered spreadsheets and manual reports. As a result, leaders struggle to measure performance clearly.
So, how can DevOps teams monitor KPIs in one structured place?
The answer is simple.
You need a DevOps Teams KPI Dashboard in Excel.
This ready-to-use dashboard centralizes DevOps metrics, tracks performance month by month, and compares Actual vs Target and Previous Year numbers. Moreover, it helps engineering managers, CTOs, and DevOps leaders make faster decisions with confidence.
Let us explore everything step by step.
Click to Purchases DevOps Teams KPI Dashboard in Excel
What Is a DevOps Teams KPI Dashboard in Excel?
A DevOps Teams KPI Dashboard in Excel is an interactive performance tracking tool built in Microsoft Excel. It allows DevOps teams to monitor critical metrics such as deployment frequency, lead time, change failure rate, and system uptime.
Instead of reviewing multiple files, you can:
-
Monitor Month-to-Date (MTD) and Year-to-Date (YTD) performance
-
Compare Actual vs Target instantly
-
Analyze Previous Year performance
-
Track trends visually with dynamic charts
-
Identify performance gaps quickly
Because the dashboard updates automatically when you change the month, you always see real-time insights.
Why Do DevOps Teams Need a KPI Dashboard?
DevOps focuses on speed, automation, and reliability. However, without measurement, improvement becomes impossible.
Here is why every DevOps team needs structured KPI tracking:
-
Deployment cycles grow complex
-
Infrastructure costs increase
-
Downtime impacts revenue
-
Security risks demand attention
-
Stakeholders require performance transparency
Therefore, a centralized KPI dashboard creates visibility, accountability, and continuous improvement.
Click to Purchases DevOps Teams KPI Dashboard in Excel
Key Features of DevOps Teams KPI Dashboard in Excel
This ready-to-use template contains 7 structured worksheets. Each sheet serves a specific purpose. Let us break them down clearly.
1️⃣ Home Sheet – How Does Navigation Work?
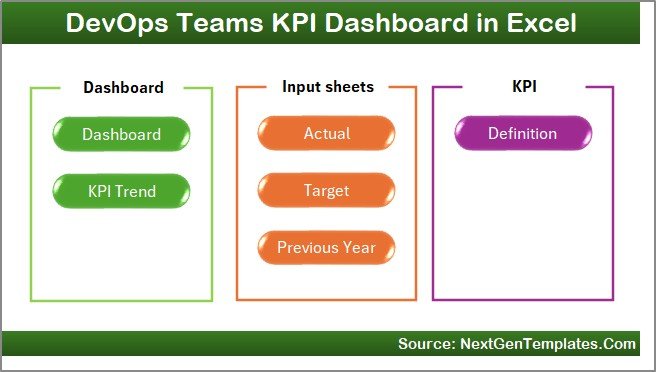
The Home Sheet acts as the index page.
Here you get:
-
6 clickable buttons
-
Quick navigation to all major sheets
-
Clean and professional interface
Because of this structured design, users can move between sheets without confusion.
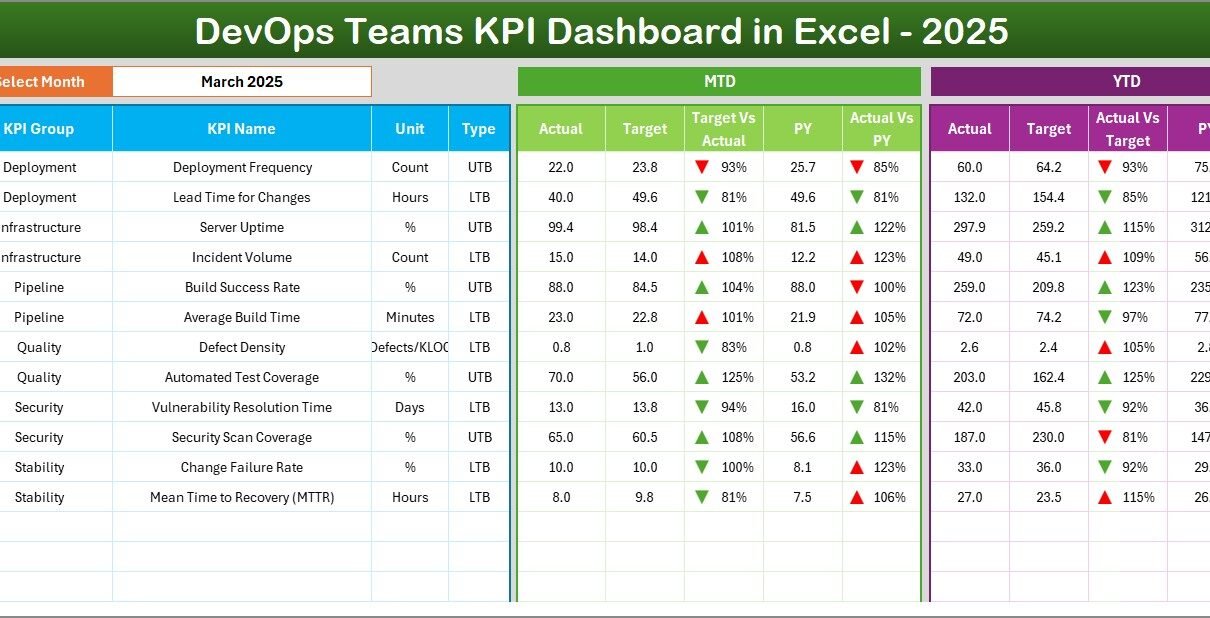
2️⃣ Dashboard Sheet – Where Do You See Overall Performance?
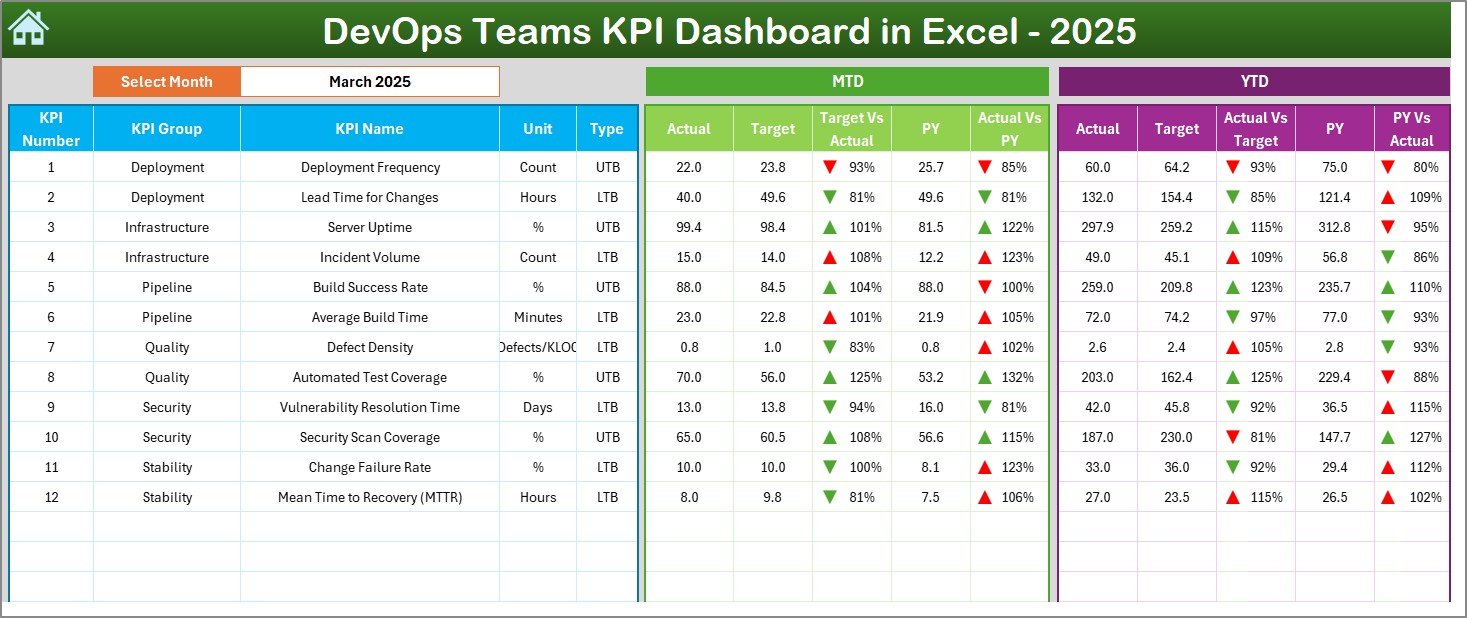
The Dashboard Sheet works as the main reporting page.
On cell D3, you can select the Month from a dropdown menu. Once you select the month, the entire dashboard updates automatically.
What does this sheet display?
📊 Month-to-Date (MTD) Metrics:
-
Actual
-
Target
-
Previous Year
-
Target vs Actual (with up/down arrows)
-
PY vs Actual (with conditional formatting)
📈 Year-to-Date (YTD) Metrics:
-
Actual
-
Target
-
Previous Year
-
Target vs Actual comparison
-
PY vs Actual comparison
Because conditional formatting uses arrows and color signals, leaders can instantly see improvement or decline.
Click to Purchases DevOps Teams KPI Dashboard in Excel
3️⃣ KPI Trend Sheet – How Do You Analyze Trends?
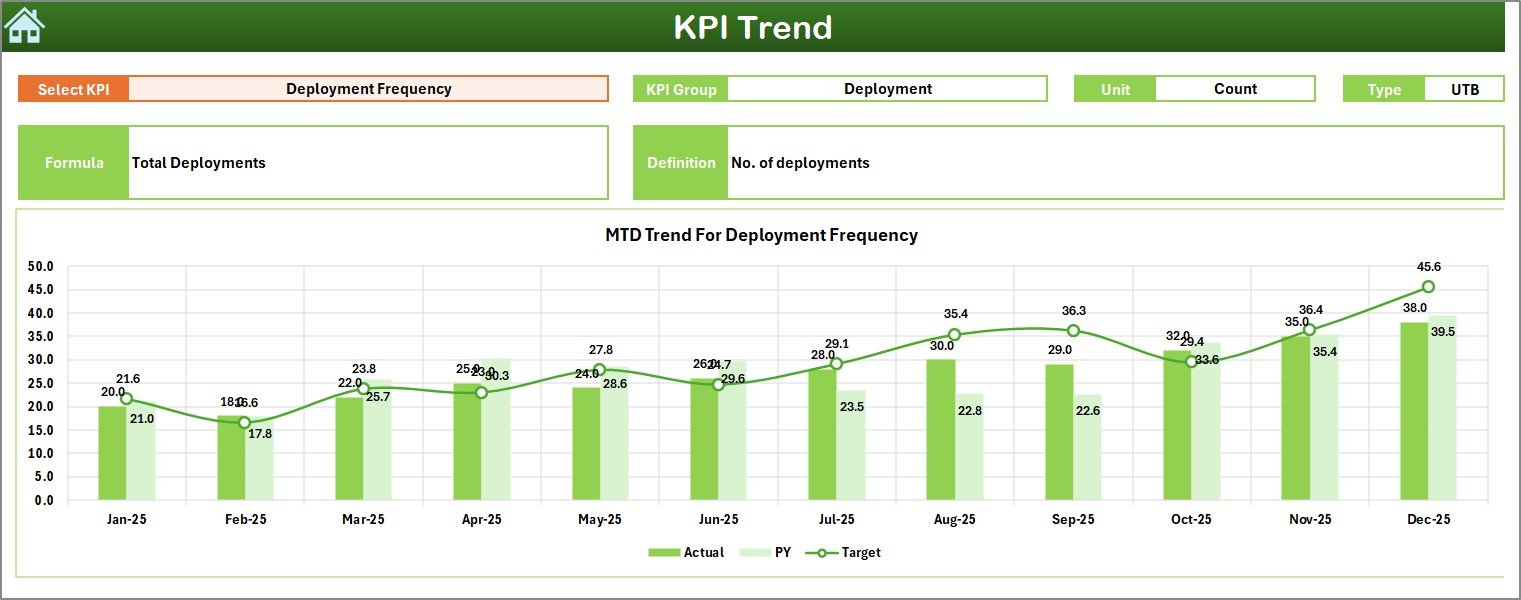
On the KPI Trend Sheet, you can select a KPI from dropdown cell C3.
Once selected, the sheet shows:
-
KPI Group
-
Unit of KPI
-
KPI Type (Lower the Better / Upper the Better)
-
Formula
-
Definition
Additionally, the sheet displays:
-
MTD Trend Chart
-
YTD Trend Chart
-
Actual vs Target vs Previous Year comparison
Therefore, this sheet helps teams identify patterns over time.
Click to Purchases DevOps Teams KPI Dashboard in Excel
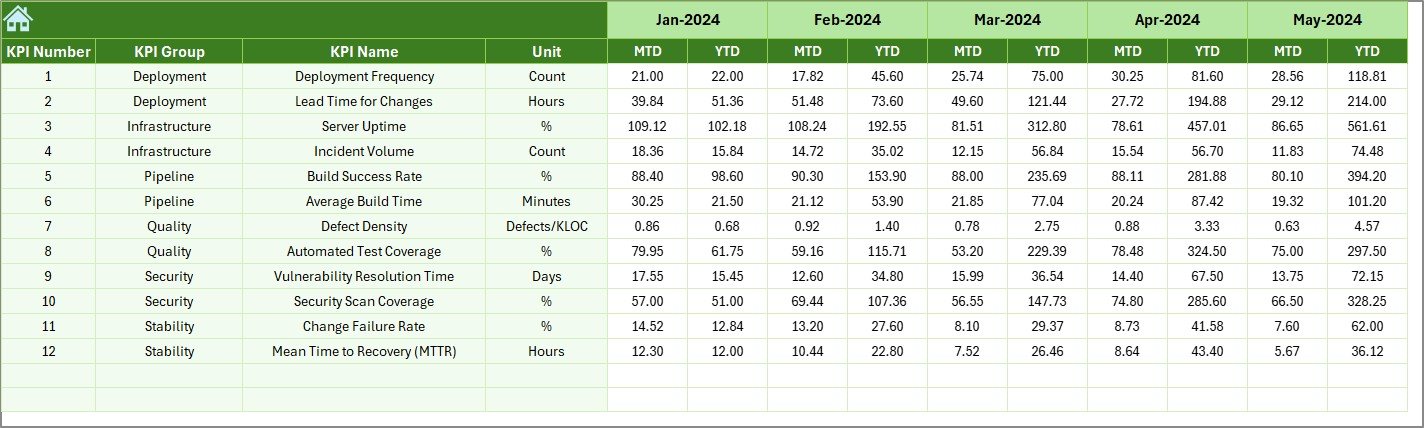
4️⃣ Actual Numbers Input Sheet – Where Do You Enter Data?
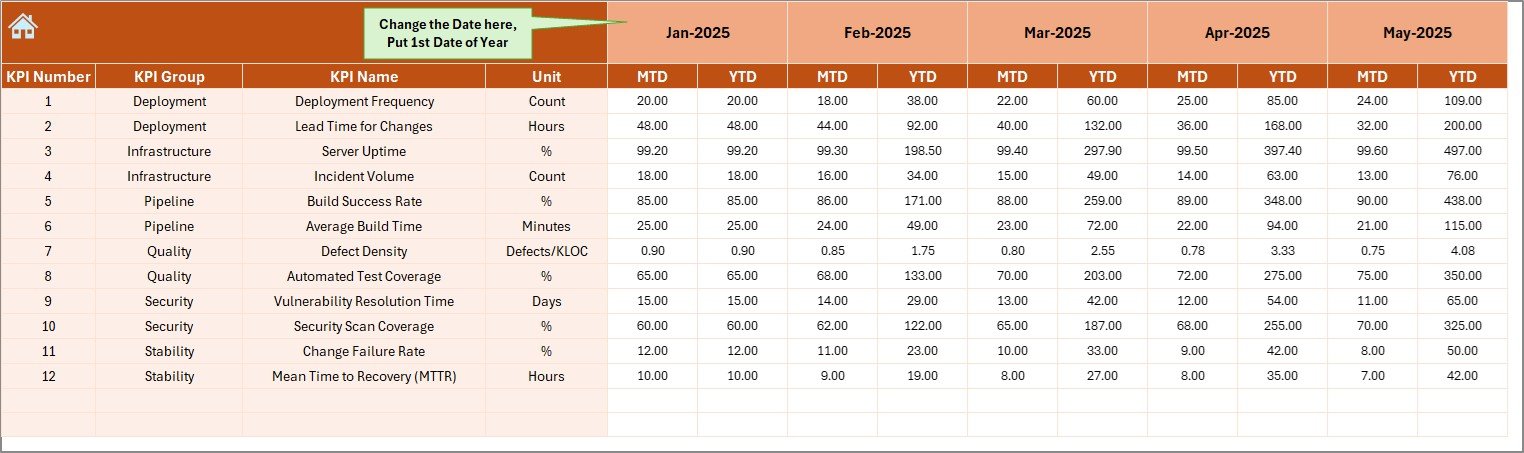
The Actual Numbers Input Sheet allows you to enter real performance data.
You can:
-
Change the month from cell E1
-
Enter MTD values
-
Enter YTD values
Because you control the data here, the dashboard reflects real operational performance.
5️⃣ Target Sheet – How Do You Set Performance Goals?
The Target Sheet stores monthly KPI targets.
You must enter:
-
MTD Target values
-
YTD Target values
As a result, the dashboard compares Actual vs Target automatically.
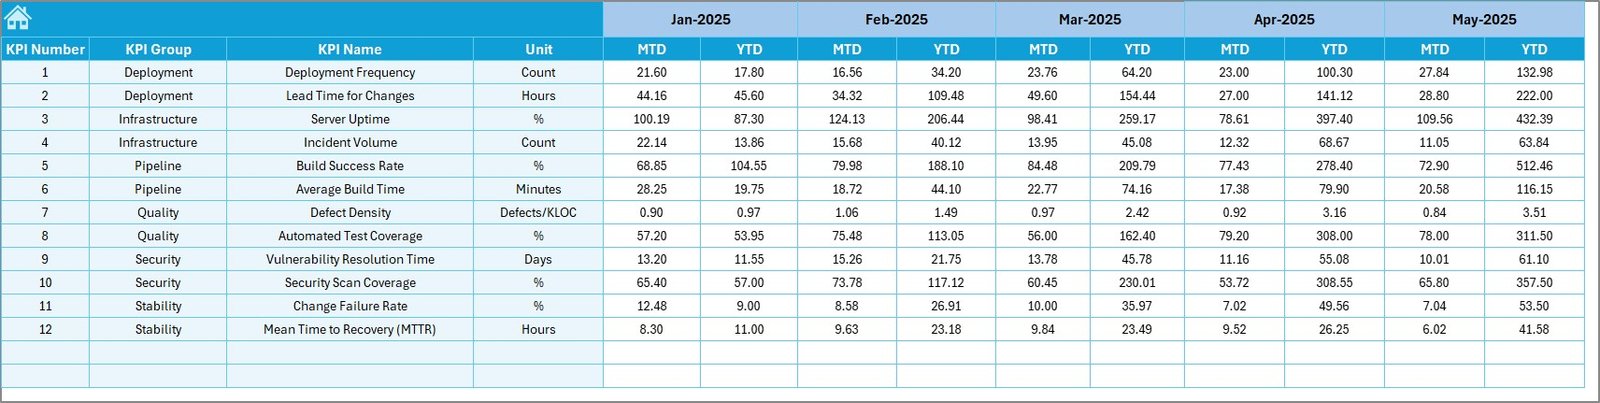
6️⃣ Previous Year Numbers Sheet – Why Compare Historical Data?
This sheet contains previous year data.
When you enter historical values, the dashboard compares:
-
Current Year vs Previous Year
-
Performance growth or decline
-
Long-term improvement trends
Therefore, leaders gain historical context.
Click to Purchases DevOps Teams KPI Dashboard in Excel
7️⃣ KPI Definition Sheet – Why Is Documentation Important?
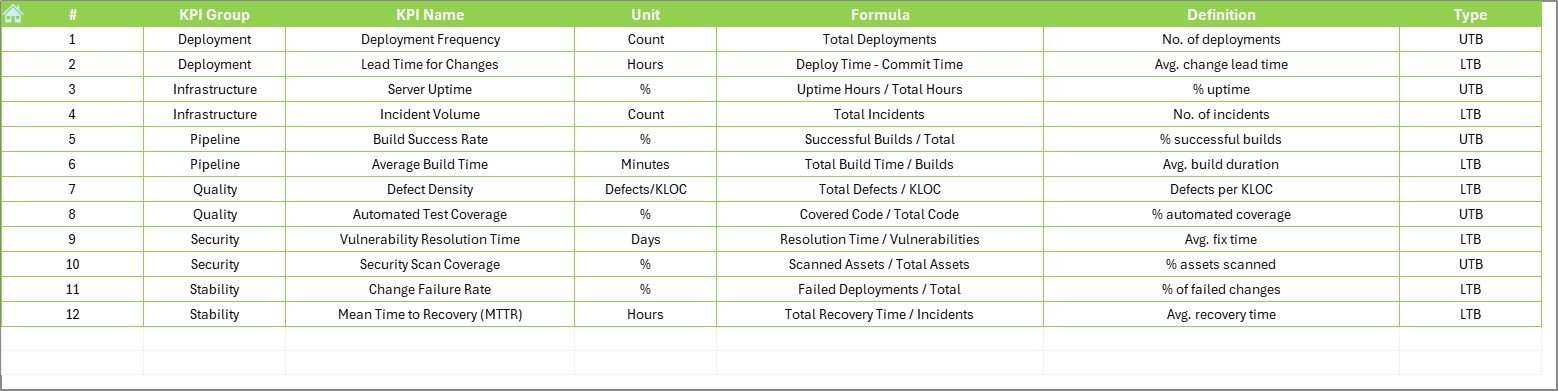
The KPI Definition Sheet stores:
-
KPI Name
-
KPI Group
-
Unit
-
Formula
-
Definition
Because documentation remains centralized, everyone understands how KPIs work.
What KPIs Should DevOps Teams Track?
Although every organization differs, most DevOps teams track the following KPIs:
Deployment & Release Metrics
-
Deployment Frequency
-
Lead Time for Changes
-
Change Failure Rate
-
Release Success Rate
Reliability Metrics
-
System Uptime %
-
Mean Time to Recovery (MTTR)
-
Incident Resolution Time
Quality Metrics
-
Defect Leakage Rate
-
Build Success Rate
-
Automated Test Coverage %
Productivity Metrics
-
Story Completion Rate
-
Sprint Velocity
-
Pipeline Efficiency
By tracking these KPIs, teams improve performance continuously.
Click to Purchases DevOps Teams KPI Dashboard in Excel
Advantages of DevOps Teams KPI Dashboard in Excel
Now let us discuss the real benefits.
1️⃣ Improves Visibility
The dashboard centralizes all DevOps metrics in one place. Therefore, leaders no longer search multiple files.
2️⃣ Enables Faster Decisions
Because you see performance instantly, you can act quickly.
3️⃣ Tracks Performance Trends
Trend charts help identify patterns early. As a result, teams prevent risks.
4️⃣ Increases Accountability
When KPIs stay visible, teams take ownership.
5️⃣ Reduces Reporting Time
Instead of preparing monthly reports manually, Excel generates insights automatically.
6️⃣ Supports Data-Driven Culture
The dashboard encourages teams to rely on measurable data rather than assumptions.
How Does This Dashboard Improve DevOps Performance?
The dashboard improves performance in several ways:
-
It highlights bottlenecks
-
It shows release delays
-
It tracks downtime
-
It measures code quality
-
It compares growth year over year
Because teams can visualize progress, they can adjust strategies faster.
Best Practices for the DevOps Teams KPI Dashboard
To maximize results, follow these best practices:
✅ Define Clear KPIs
Select KPIs aligned with business goals.
✅ Update Data Monthly
Enter data consistently to maintain accuracy.
✅ Review Trends Regularly
Analyze both MTD and YTD charts to identify patterns.
✅ Avoid Too Many KPIs
Focus on high-impact metrics.
✅ Align Targets Realistically
Set achievable goals to motivate teams.
✅ Share Dashboard with Stakeholders
Transparency builds trust and collaboration.
Who Should Use This Dashboard?
This dashboard helps:
-
DevOps Managers
-
CTOs
-
Engineering Directors
-
Product Owners
-
IT Operations Teams
Moreover, startups and enterprises can both use it effectively.
Click to Purchases DevOps Teams KPI Dashboard in Excel
How to Implement the DevOps KPI Dashboard Successfully?
Follow these steps:
-
Define KPIs
-
Collect historical data
-
Set targets
-
Input monthly actual numbers
-
Review results
-
Conduct improvement meetings
Because structured implementation matters, consistency drives success.
Conclusion
DevOps teams operate in a fast-paced environment. They must balance speed, quality, and stability. However, without measurement, performance remains unclear.
The DevOps Teams KPI Dashboard in Excel provides clarity, structure, and actionable insights. It centralizes data, compares performance, and tracks trends visually.
If you want to improve deployment speed, reduce downtime, and increase team accountability, this dashboard gives you the tools to succeed.
Click to Purchases DevOps Teams KPI Dashboard in Excel
Frequently Asked Questions with Answers
1. What is a DevOps KPI Dashboard?
A DevOps KPI Dashboard tracks performance metrics such as deployment frequency, uptime, and failure rate in one structured view.
2. Can I customize the KPIs?
Yes. You can modify KPI names, formulas, and targets based on your organization’s needs.
3. Does the dashboard support MTD and YTD analysis?
Yes. It shows both Month-to-Date and Year-to-Date comparisons.
4. How often should I update the data?
You should update data monthly for accurate reporting.
5. Do I need advanced Excel skills?
No. The template uses simple dropdowns and structured input sheets.
6. Why should I compare with previous year data?
Previous year comparison helps you measure growth and long-term improvement.
Click to Purchases DevOps Teams KPI Dashboard in Excel
Visit our YouTube channel to learn step-by-step video tutorials