Modern cities grow fast. However, growth creates pressure on roads, bridges, utilities, housing, and public systems. Therefore, city planners must track costs, progress, inspection scores, and regional performance in real time. Without structured tracking, projects face delays, cost overruns, and poor coordination.
So, how can municipalities and infrastructure companies monitor urban development efficiently?
The answer is simple.
You need an Urban Infrastructure Dashboard in Excel.
Click to Purchases Urban Infrastructure Dashboard in Excel
This ready-to-use Excel dashboard helps you track project costs, labor allocation, material usage, equipment expenses, inspection scores, and budget performance in one centralized system. Moreover, it provides interactive slicers and visual charts that make decision-making faster and easier.
In this complete guide, you will learn:
-
What an Urban Infrastructure Dashboard in Excel is
-
Why cities and infrastructure firms need it
-
Detailed explanation of all 5 dashboard pages
-
How the Support and Data sheets work
-
Key metrics tracked in the dashboard
-
Advantages of the Urban Infrastructure Dashboard in Excel
-
Best Practices for the Urban Infrastructure Dashboard in Excel
-
Frequently Asked Questions with Answers
Let us explore everything step by step.
What Is an Urban Infrastructure Dashboard in Excel?
An Urban Infrastructure Dashboard in Excel is a structured and interactive reporting tool that tracks infrastructure project performance using organized data and dynamic charts.
Instead of reviewing multiple reports, you can:
-
Monitor project costs instantly
-
Compare budget vs actual expenses
-
Track labor and material usage
-
Evaluate inspection scores
-
Analyze regional and monthly trends
Moreover, the dashboard uses Excel features like slicers, pivot tables, and interactive charts. Therefore, you can filter data by region, project manager, infrastructure type, or month with just one click.
As a result, city administrators and infrastructure companies gain complete visibility into their projects.
Why Do Cities and Infrastructure Firms Need This Dashboard?
Urban infrastructure projects involve:
-
High capital investment
-
Multiple stakeholders
-
Tight deadlines
-
Strict quality standards
However, without centralized tracking, managers struggle to see the full picture. Consequently, they react late to problems.
This dashboard solves that issue because:
-
It centralizes all project data
-
It compares budget vs actual cost
-
It highlights performance gaps
-
It tracks inspection scores clearly
-
It improves accountability
Therefore, decision-makers can take action before problems escalate.
What Are the Key Features of the Urban Infrastructure Dashboard in Excel?
The dashboard includes powerful features that simplify analysis.
Page Navigator
Located on the left side, the Page Navigator allows smooth movement across different analytical pages. Instead of scrolling through sheets manually, you can switch pages instantly.
This feature improves usability and saves time.
What Are the 5 Dashboard Pages?
The Excel dashboard includes five analytical pages. Each page focuses on a specific dimension of infrastructure performance.
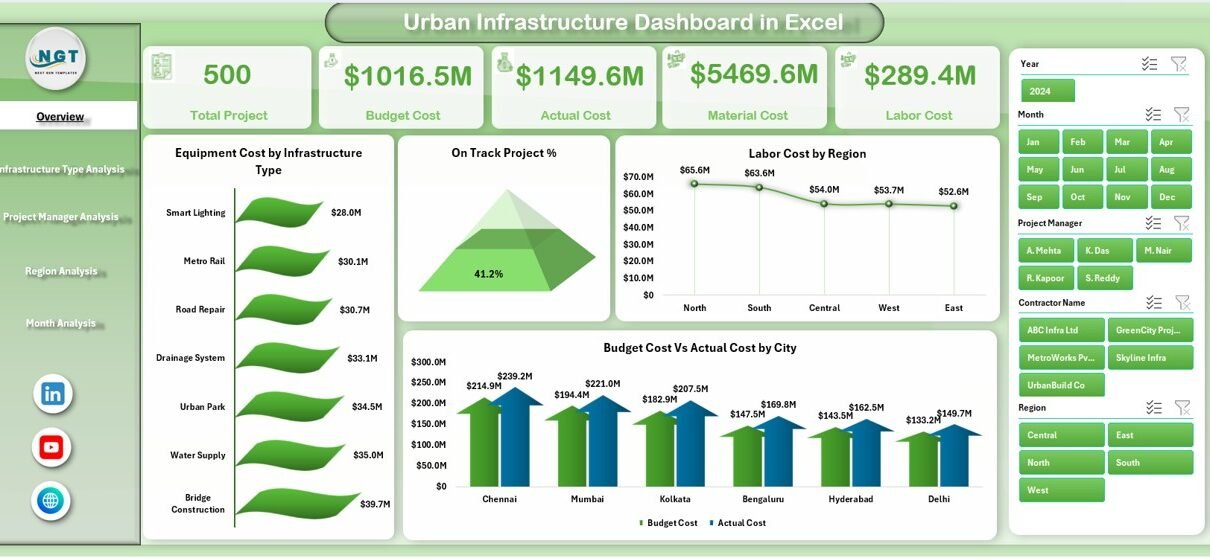
1️⃣ Overview Page – What Does It Show?
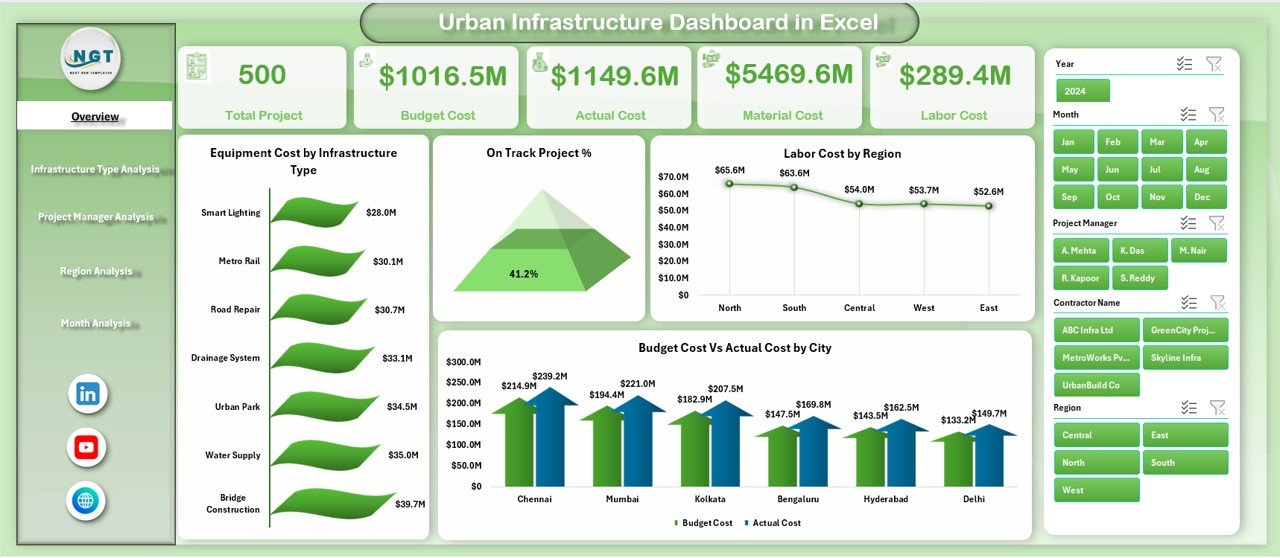
The Overview Page acts as the central command center.
On the right side, you will find interactive slicers. These slicers allow filtering by criteria such as:
-
Region
-
Infrastructure Type
-
Project Manager
-
Month
Additionally, the page includes 4 KPI Cards that highlight critical summary metrics.
Charts Available on the Overview Page:
-
Equipment Cost by Infrastructure Type
-
On-Track Project %
-
Labor Cost by Region
-
Budget Cost vs Actual Cost by City
Because this page summarizes major KPIs, managers can quickly evaluate overall performance.
Click to Purchases Urban Infrastructure Dashboard in Excel
For example:
-
If actual cost exceeds budget in a city, you can detect it immediately.
-
If on-track project percentage drops, you can investigate delays.
2️⃣ Infrastructure Type Analysis – Why Is It Important?
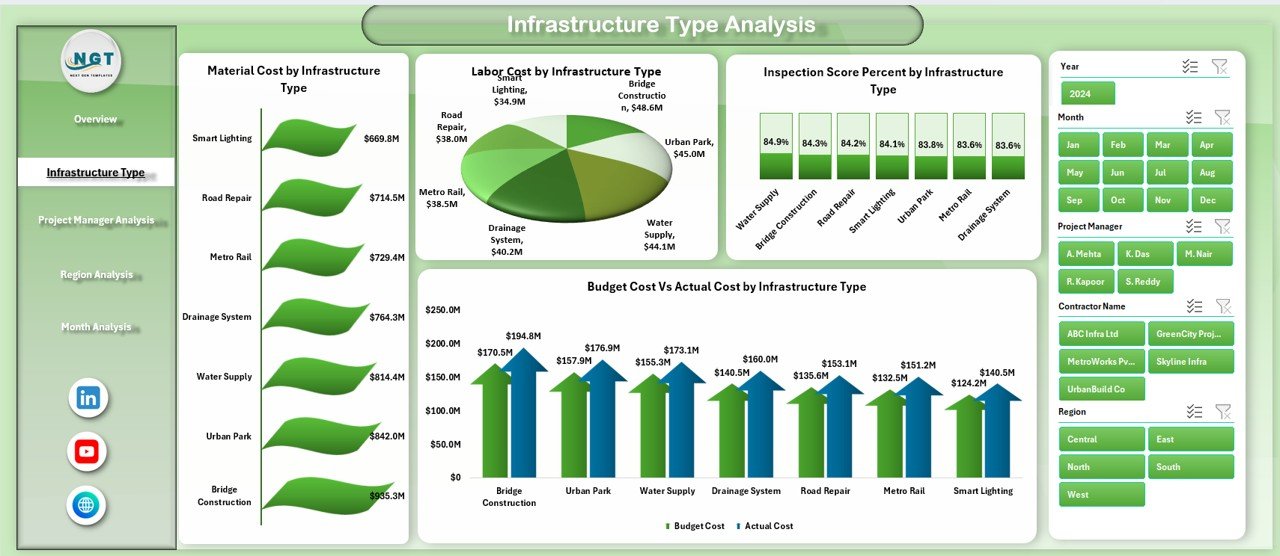
Infrastructure projects vary by type, such as:
-
Roads
-
Bridges
-
Utilities
-
Public Buildings
-
Transit Systems
Therefore, analyzing each type separately improves planning accuracy.
Charts Included:
-
Labor by Infrastructure Type
-
Material Cost by Infrastructure Type
-
Inspection Score % by Infrastructure Type
-
Budget Cost vs Actual Cost by Infrastructure Type
This page helps managers:
-
Identify high-cost infrastructure categories
-
Evaluate inspection quality levels
-
Detect budget overruns by type
As a result, they can allocate resources more efficiently.
3️⃣ Project Manager Analysis – How Does It Improve Accountability?
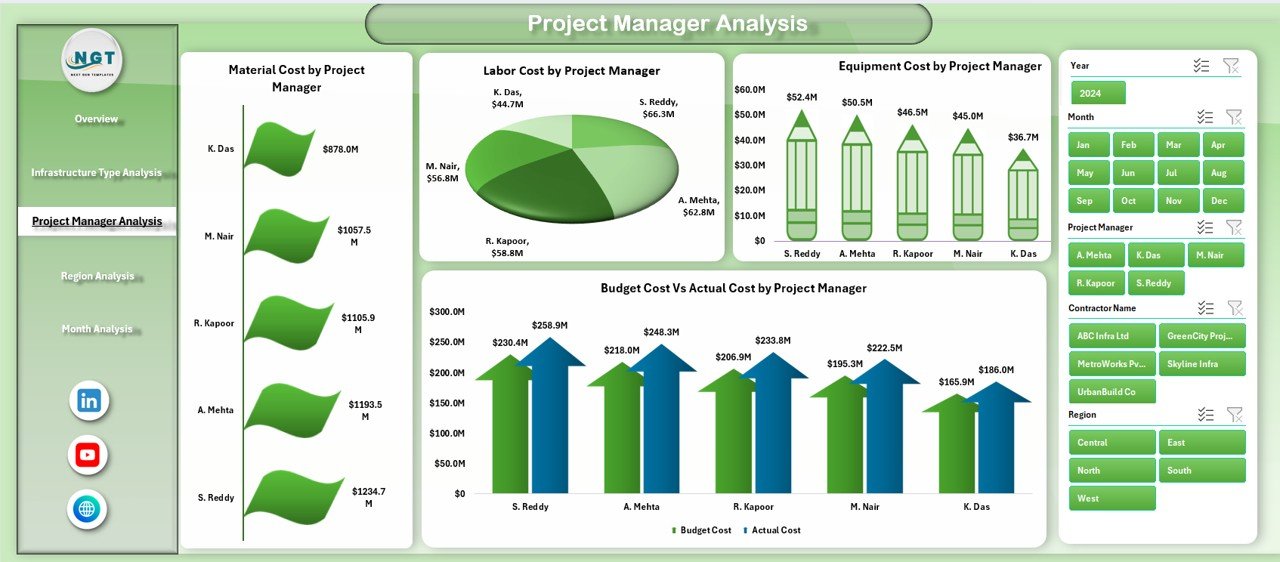
Project success depends heavily on leadership. Therefore, performance analysis by project manager ensures transparency.
Charts Available:
-
Labor by Project Manager
-
Material Cost by Project Manager
-
Equipment Cost by Project Manager
-
Budget Cost vs Actual Cost by Project Manager
This page enables you to:
-
Compare managerial performance
-
Identify cost control strengths
-
Detect budget variance issues
-
Encourage accountability
Consequently, organizations improve operational discipline.
Click to Purchases Urban Infrastructure Dashboard in Excel
4️⃣ Region Analysis – Why Should You Track Regional Performance?
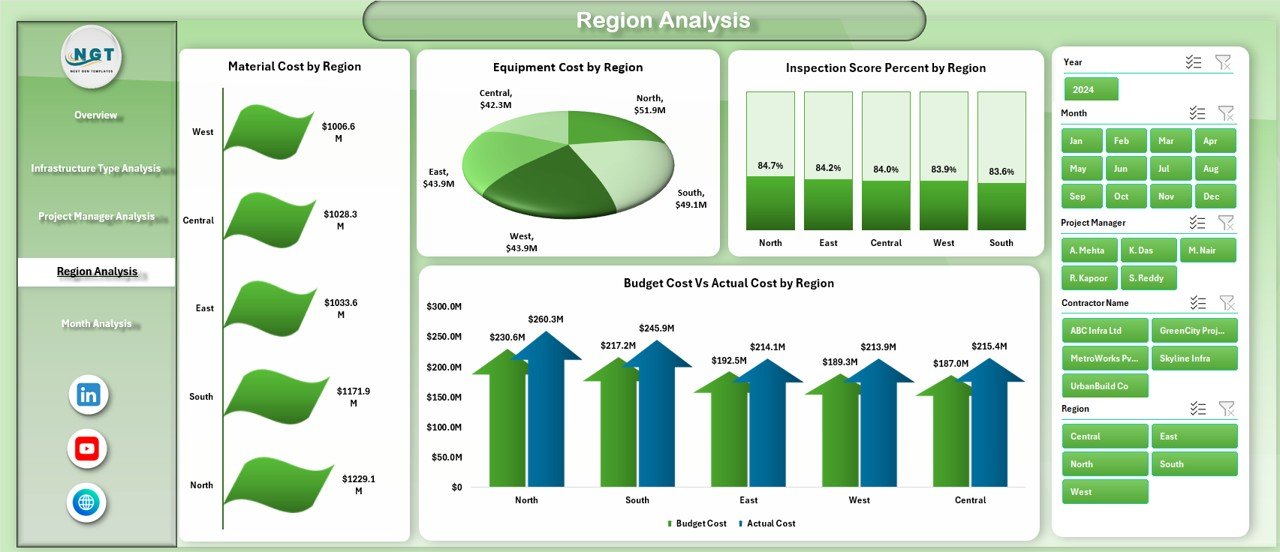
Cities often operate across multiple regions or zones. However, performance differs by region due to:
-
Labor availability
-
Material supply
-
Local regulations
-
Environmental conditions
Charts Included:
-
Inspection Score % by Region
-
Material Cost by Region
-
Equipment Cost by Region
-
Budget Cost vs Actual Cost by Region
This page provides insights into regional strengths and weaknesses. Therefore, planners can adjust strategy region-wise.
5️⃣ Month Analysis – How Does Monthly Tracking Help?
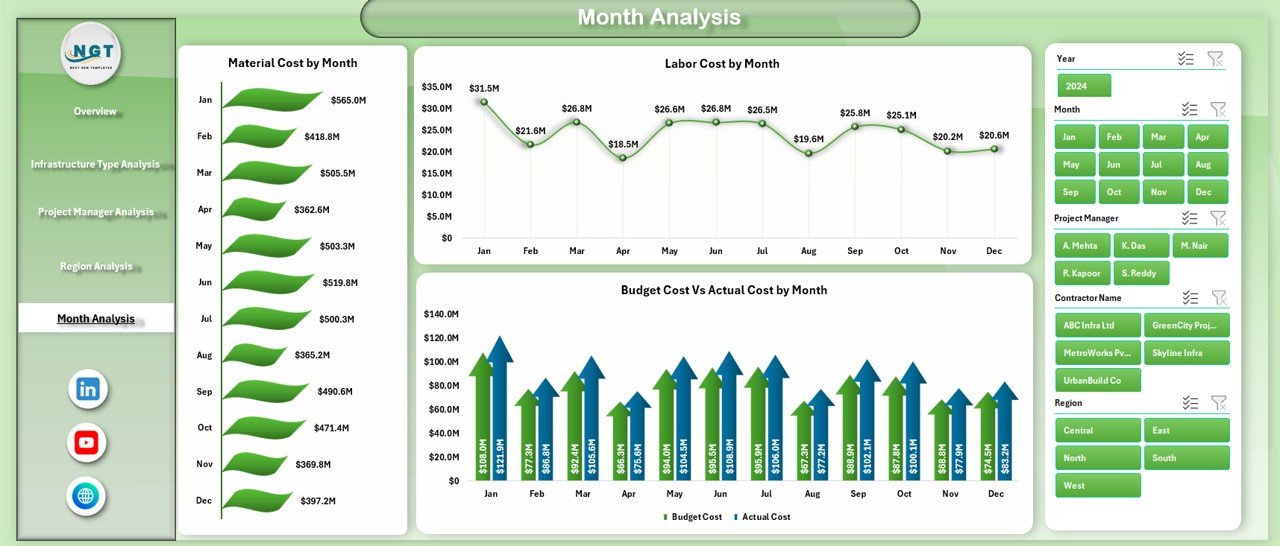
Infrastructure projects extend over several months or years. Therefore, monthly monitoring plays a critical role.
Charts Included:
-
Material Cost by Month
-
Labor Cost by Month
-
Budget Cost vs Actual Cost by Month
This page helps you:
-
Track spending trends
-
Identify seasonal cost spikes
-
Monitor budget variance month by month
Consequently, you maintain tighter financial control.
What Is the Role of the Support Sheet?
The Support Sheet stores:
-
Pivot table calculations
-
Backend formulas
-
Chart data references
It keeps the dashboard clean while managing complex calculations behind the scenes.
Therefore, users only see meaningful insights, not raw formulas.
What Is Included in the Data Sheet?
The Data Sheet acts as the primary input source.
It contains structured columns such as:
-
Project ID
-
City
-
Region
-
Infrastructure Type
-
Project Manager
-
Budget Cost
-
Actual Cost
-
Labor Cost
-
Material Cost
-
Equipment Cost
-
Inspection Score %
-
Project Status
-
Month
You only need to update this sheet regularly. After updating, the dashboard refreshes automatically.
What Are the Key Metrics Tracked?
The Urban Infrastructure Dashboard tracks:
-
Budget Cost
-
Actual Cost
-
Labor Cost
-
Material Cost
-
Equipment Cost
-
Inspection Score %
-
On-Track Project %
These KPIs help measure:
-
Financial performance
-
Operational efficiency
-
Quality control
-
Timeline adherence
Advantages of Urban Infrastructure Dashboard in Excel
Click to Purchases Urban Infrastructure Dashboard in Excel
Every organization benefits from structured monitoring. However, this dashboard offers specific advantages.
1. Centralized Data Management
You manage all infrastructure projects in one Excel file.
2. Real-Time Insights
As soon as you update data, charts reflect new results.
3. Improved Budget Control
You compare budget vs actual cost easily.
4. Better Accountability
You analyze performance by project manager.
5. Regional Visibility
You identify region-wise performance gaps.
6. Quality Monitoring
You track inspection score percentages clearly.
7. Cost Optimization
You monitor labor, material, and equipment expenses.
8. Easy Customization
You can add new KPIs or charts anytime.
9. User-Friendly Design
The page navigator simplifies movement across sheets.
10. No Advanced Software Required
You only need Microsoft Excel.
Best Practices for the Urban Infrastructure Dashboard in Excel
To maximize benefits, follow these best practices:
1. Maintain Clean Data
Always enter consistent data formats.
2. Update Data Monthly
Regular updates ensure accurate trends.
3. Validate Budget Figures
Double-check budget entries before analysis.
4. Use Data Validation
Restrict manual entry errors.
5. Standardize KPI Definitions
Ensure every team understands KPI calculations.
6. Monitor Variance Regularly
Act immediately when actual cost exceeds budget.
7. Train Users
Provide guidance on slicers and filters.
8. Back Up Data
Save backup copies regularly.
9. Automate Where Possible
Use formulas instead of manual calculations.
10. Review Performance Quarterly
Conduct quarterly reviews using dashboard insights.
How Does This Dashboard Improve Decision-Making?
This dashboard enhances decision-making because:
-
It reduces reporting time
-
It highlights risk areas instantly
-
It improves transparency
-
It supports data-driven planning
-
It strengthens financial discipline
Therefore, leaders can make informed decisions confidently.
Conclusion
Urban infrastructure projects demand precision, coordination, and financial control. However, manual tracking creates confusion and delays.
The Urban Infrastructure Dashboard in Excel solves these challenges by providing:
-
Centralized monitoring
-
Interactive analysis
-
Budget control
-
Regional insights
-
Monthly trend tracking
Moreover, it simplifies complex project data into clear visual insights.
If you manage infrastructure projects, city planning operations, or public works departments, this dashboard will significantly improve your control and efficiency.
Now is the time to upgrade from scattered reports to structured performance tracking.
Frequently Asked Questions with Answers
1. What software do I need to use this dashboard?
You only need Microsoft Excel (2016 or later version recommended).
2. Can I customize the dashboard?
Yes. You can add new KPIs, charts, or filters based on your project needs.
3. How often should I update the data?
You should update data monthly for accurate analysis.
4. Can this dashboard handle multiple cities?
Yes. You can track multiple cities, regions, and infrastructure types.
5. Does the dashboard update automatically?
Yes. Once you update the Data Sheet, pivot tables and charts refresh.
6. Can small municipalities use this dashboard?
Absolutely. Both small and large organizations can use it.
7. Can I track inspection quality?
Yes. The dashboard includes Inspection Score % tracking.
8. Does it support budget variance analysis?
Yes. It clearly shows Budget vs Actual Cost comparisons.
Visit our YouTube channel to learn step-by-step video tutorials