In today’s fast-moving business world, companies must track financial performance with clarity and speed. However, many organizations still depend on scattered Excel sheets and manual reports. As a result, finance teams struggle to monitor revenue, expenses, assets, liabilities, unpaid invoices, and tax amounts in one centralized system.So, how can businesses gain full financial visibility in real time?You need a Finance and Accounting Dashboard in Power BI.This ready-to-use Power BI dashboard helps finance managers, accountants, CFOs, and business owners monitor financial performance through interactive visuals, slicers, and dynamic reports. Moreover, it converts raw accounting data into meaningful insights. Consequently, you make faster decisions, reduce risks, and improve financial control.
In this detailed guide, you will learn:
- What a Finance and Accounting Dashboard in Power BI is
- Why businesses need financial KPI tracking
- Detailed explanation of all 5 dashboard pages
- Important KPIs included in the dashboard
- Advantages of Finance and Accounting Dashboard in Power BI
- Best Practices for Finance and Accounting Dashboard in Power BI
- Frequently Asked Questions with Answers
Click to buy Finance and Accounting Dashboard in Power BI
What Is a Finance and Accounting Dashboard in Power BI?
A Finance and Accounting Dashboard in Power BI is an interactive reporting tool that helps businesses track financial performance using real-time visuals and KPIs.
Instead of reviewing multiple spreadsheets, you can monitor:
- Revenue amount
- Expense amount
- Asset amount
- Liability amount
- Paid invoice percentage
- Overdue invoices
- Unpaid invoices
- Tax amounts
- Department-wise performance
- Region-wise financial data
Because the dashboard runs in Power BI, it allows dynamic filtering using slicers. Therefore, users can analyze data by department, region, and time period instantly.
As a result, you gain complete financial transparency.
Why Do Businesses Need a Finance and Accounting Dashboard?
Every business generates financial data daily. However, data alone does not create value. You must analyze and interpret it properly.
Without a structured dashboard:
- Teams waste time creating manual reports.
- Leaders miss early warning signals.
- Finance managers struggle to track unpaid invoices.
- Decision-makers delay strategic actions.
On the other hand, a Power BI dashboard gives you:
- Real-time financial insights
- Department-level visibility
- Region-based comparison
- Monthly performance tracking
- Better cash flow management
Therefore, companies that use financial dashboards make smarter decisions faster.
Detailed Explanation of All 5 Pages of Finance and Accounting Dashboard in Power BI
Now let us understand each page of the dashboard clearly.
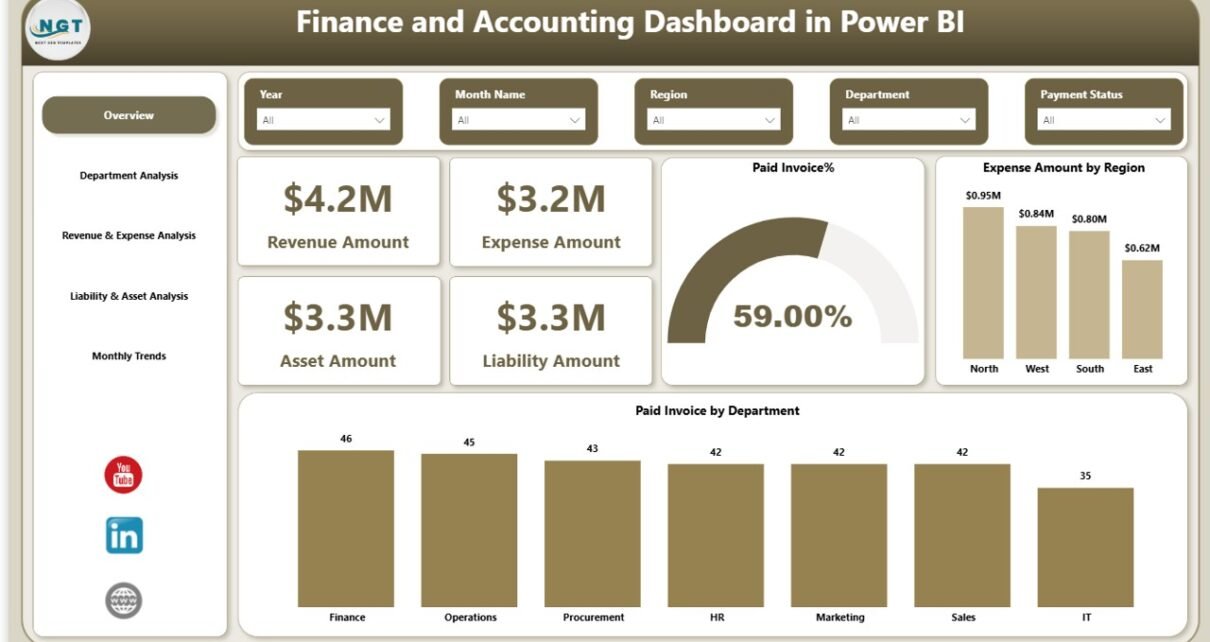
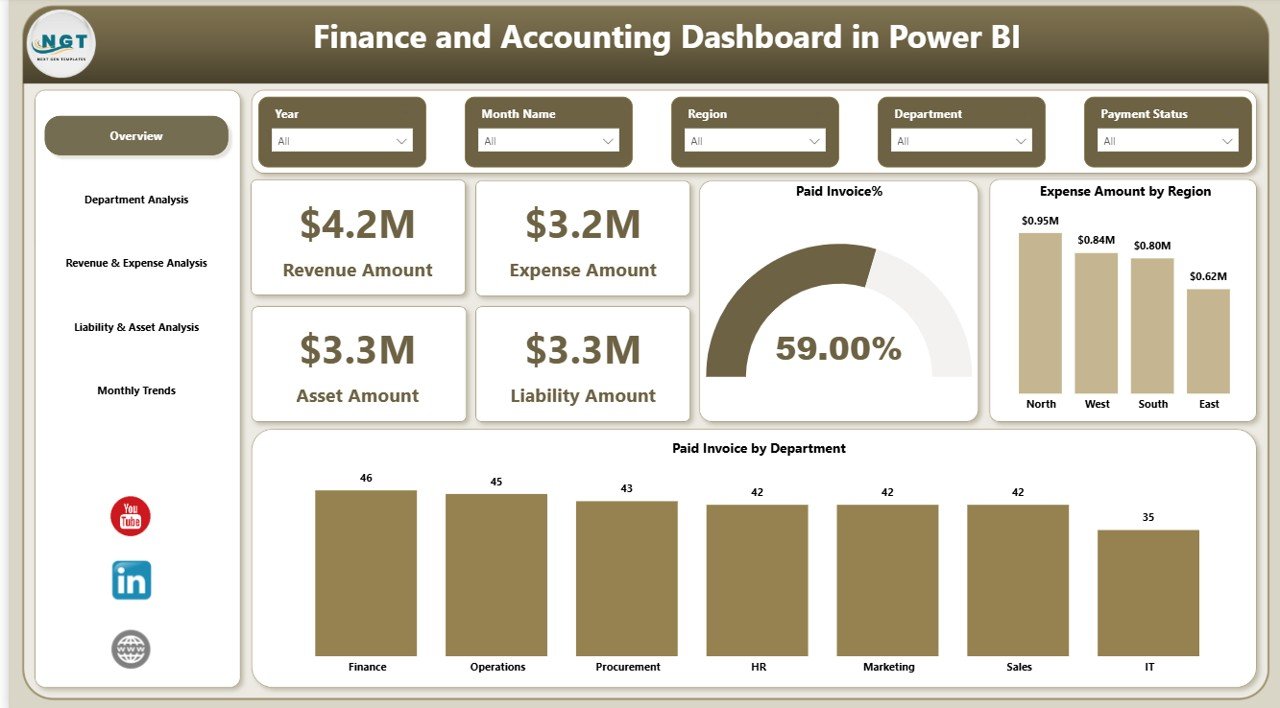
Overview Page – How Do You Monitor Overall Financial Health?
The Overview Page acts as the main page of the dashboard. It provides a complete snapshot of financial performance.
Key KPI Cards on Overview Page
This page includes four important KPI cards:
- Revenue Amount
- Expense Amount
- Asset Amount
- Liability Amount
These cards instantly show the overall financial position of the company.
Charts on Overview Page
The page includes three important charts:
- Paid Invoice % – Shows how much of total invoices customers have paid.
- Expense Amount by Region – Helps compare operational cost across regions.
- Paid Invoice by Department – Identifies which department collects payments efficiently.
Slicers Available
You can use slicers to filter data by:
- Department
- Region
- Time period
Therefore, the Overview Page helps decision-makers quickly assess financial stability.
Click to buy Finance and Accounting Dashboard in Power BI
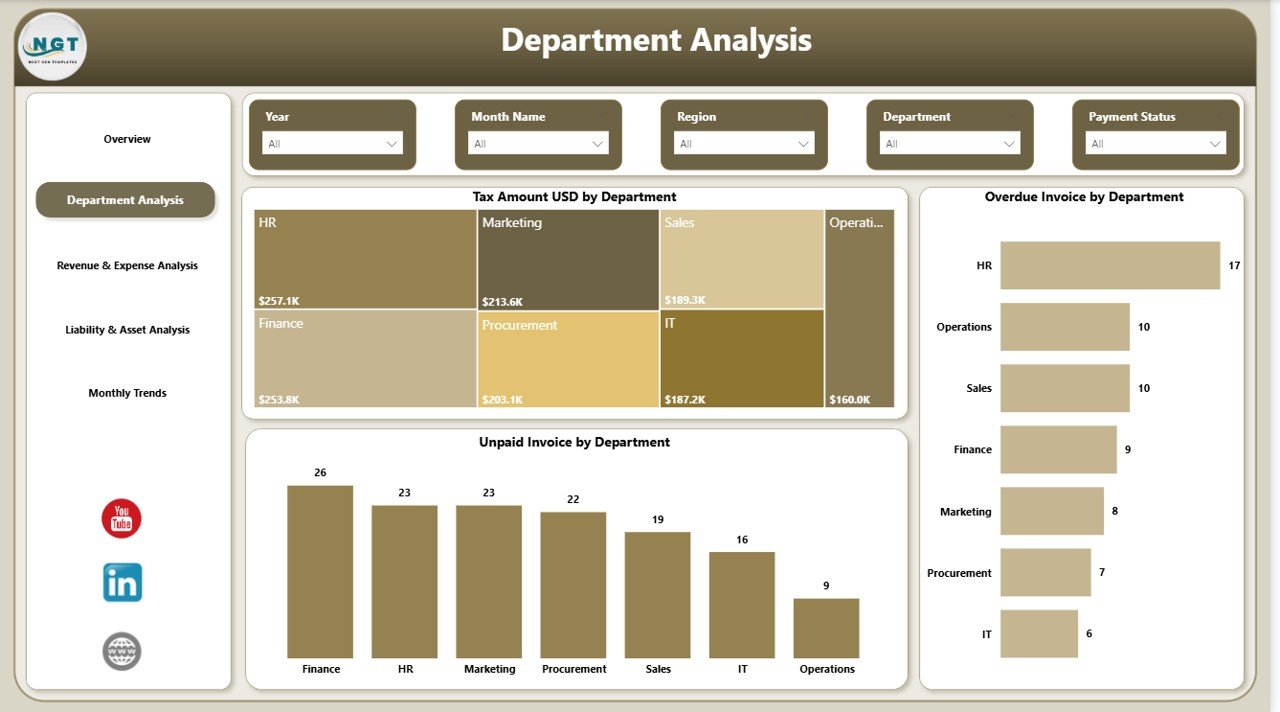
Department Analysis – Which Departments Perform Better?
The Department Analysis Page provides deeper financial insights at the department level.
Charts on Department Analysis Page
- Tax Amount (USD) by Department
- Overdue Invoice by Department
- Unpaid Invoice by Department
Why Does This Page Matter?
Because financial issues often originate at the department level. Therefore, this page helps you:
- Identify departments with high unpaid invoices
- Track tax obligations clearly
- Reduce overdue payments
- Improve internal financial discipline
As a result, finance teams can take corrective action quickly.
Click to buy Finance and Accounting Dashboard in Power BI
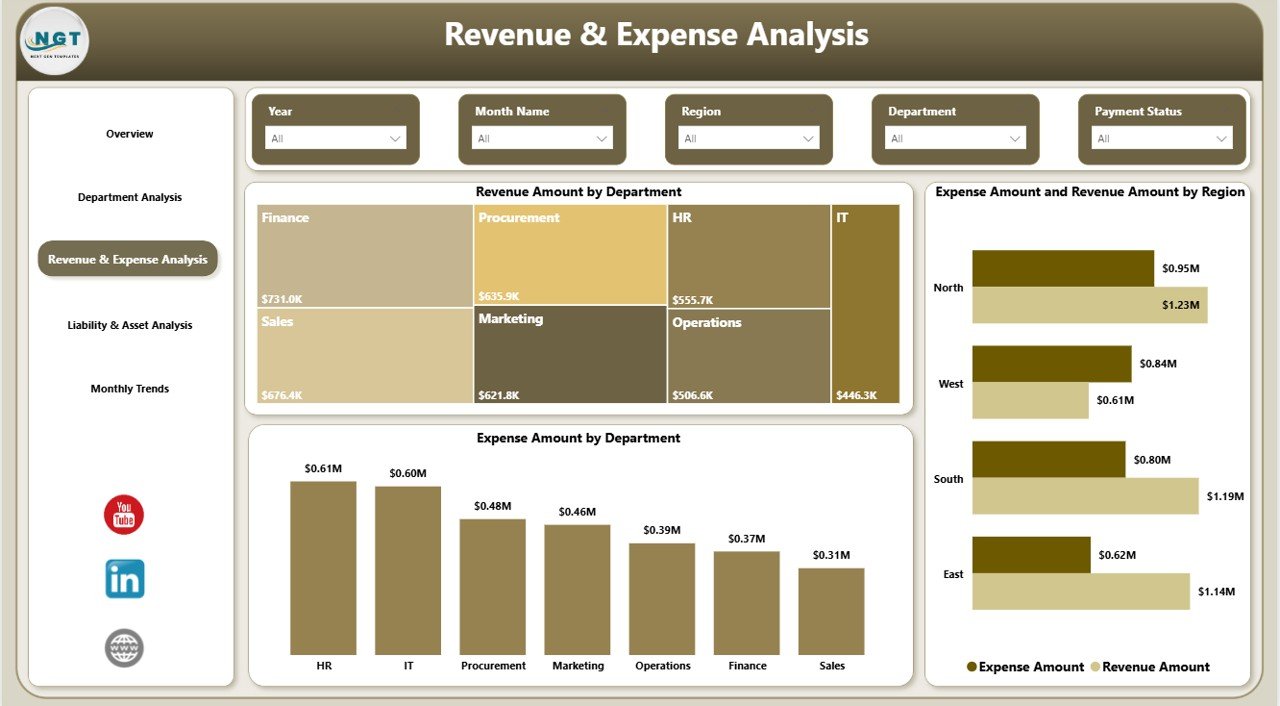
Revenue & Expense Analysis – How Do Revenue and Costs Compare?
The Revenue & Expense Analysis Page helps managers evaluate profitability.
Charts on This Page
- Revenue Amount by Department
- Expense Amount by Department
- Revenue Amount by Region
Why Is This Important?
Revenue growth alone does not guarantee profit. You must compare it with expenses.
With this page, you can:
- Identify profitable departments
- Detect cost-heavy regions
- Improve budget allocation
- Strengthen financial planning
Therefore, this page supports strategic financial management.
Click to buy Finance and Accounting Dashboard in Power BI
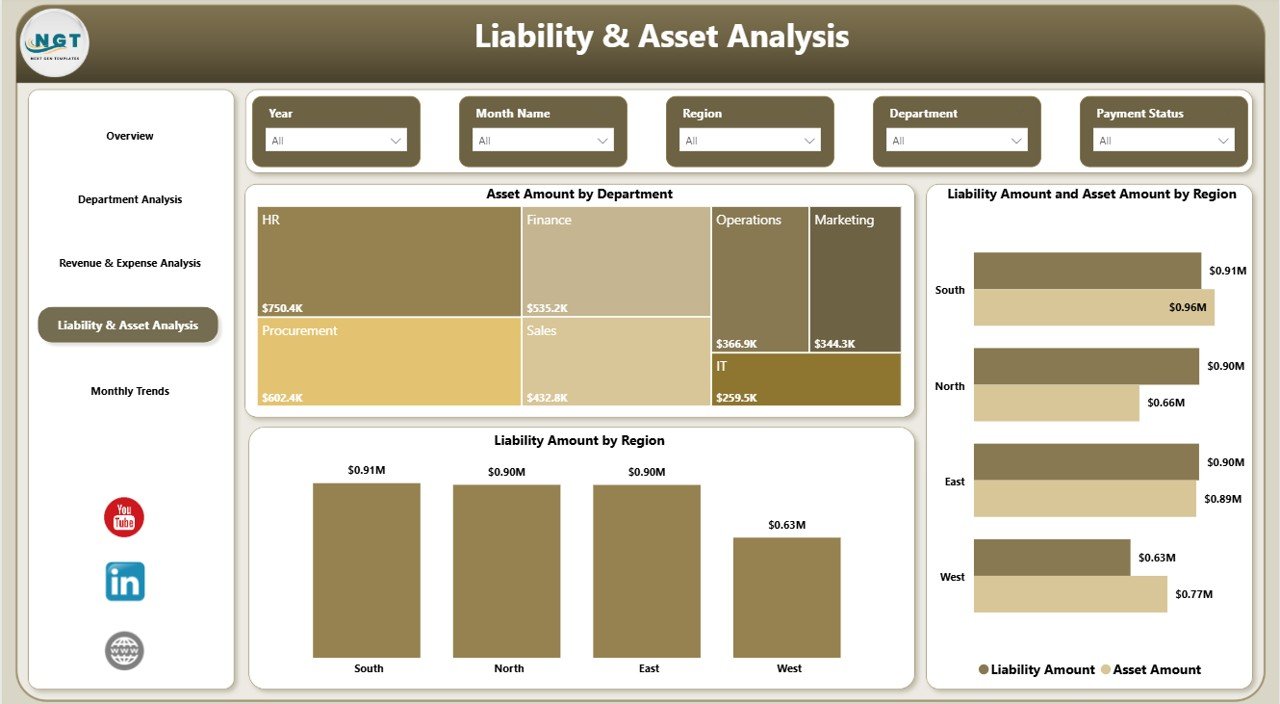
Liability & Asset Analysis – Is Your Company Financially Stable?
The Liability & Asset Analysis Page focuses on financial stability.
Charts Included
- Asset Amount by Department
- Liability Amount by Region
- Liability Amount and Asset Amount by Region
Click to buy Finance and Accounting Dashboard in Power BI
Why Should You Monitor Assets and Liabilities?
Because financial health depends on balance.
This page helps you:
- Track company-owned assets
- Monitor debt obligations
- Compare asset-to-liability ratio
- Improve financial sustainability
As a result, executives can evaluate long-term financial strength.
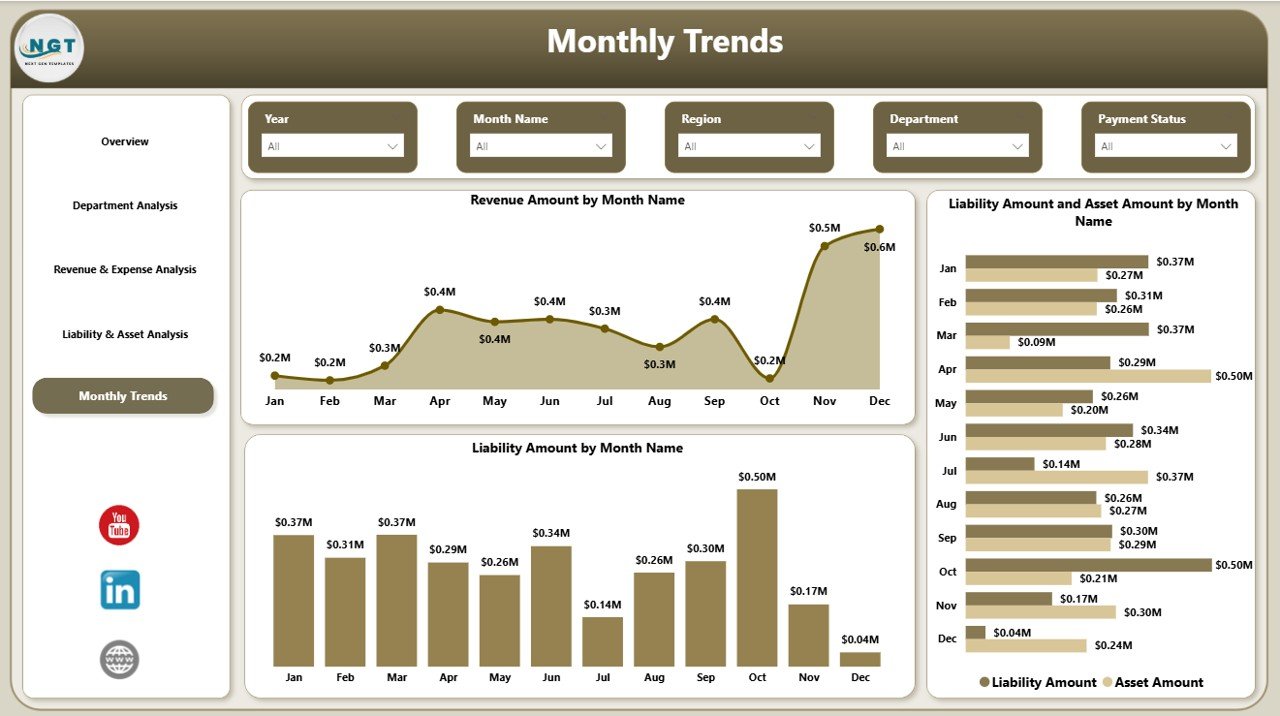
Monthly Trends – How Does Financial Performance Change Over Time?
The Monthly Trends Page shows time-based financial performance.
Charts Available
- Revenue Amount by Month Name
- Liability Amount and Asset Amount by Month Name
- Liability Amount by Month Name
Why Do Monthly Trends Matter?
Because trends reveal patterns.
With this page, you can:
- Detect seasonal revenue patterns
- Identify rising liabilities
- Forecast future performance
- Improve monthly budgeting
Therefore, trend analysis improves financial planning accuracy.
Click to buy Finance and Accounting Dashboard in Power BI
Important KPIs Included in the Finance and Accounting Dashboard
Below are some major KPIs you can track:
- Total Revenue
- Total Expenses
- Net Profit
- Paid Invoice %
- Overdue Invoice Amount
- Unpaid Invoice Amount
- Tax Amount
- Total Assets
- Total Liabilities
- Asset-to-Liability Ratio
Each KPI helps finance teams monitor performance clearly.
Advantages of Finance and Accounting Dashboard in Power BI
Now let us understand why this dashboard adds massive value.
Real-Time Financial Visibility
You can monitor revenue, expenses, assets, and liabilities instantly. Therefore, you avoid reporting delays.
Better Cash Flow Management
You can track unpaid and overdue invoices easily. As a result, you improve collection efficiency.
Department-Level Accountability
Managers can analyze performance by department. Consequently, they increase financial discipline.
Improved Decision-Making
Visual reports simplify complex data. Therefore, leaders make faster strategic decisions.
Centralized Reporting System
Instead of using multiple spreadsheets, you get one unified dashboard.
Easy Data Filtering with Slicers
Users can apply filters instantly. As a result, analysis becomes flexible and dynamic.
Professional Financial Reporting
Power BI provides interactive visuals. Therefore, you can present financial reports confidently in meetings.
Best Practices for Finance and Accounting Dashboard in Power BI
To maximize the value of your dashboard, follow these best practices.
Keep Data Clean and Structured
Always use standardized accounting formats. Remove duplicate records. Maintain consistent department names.
Update Data Regularly
Upload financial data weekly or monthly. Therefore, reports stay accurate.
Define Clear Financial KPIs
Select KPIs that match your business goals. Do not overload the dashboard with unnecessary metrics.
Use Role-Based Access
Provide access based on responsibility. For example, department managers should see their own data.
Monitor Trends Regularly
Review monthly trends consistently. Therefore, you can detect risks early.
Compare Revenue with Expenses
Always analyze profitability instead of revenue alone.
Track Liabilities Carefully
High liabilities increase financial risk. Therefore, monitor them closely.
How Can CFOs and Finance Managers Use This Dashboard Effectively?
CFOs can:
- Evaluate financial stability
- Present reports to stakeholders
- Monitor asset growth
Finance managers can:
- Track unpaid invoices
- Improve tax compliance
- Monitor departmental expenses
Business owners can:
- Understand profit margins
- Identify cost-saving opportunities
- Plan future investments
Therefore, this dashboard supports all financial roles.
How Does Power BI Improve Financial Reporting?
Power BI improves financial reporting because it:
- Connects multiple data sources
- Refreshes reports automatically
- Provides drill-down capability
- Allows interactive slicers
- Supports secure sharing
Consequently, companies move from static reports to intelligent analytics.
Conclusion: Why Should You Use Finance and Accounting Dashboard in Power BI?
Financial clarity drives business success. However, manual reporting creates confusion and delays.
On the other hand, the Finance and Accounting Dashboard in Power BI provides:
- Real-time insights
- Department-level visibility
- Region-based comparison
- Monthly trend analysis
- Asset and liability tracking
Therefore, if you want stronger financial control, smarter decisions, and professional reporting, you should implement this dashboard today.
Frequently Asked Questions with Answers
What is a Finance and Accounting Dashboard in Power BI?
It is an interactive financial reporting tool that tracks revenue, expenses, assets, liabilities, invoices, and taxes in one centralized system.
Who can use this dashboard?
CFOs, finance managers, accountants, department heads, and business owners can use it.
Can I filter data by department and region?
Yes. The dashboard includes slicers that allow dynamic filtering.
Does the dashboard track unpaid invoices?
Yes. It tracks paid invoice percentage, overdue invoices, and unpaid invoices.
How often should I update the data?
You should update the data weekly or monthly for accurate reporting.
Can I customize the dashboard?
Yes. You can modify KPIs, visuals, and filters based on your business needs.
Why should I use Power BI instead of Excel?
Power BI offers advanced visuals, interactive filtering, automatic refresh, and better data modeling.
Visit our YouTube channel to learn step-by-step video tutorials
Watch the step-by-step video tutorial:
Click to buy Finance and Accounting Dashboard in Power BI