In today’s fast-moving legal environment, law firms and corporate legal departments handle hundreds or even thousands of cases simultaneously. However, many organizations still rely on scattered spreadsheets, manual reports, and disconnected systems. As a result, decision-makers struggle to monitor case progress, control legal costs, and evaluate departmental performance effectively.So, how can legal teams track cases, analyze expenses, and make faster strategic decisions using real-time data?The answer is simple — Legal Dashboard in Power BI.This article explains everything you need to know about building and using a Legal Dashboard in Power BI. Moreover, you will learn how this powerful analytics solution transforms legal data into actionable insights, improves operational transparency, and supports smarter legal management decisions.
Click to buy Legal Dashboard in Power BI
What Is a Legal Dashboard in Power BI?
A Legal Dashboard in Power BI is an interactive business intelligence solution designed to monitor legal operations using visual analytics and Key Performance Indicators (KPIs).
Instead of reviewing multiple reports manually, legal managers can view all case-related data in one centralized dashboard. Because Power BI connects data dynamically, teams can analyze performance instantly and identify trends without delays.
In simple words, the dashboard converts complex legal information into clear visuals that help organizations:
- Track total cases and case status
- Monitor legal costs and variance
- Analyze department performance
- Evaluate client-wise case distribution
- Identify monthly trends and workload patterns
As a result, legal teams gain better visibility and stronger control over operations.
Why Do Legal Teams Need a Legal Dashboard?
Legal departments face constant pressure to manage risks while controlling costs. However, traditional reporting methods often create several challenges.
Common Problems Without a Legal Dashboard
- Data exists in multiple spreadsheets
- Case tracking becomes time-consuming
- Cost monitoring lacks accuracy
- Reporting delays slow decision-making
- Managers cannot identify performance trends quickly
Therefore, organizations need a centralized analytics system. A Legal Dashboard in Power BI solves these problems by combining automation, visualization, and real-time reporting.
How Does a Legal Dashboard in Power BI Improve Decision-Making?
When legal data becomes visual and interactive, decision-making improves immediately. Instead of guessing performance outcomes, leaders rely on measurable insights.
For example:
- Managers identify departments handling excessive workloads.
- Finance teams monitor legal spending trends.
- Executives evaluate case success patterns.
- Legal heads allocate resources efficiently.
Consequently, organizations reduce operational risks and improve productivity.
Key Features of the Legal Dashboard in Power BI
This Legal Dashboard includes five interactive pages inside the Power BI Desktop application. Each page focuses on a specific analytical perspective.
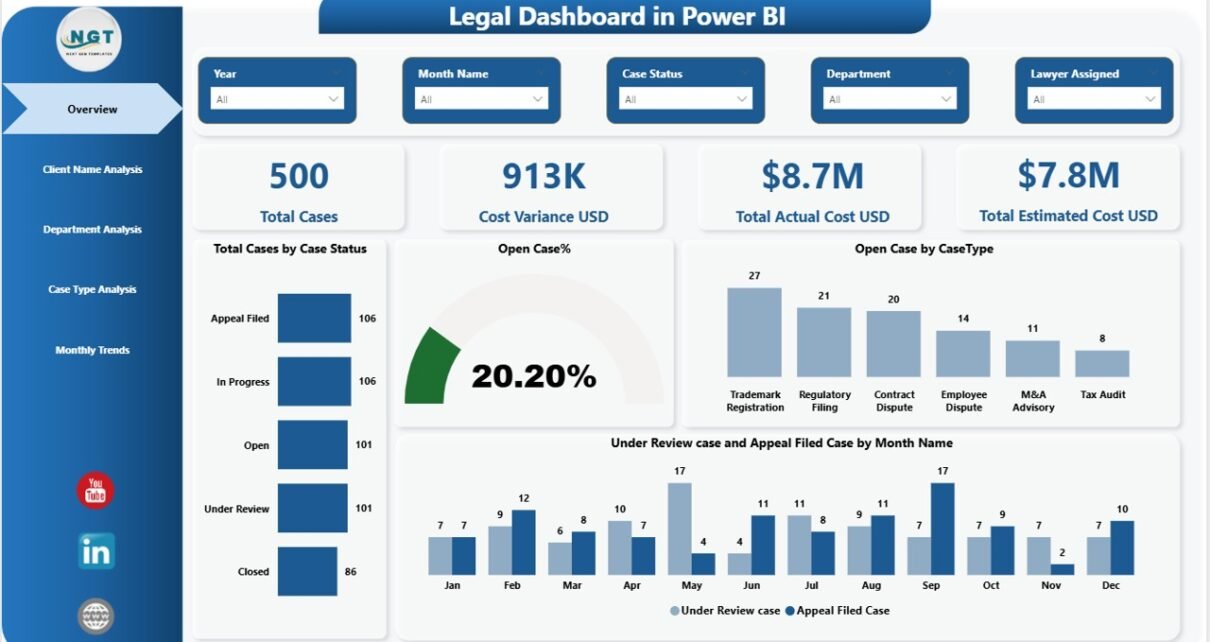
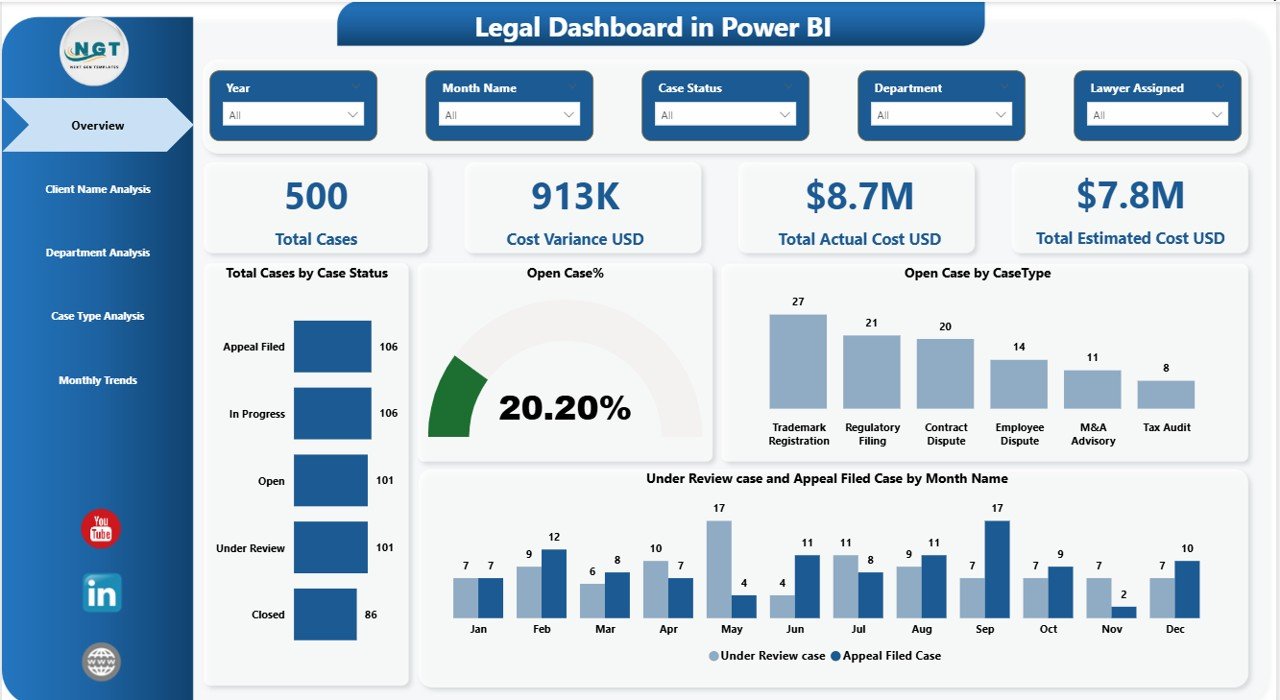
Overview Page – What Is Happening Across All Legal Cases?
The Overview Page acts as the main control center of the dashboard. It provides a quick snapshot of legal performance.
KPI Cards Included
- Total Cases
- Cost Variance (USD)
- Total Actual Cost (USD)
- Total Estimated Cost (USD)
These cards instantly show operational health. Therefore, managers understand performance without opening multiple reports.
Charts Available
- Total Cases by Case Status
- Open Case Percentage
- Open Cases by Case Type
- Under Review Cases and Appeal Filed Cases by Month Name
Because slicers allow dynamic filtering, users can analyze data based on selected conditions quickly.
Click to buy Legal Dashboard in Power BI
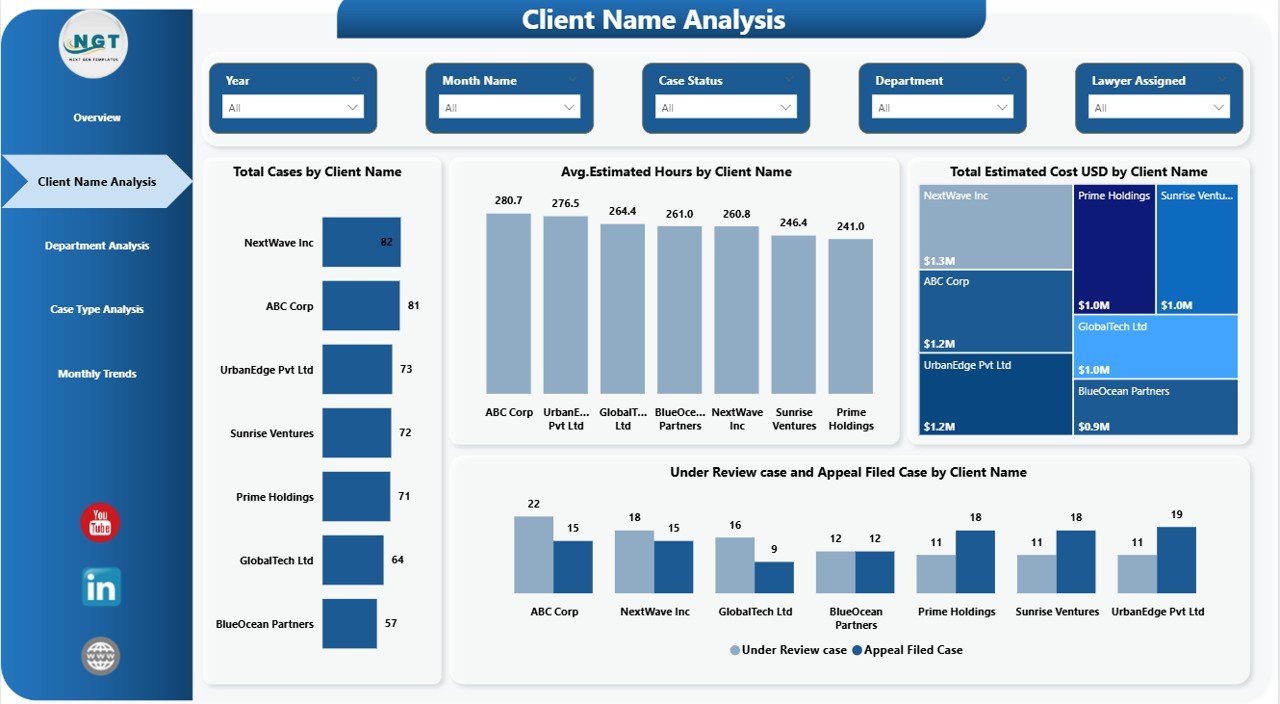
Client Name Analysis – Which Clients Generate the Most Legal Work?
Understanding client-wise workload plays a major role in strategic planning. The Client Name Analysis Page helps legal teams evaluate client engagement effectively.
Key Visualizations
- Total Cases by Client Name
- Average Estimated Hours by Client Name
- Total Estimated Cost (USD) by Client Name
As a result, organizations identify:
- High-value clients
- Resource-intensive clients
- Cost-heavy legal engagements
Consequently, legal leaders optimize billing strategies and resource allocation.
Click to buy Legal Dashboard in Power BI
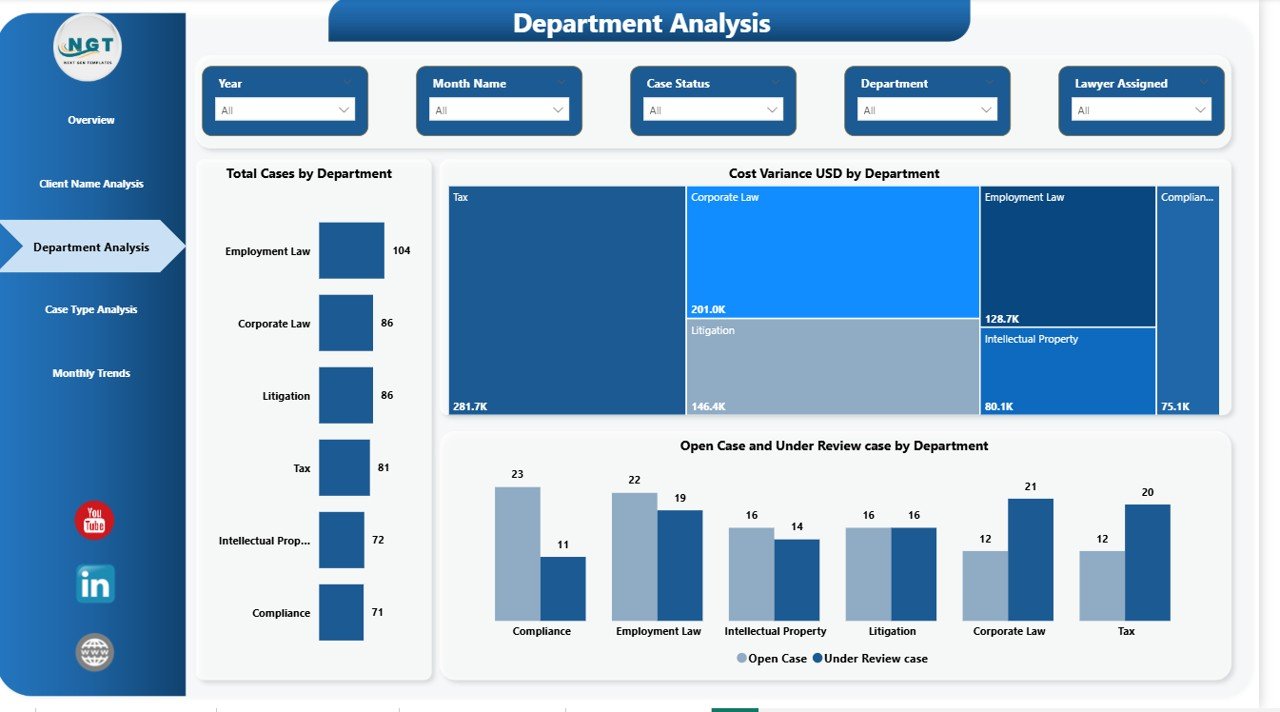
Department Analysis – How Do Departments Perform?
Different departments manage different types of legal matters. Therefore, performance tracking at the department level becomes essential.
Charts Included
- Total Cases by Department
- Cost Variance by Department
- Open Cases and Under Review Cases by Department
This page helps managers answer important questions:
- Which department handles the most cases?
- Where do cost overruns occur?
- Which teams need additional resources?
Because insights appear visually, decision-makers act faster.
Click to buy Legal Dashboard in Power BI
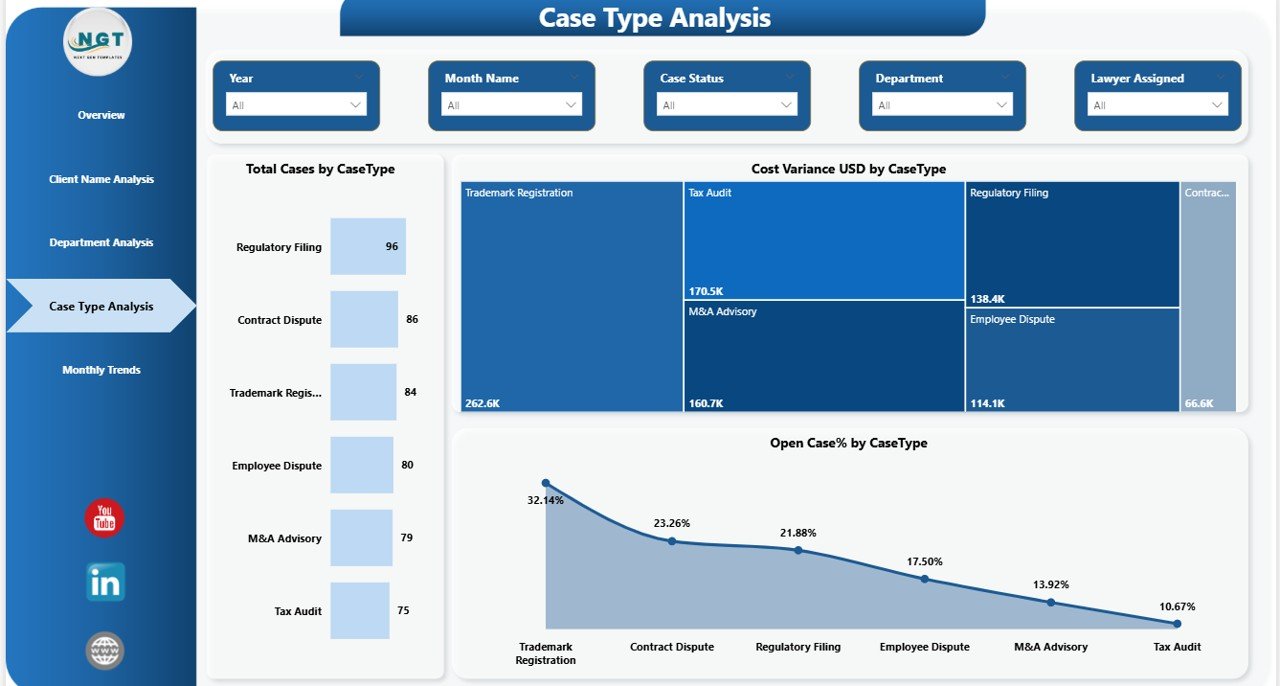
Case Type Analysis – Which Legal Case Types Require More Attention?
Not all legal cases demand equal effort. Some case types consume more time, budget, and resources.
The Case Type Analysis Page highlights these differences clearly.
Charts Available
- Total Cases by Case Type
- Cost Variance (USD) by Case Type
- Open Case Percentage by Case Type
Using this analysis, legal teams can:
- Predict workload patterns
- Control expensive case categories
- Improve case prioritization
Therefore, organizations manage risks proactively.
Click to buy Legal Dashboard in Power BI
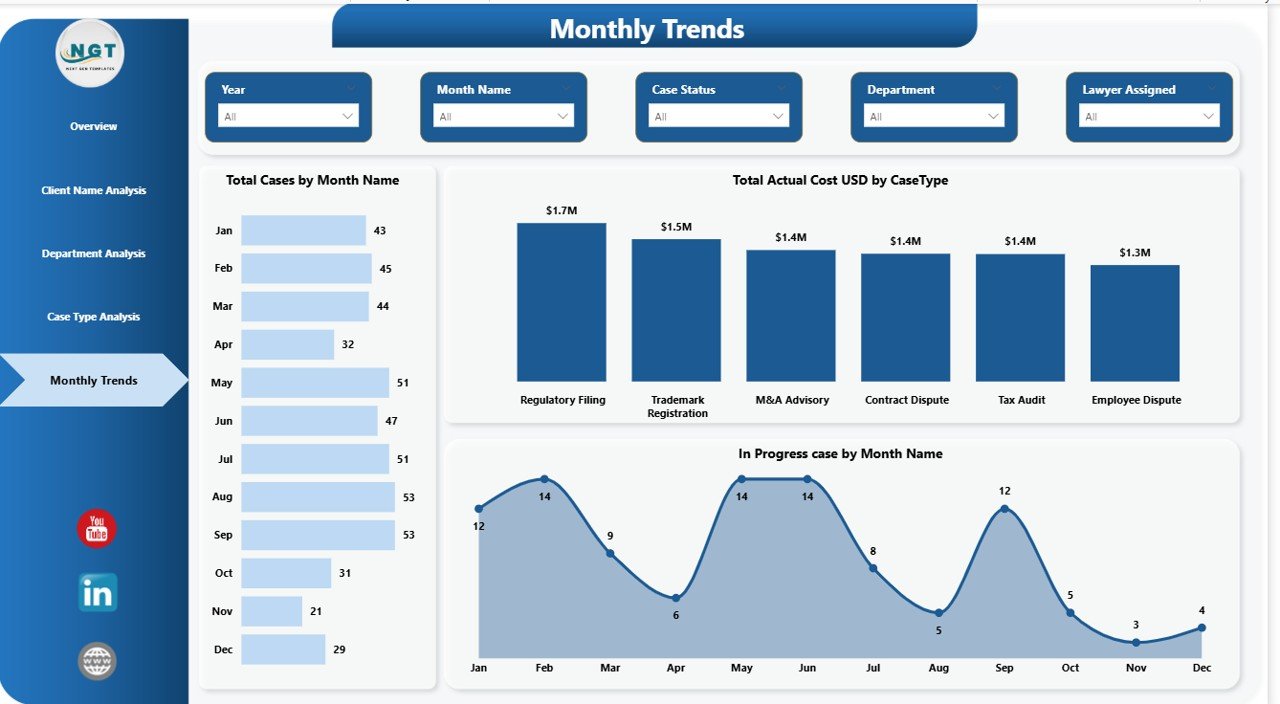
Monthly Trends – What Patterns Appear Over Time?
Trend analysis helps organizations plan future strategies. The Monthly Trends Page provides time-based insights.
Visualizations Included
- Total Cases by Month Name
- Total Actual Cost (USD) by Case Type
- In-Progress Cases by Month Name
Because trends become visible instantly, managers forecast workloads and budgets more accurately.
Click to buy Legal Dashboard in Power BI
What KPIs Should a Legal Dashboard Track?
A powerful Legal Dashboard focuses on measurable indicators.
Essential Legal KPIs
- Total Active Cases
- Open Case Ratio
- Case Resolution Rate
- Estimated vs Actual Cost
- Cost Variance
- Average Case Duration
- Department Performance
- Client Case Distribution
- Monthly Case Trends
When organizations track these KPIs consistently, performance improves significantly.
Advantages of Legal Dashboard in Power BI
Implementing a Legal Dashboard brings several operational benefits.
Centralized Legal Data
All information appears in one place, which reduces confusion and duplication.
Real-Time Insights
Users analyze updated data instantly instead of waiting for manual reports.
Better Cost Control
Finance teams monitor spending and identify budget overruns quickly.
Improved Case Management
Managers track case status without manual follow-ups.
Faster Decision-Making
Visual analytics simplify complex legal data.
Enhanced Accountability
Departments become more responsible when performance remains visible.
How Does Power BI Make Legal Analytics Powerful?
Power BI offers advanced capabilities that traditional tools cannot provide.
Key Power BI Advantages
- Interactive dashboards
- Dynamic slicers and filters
- Drill-down analysis
- Automated data refresh
- Professional visualizations
- Easy sharing across teams
Because Power BI integrates with multiple data sources, organizations build scalable analytics systems easily.
Who Can Benefit from a Legal Dashboard?
Many professionals benefit from this dashboard.
Ideal Users Include
- Corporate Legal Departments
- Law Firms
- Compliance Teams
- Risk Management Teams
- Legal Operations Managers
- Finance Controllers
- Executive Leadership Teams
Therefore, the dashboard supports both operational and strategic roles.
How to Use a Legal Dashboard in Power BI Effectively?
Using the dashboard becomes simple when teams follow structured steps.
Step-by-Step Usage
- Import legal case data into Power BI.
- Update datasets regularly.
- Use slicers to filter analysis.
- Monitor KPI cards daily.
- Analyze trends weekly.
- Share reports with stakeholders.
As teams adopt consistent usage, reporting efficiency increases dramatically.
Best Practices for the Legal Dashboard in Power BI
To achieve maximum value, organizations should follow proven best practices.
Maintain Clean Data
Ensure consistent naming conventions and accurate entries.
Define Clear KPIs
Track only meaningful metrics aligned with business goals.
Use Standard Case Categories
Standardization improves reporting accuracy.
Schedule Data Refresh
Automated updates keep dashboards reliable.
Train Legal Teams
Users must understand how to interpret visuals.
Monitor Cost Variance Regularly
Early detection prevents budget overruns.
Use Role-Based Access
Protect confidential legal information.
Consequently, organizations operate more efficiently.
Future of Legal Analytics with Power BI
Legal operations continue to evolve toward data-driven decision-making. Modern organizations increasingly adopt analytics tools to remain competitive.
Future dashboards may include:
- AI-based case predictions
- Automated risk scoring
- Legal workload forecasting
- Smart cost optimization analytics
- Integration with legal management systems
Therefore, adopting Power BI today prepares organizations for tomorrow’s legal technology landscape.
Conclusion
Legal teams no longer need to depend on complex spreadsheets or delayed reporting. The Legal Dashboard in Power BI provides a modern, interactive, and efficient way to monitor cases, analyze costs, and evaluate performance.
Because the dashboard combines visualization, automation, and analytics, organizations gain complete operational clarity. Moreover, managers make faster decisions, control budgets effectively, and improve legal outcomes consistently.
In short, a Legal Dashboard transforms legal data into strategic intelligence — and that transformation drives smarter legal management.
Frequently Asked Questions (FAQs)
What is a Legal Dashboard in Power BI used for?
A Legal Dashboard helps organizations track legal cases, monitor costs, analyze department performance, and visualize trends using interactive reports.
Can law firms use Power BI dashboards?
Yes. Law firms use Power BI dashboards to manage client cases, analyze billing performance, and improve operational efficiency.
Does the dashboard require advanced technical skills?
No. Users can interact with filters and visuals easily without technical expertise once the dashboard is created.
How often should legal dashboards be updated?
Organizations should update data daily or weekly depending on case activity levels.
What data sources can Power BI connect to?
Power BI connects to Excel files, databases, cloud platforms, and many legal management systems.
Why is cost variance important in legal analytics?
Cost variance helps organizations compare estimated and actual expenses, which improves budgeting accuracy.
Is Power BI suitable for corporate legal departments?
Yes. Corporate legal teams benefit greatly because Power BI provides centralized visibility and performance monitoring.
Visit our YouTube channel to learn step-by-step video tutorials
Watch the step-by-step video tutorial:
Click to buy Legal Dashboard in Power BI