The renewable energy industry continues to grow rapidly. As countries invest heavily in clean energy solutions, wind turbine manufacturing companies must improve efficiency, maintain quality, and control production costs. However, managing complex manufacturing operations without structured performance tracking creates delays, quality issues, and missed targets.
Therefore, manufacturers need a smart system that converts operational data into clear performance insights. Instead of reviewing scattered reports, organizations can monitor production health through one centralized dashboard.
This is exactly where the Wind Turbine Manufacturing KPI Dashboard in Excel becomes essential.
Click to Purchases Wind Turbine Manufacturing KPI Dashboard in Excel
In this comprehensive guide, you will learn everything about the Wind Turbine Manufacturing KPI Dashboard in Excel, including its purpose, features, benefits, implementation process, best practices, and frequently asked questions. Moreover, you will discover how this ready-to-use Excel template helps manufacturing teams make faster and better decisions.
What Is a Wind Turbine Manufacturing KPI Dashboard in Excel?
A Wind Turbine Manufacturing KPI Dashboard in Excel is an interactive performance monitoring tool designed to track manufacturing Key Performance Indicators (KPIs) in a structured and visual format.
Instead of managing multiple spreadsheets, managers can analyze production performance, operational efficiency, and target achievements from one dynamic dashboard.
Because Excel offers flexibility and automation features, organizations can easily customize KPIs according to their manufacturing processes.
Why Do Wind Turbine Manufacturers Need KPI Tracking?
Wind turbine manufacturing involves multiple complex stages, such as:
-
Blade production
-
Tower fabrication
-
Generator assembly
-
Quality inspection
-
Supply chain coordination
-
Installation readiness
As a result, teams must continuously track performance metrics. Without KPI monitoring:
-
Production delays increase.
-
Quality issues remain unnoticed.
-
Costs rise unexpectedly.
-
Decision-making slows down.
However, when organizations use a KPI dashboard, they gain real-time visibility into operations.
Why Should Manufacturers Use Excel for KPI Dashboards?
Many companies assume they need expensive ERP or analytics software. However, Excel provides a powerful alternative.
Key Reasons Excel Works Perfectly
-
Easy to use and widely available
-
Highly customizable dashboards
-
Automatic calculations
-
Visual charts and conditional formatting
-
No additional software investment
-
Quick implementation
Therefore, even small and medium manufacturing companies can adopt advanced performance monitoring without high costs.
Overview of the Wind Turbine Manufacturing KPI Dashboard Template
In this article, we created a ready-to-use Wind Turbine Manufacturing KPI Dashboard in Excel designed specifically for manufacturing KPIs.
The dashboard contains 7 structured worksheets, each serving a specific purpose. Together, they create a complete performance management system.
What Sheets Are Included in the Dashboard?
1. Home Sheet – Smart Navigation Center
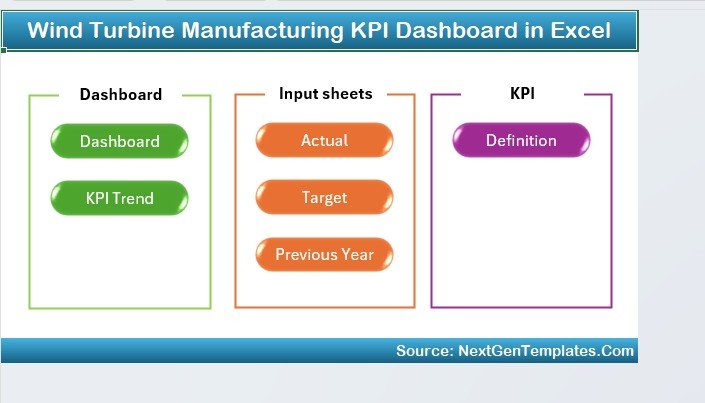
The Home Sheet works as the dashboard index page.
Here, users can quickly navigate across the workbook using six interactive buttons. Consequently, users save time and move between reports smoothly.
Key Benefits:
-
Easy navigation
-
User-friendly layout
-
Central control panel
-
Faster workflow access
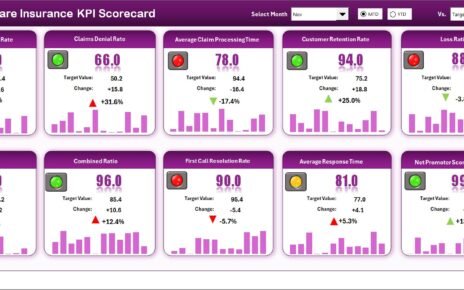
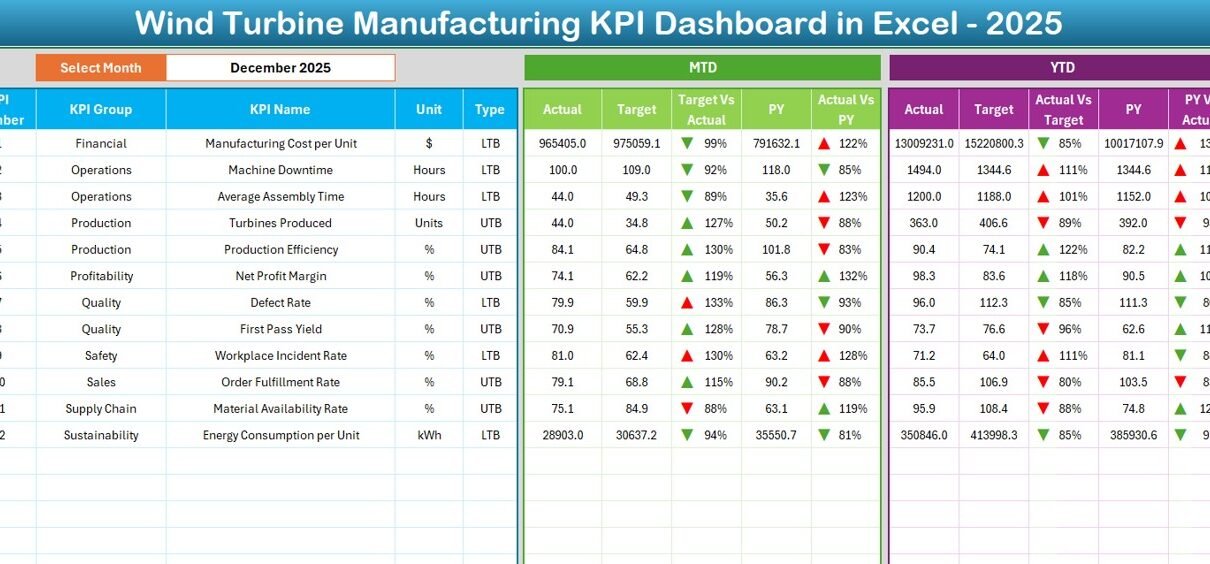
2. Dashboard Sheet – Main KPI Performance View
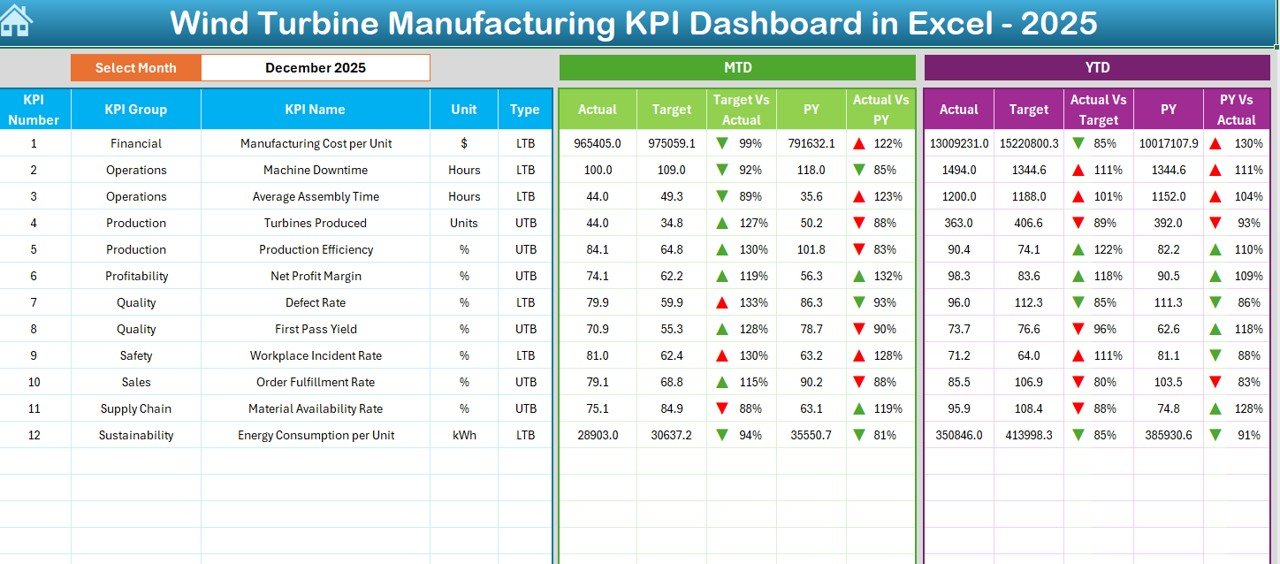
The Dashboard Sheet acts as the heart of the system.
Here, you can view all KPIs in one place. Additionally, users can select the reporting month from the dropdown available in cell D3. Once selected, the entire dashboard updates automatically.
Metrics Displayed
The dashboard shows:
MTD (Month-to-Date):
-
Actual values
-
Target values
-
Previous year comparison
-
Target vs Actual variance
-
Previous Year vs Actual variance
YTD (Year-to-Date):
-
Actual performance
-
Targets
-
Previous year results
-
Performance comparison indicators
Conditional formatting arrows instantly show performance direction:
-
⬆️ Improvement
-
⬇️ Decline
Therefore, managers immediately understand performance trends without deep analysis.
Click to Purchases Wind Turbine Manufacturing KPI Dashboard in Excel
3. KPI Trend Sheet – Performance Analysis Over Time
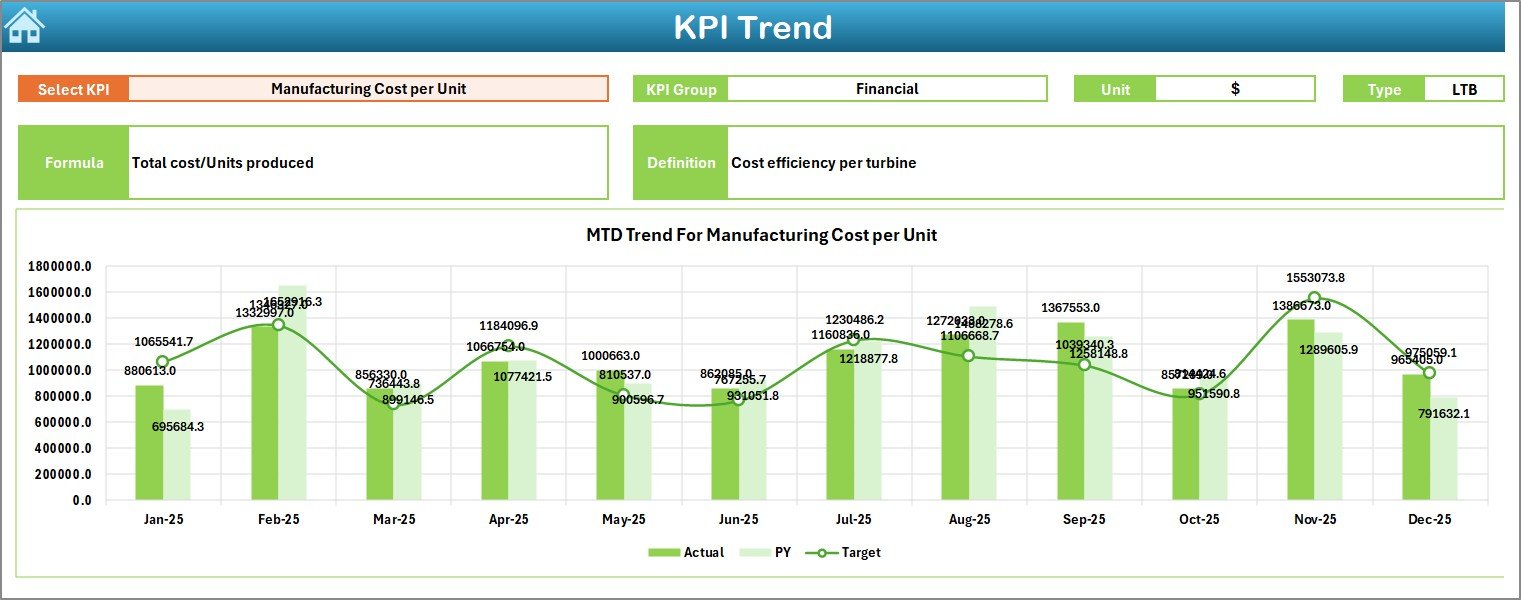
The KPI Trend Sheet allows deep KPI analysis.
Users select a KPI from the dropdown in cell C3, and the dashboard automatically displays detailed information.
Information Displayed
-
KPI Group
-
KPI Unit
-
KPI Type (Lower is Better / Higher is Better)
-
KPI Formula
-
KPI Definition
Additionally, the sheet includes:
-
MTD Trend Chart
-
YTD Trend Chart
-
Actual vs Target vs Previous Year comparison
Because of visual trends, decision-makers can quickly identify performance patterns.
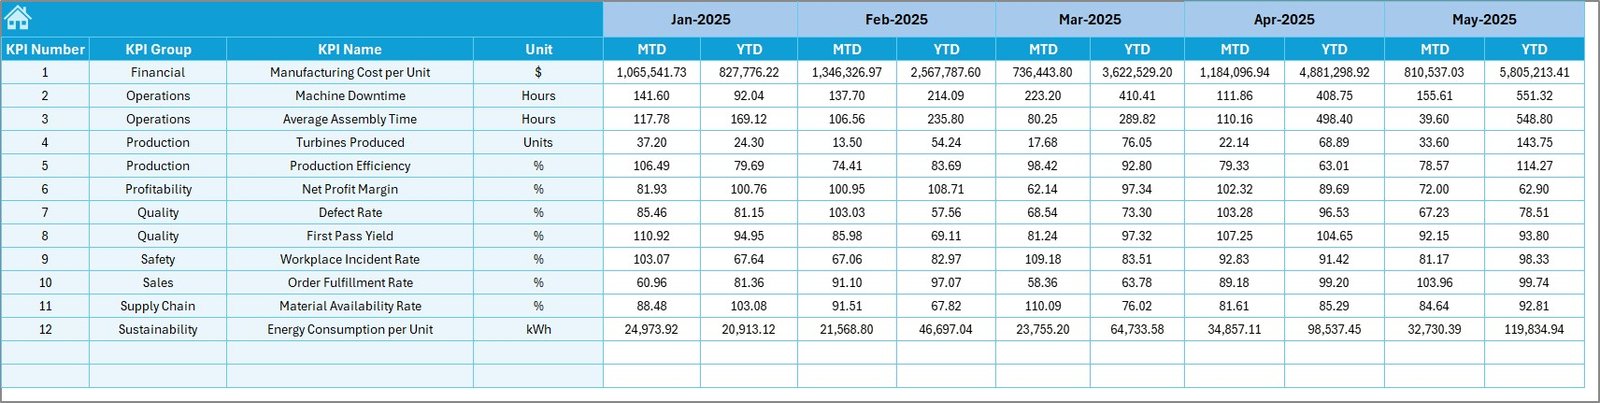
4. Actual Numbers Input Sheet – Data Entry Area
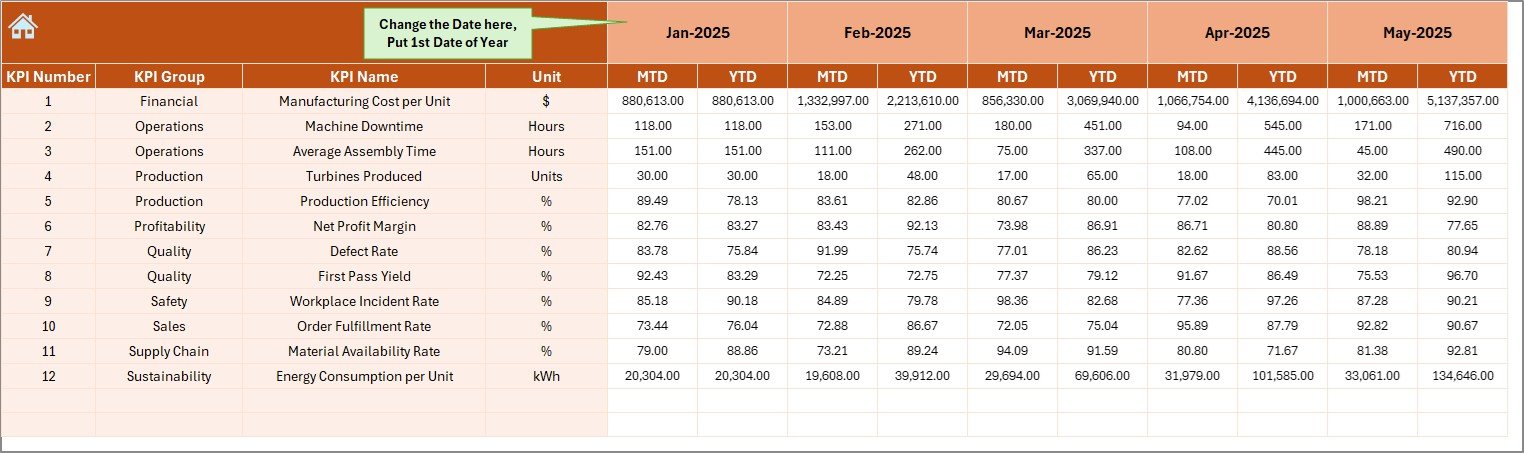
This sheet serves as the primary data input section.
Users enter actual performance numbers for both MTD and YTD values.
Key Functionality
-
Select starting month in cell E1
-
Input monthly performance data
-
Automatic dashboard update
Therefore, data entry remains simple and structured.
5. Target Sheet – Performance Planning
The Target Sheet helps organizations define performance goals.
Here, users enter monthly targets for each KPI.
Both MTD and YTD targets remain available, which ensures accurate performance comparisons.
Consequently, management teams can evaluate goal achievement effectively.
Click to Purchases Wind Turbine Manufacturing KPI Dashboard in Excel
6. Previous Year Numbers Sheet – Historical Comparison
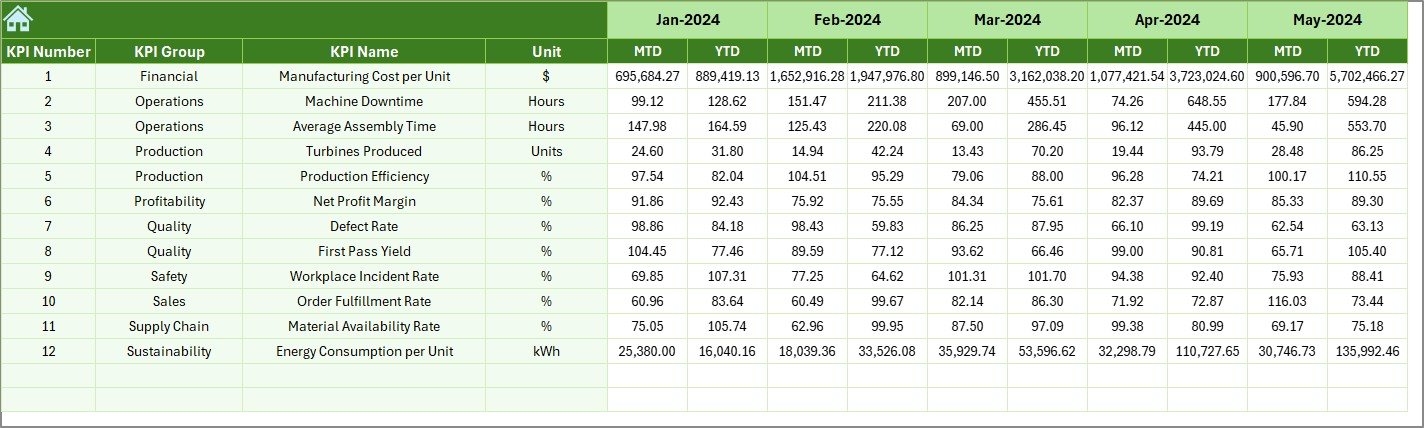
Historical analysis plays a major role in manufacturing improvement.
In this sheet, users enter previous year values matching the current KPI structure.
Because the dashboard compares past and present performance, organizations can measure growth accurately.
7. KPI Definition Sheet – KPI Documentation Center
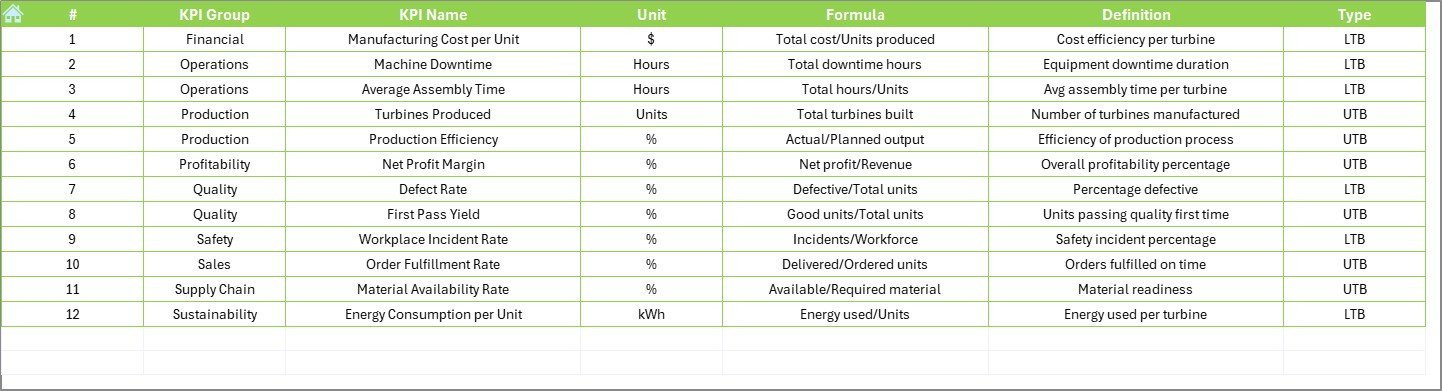
The KPI Definition Sheet stores KPI metadata.
Users define:
-
KPI Name
-
KPI Group
-
Unit of Measurement
-
Formula
-
KPI Definition
As a result, everyone understands KPI meaning clearly, which improves reporting consistency.
What KPIs Can You Track in Wind Turbine Manufacturing?
A well-designed dashboard supports multiple manufacturing KPIs, such as:
Production KPIs
-
Turbine units produced
-
Assembly cycle time
-
Production efficiency rate
-
Machine utilization
Quality KPIs
-
Defect rate
-
Rework percentage
-
Inspection pass rate
-
Quality compliance score
Operational KPIs
-
Downtime hours
-
Labor productivity
-
Material usage efficiency
-
Energy consumption per turbine
Financial KPIs
-
Manufacturing cost per unit
-
Budget variance
-
Operational cost efficiency
Advantages of Wind Turbine Manufacturing KPI Dashboard in Excel
Organizations experience significant improvements after implementing KPI dashboards.
✅ Improved Decision-Making
Managers access real-time insights and respond quickly to issues.
✅ Better Production Visibility
Teams understand performance status instantly.
✅ Faster Performance Analysis
Visual indicators eliminate manual calculations.
✅ Cost Control
Companies identify inefficiencies early.
✅ Data Centralization
All KPIs stay in one structured system.
✅ Performance Accountability
Departments clearly track responsibilities.
How to Implement the Wind Turbine Manufacturing KPI Dashboard?
Step 1: Define Manufacturing KPIs
First, identify measurable KPIs aligned with business goals.
Step 2: Enter KPI Definitions
Next, populate the KPI Definition sheet with formulas and descriptions.
Step 3: Set Targets
Add monthly targets in the Target Sheet.
Step 4: Input Actual Data
Regularly update performance numbers.
Step 5: Add Previous Year Data
Include historical performance for comparison.
Step 6: Analyze Dashboard Insights
Click to Purchases Wind Turbine Manufacturing KPI Dashboard in Excel
Review MTD and YTD metrics every month.
Step 7: Take Action
Improve operations based on dashboard insights.
Best Practices for the Wind Turbine Manufacturing KPI Dashboard
Organizations achieve better results when they follow structured practices.
✔ Select Meaningful KPIs
Track metrics that directly influence manufacturing success.
✔ Update Data Regularly
Maintain weekly or monthly updates.
✔ Standardize KPI Definitions
Ensure all teams interpret metrics consistently.
✔ Use Visual Indicators Wisely
Keep charts simple and readable.
✔ Review Trends Frequently
Trend analysis helps predict issues early.
✔ Train Team Members
Ensure stakeholders understand dashboard usage.
Common Challenges and How to Overcome Them
Challenge 1: Poor Data Accuracy
Solution: Create validation rules for inputs.
Challenge 2: Too Many KPIs
Solution: Focus on critical performance indicators.
Challenge 3: Lack of Adoption
Solution: Provide training and clear documentation.
Challenge 4: Inconsistent Reporting
Solution: Establish standardized reporting cycles.
How Does This Dashboard Improve Renewable Energy Manufacturing?
Wind turbine manufacturing requires precision and coordination. Therefore, performance visibility becomes critical.
This dashboard helps organizations:
-
Optimize production planning
-
Reduce operational delays
-
Improve quality compliance
-
Monitor sustainability performance
-
Enhance resource utilization
As a result, manufacturers strengthen competitiveness in the renewable energy sector.
Future Scope of KPI Dashboards in Wind Energy Manufacturing
As renewable energy expands, data-driven manufacturing will become standard practice.
Future improvements may include:
-
Power BI integration
-
Automated data imports
-
IoT-based machine data tracking
-
Predictive analytics
-
AI-driven performance forecasting
However, Excel dashboards remain the best starting point due to flexibility and affordability.
Conclusion
The Wind Turbine Manufacturing KPI Dashboard in Excel provides a powerful yet simple solution for monitoring manufacturing performance. Instead of relying on manual reports, organizations gain structured insights into production, quality, and operational efficiency.
Moreover, the dashboard centralizes KPIs, simplifies analysis, and supports faster decision-making. Because it uses Excel, companies can implement it quickly without investing in expensive systems.
Therefore, manufacturers who adopt KPI dashboards position themselves for higher efficiency, better quality control, and sustainable growth in the renewable energy industry.
Frequently Asked Questions (FAQs)
1. What is a Wind Turbine Manufacturing KPI Dashboard?
It is an Excel-based tool that tracks manufacturing performance metrics using visual charts and automated calculations.
2. Who should use this dashboard?
Production managers, plant supervisors, quality teams, and manufacturing analysts benefit the most.
3. Can I customize the KPIs?
Yes. You can easily modify KPI definitions, targets, and formulas according to your operations.
4. Does the dashboard require advanced Excel skills?
No. Basic Excel knowledge allows users to operate and update the dashboard.
5. How often should data be updated?
Organizations typically update data monthly; however, weekly updates improve monitoring accuracy.
6. Why compare with previous year data?
Historical comparison helps identify improvement trends and seasonal performance changes.
7. Can small manufacturing companies use this dashboard?
Yes. Excel makes the solution affordable and scalable for businesses of all sizes.
Visit our YouTube channel to learn step-by-step video tutorials