In recent years, alternative medicine has gained significant popularity across the world. People increasingly prefer natural healing methods, holistic therapies, and preventive healthcare approaches. As clinics grow and patient numbers increase, practitioners must manage appointments, treatments, revenue, and patient satisfaction efficiently. However, many alternative medicine clinics still rely on manual spreadsheets or disconnected reports. As a result, they struggle to analyze performance and make timely decisions.
Therefore, clinics need a structured and visual solution that converts raw healthcare data into meaningful insights. This is exactly where the Alternative Medicine Dashboard in Excel becomes essential.
Click to Purchases Alternative Medicine Dashboard in Excel
The Alternative Medicine Dashboard in Excel provides a ready-to-use analytical system that helps clinics monitor patient activity, treatment performance, practitioner efficiency, and financial outcomes in one centralized place. Instead of reviewing multiple files, clinic managers can instantly understand operational performance through interactive charts and KPIs.
In this comprehensive guide, you will learn everything about the Alternative Medicine Dashboard in Excel, including its features, dashboard pages, benefits, implementation steps, best practices, and frequently asked questions.
What Is an Alternative Medicine Dashboard in Excel?
An Alternative Medicine Dashboard in Excel is an interactive reporting tool designed to track and analyze clinic operations using visual analytics and key performance indicators (KPIs).
Instead of managing scattered patient records, clinics can centralize data into one Excel-based system. Consequently, practitioners gain better visibility into treatment outcomes, revenue trends, and patient satisfaction levels.
This dashboard helps clinics monitor:
-
Patient satisfaction ratings
-
Treatment performance
-
Practitioner productivity
-
Revenue generation
-
Treatment and medicine costs
-
Monthly performance trends
Moreover, Excel makes the dashboard accessible, flexible, and easy to customize without requiring expensive healthcare software.
Why Do Alternative Medicine Clinics Need a Dashboard?
Alternative medicine clinics often offer multiple therapies such as acupuncture, Ayurveda, naturopathy, chiropractic treatment, herbal medicine, and wellness consultations. Because each treatment generates different costs and outcomes, tracking performance manually becomes difficult.
Without analytics:
-
Clinics cannot identify profitable treatments.
-
Practitioners cannot evaluate patient satisfaction trends.
-
Managers struggle to control operational costs.
-
Decision-making becomes slow and reactive.
However, when clinics adopt a dashboard-driven approach, they gain real-time insights. As a result, leaders make faster and smarter decisions.
Key Features of the Alternative Medicine Dashboard in Excel
The dashboard comes with powerful yet simple features designed for healthcare professionals.
✅ Page Navigator
The Page Navigator, located on the left side, allows users to switch easily between analytical pages. Therefore, users can move quickly from overview insights to detailed analysis without confusion.
✅ Interactive Slicers
Right-side slicers enable dynamic filtering. Users can analyze data by:
-
Month
-
Treatment type
-
Practitioner
-
Clinic location
-
Patient category
Because of this flexibility, users can explore insights instantly.
✅ KPI Cards
The dashboard includes visual KPI cards that highlight key metrics at a glance. Consequently, managers understand performance without reviewing complex tables.
✅ Automated Charts
All charts update automatically when users change filters. Thus, the dashboard reduces manual reporting effort.
✅ Structured Data Model
The dashboard uses a dedicated Data Sheet and Support Sheet, which ensure smooth calculations and accurate reporting.
What Are the Dashboard Pages Included?
The Alternative Medicine Dashboard in Excel contains five analytical pages. Each page focuses on a specific operational perspective.
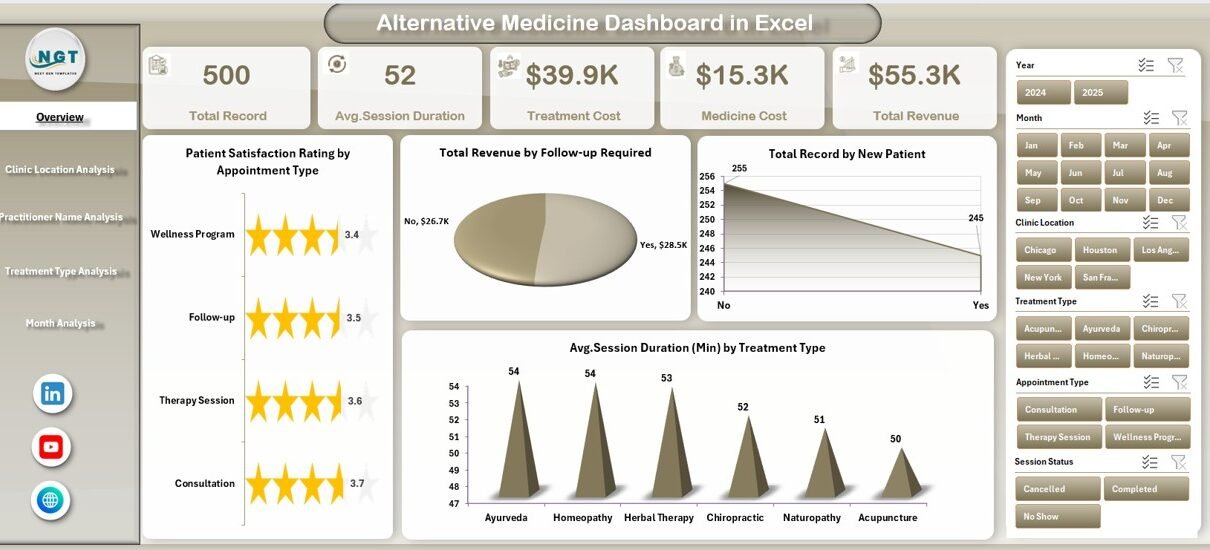
1. Overview Page – How Does the Clinic Perform Overall?
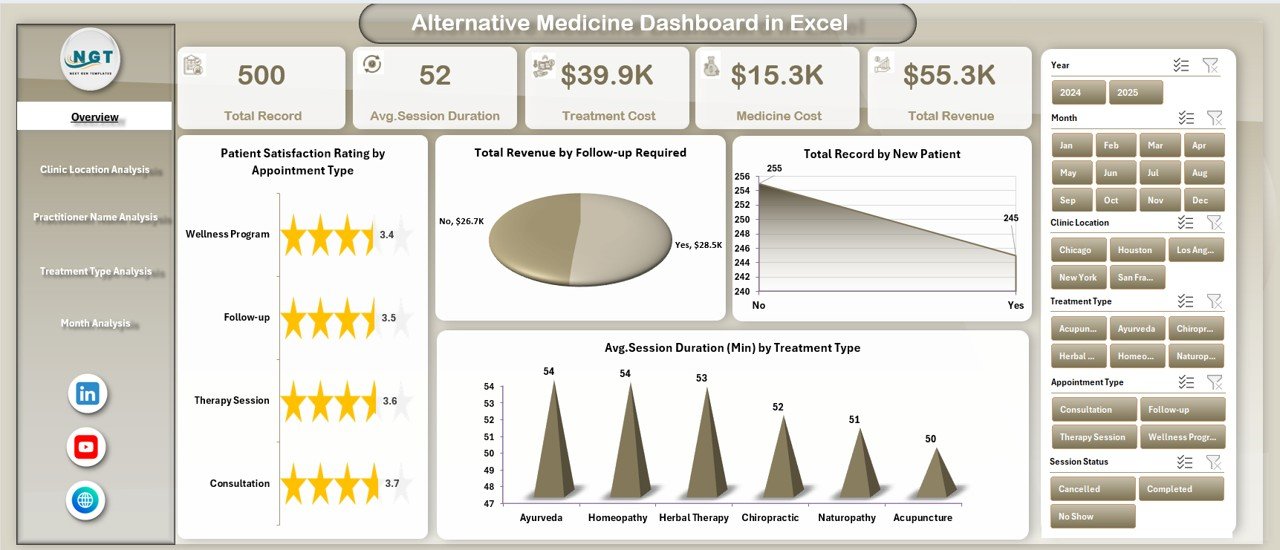
The Overview Page acts as the main control center of the dashboard.
Click to Purchases Alternative Medicine Dashboard in Excel
It includes:
KPI Cards
-
Key performance indicators displayed visually
-
Quick summary of clinic performance
Charts Available
-
Patient Satisfaction Rating by Appointment Type
-
Total Revenue by Follow-up Required
-
Total Records by New Patient
-
Average Session Duration by Treatment Type
Because this page summarizes major insights, managers quickly understand clinic performance trends.
For example, if satisfaction drops for a specific appointment type, the clinic can immediately investigate the issue.
2. Clinic Location Analysis – Which Location Performs Best?
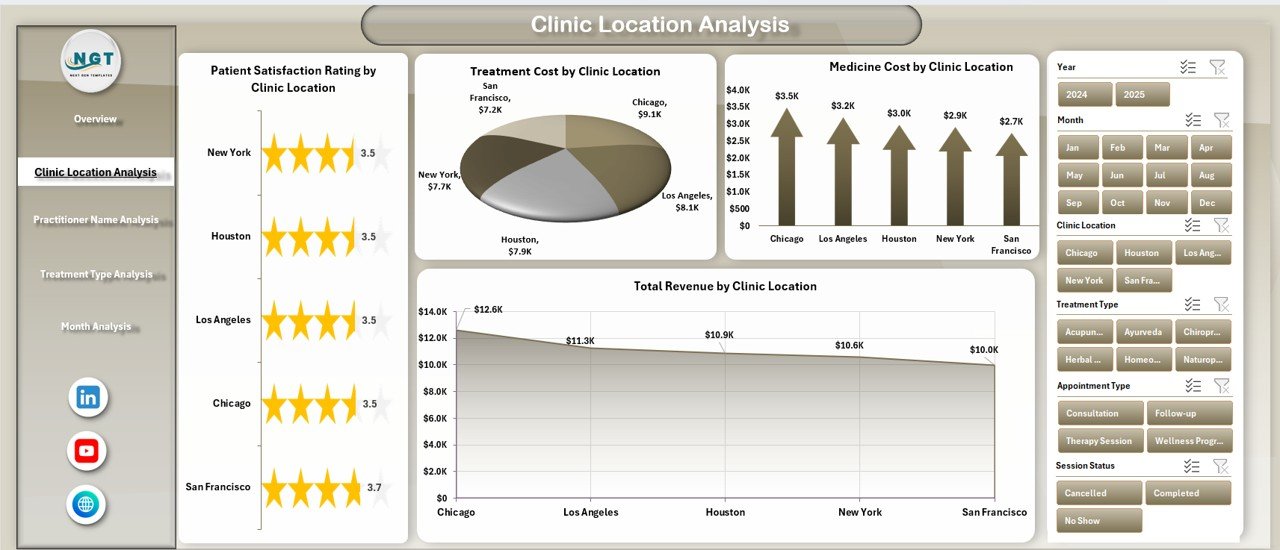
Many alternative medicine organizations operate across multiple locations. Therefore, comparing branch performance becomes essential.
This page includes:
-
Patient Satisfaction Rating by Clinic Location
-
Total Revenue by Clinic Location
-
Treatment Cost by Clinic Location
-
Medicine Cost by Clinic Location
Using this analysis, managers can:
-
Identify high-performing clinics
-
Detect cost inefficiencies
-
Optimize resource allocation
As a result, leadership improves operational balance across locations.
3. Practitioner Name Analysis – How Do Practitioners Perform?
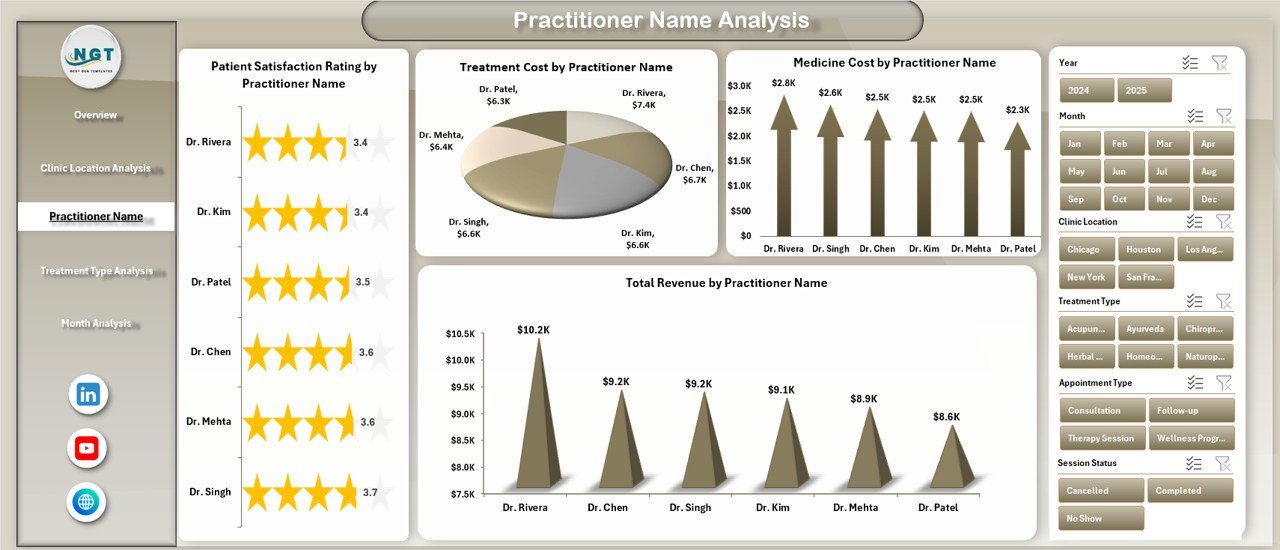
Practitioner performance directly impacts patient experience and revenue growth.
This analytical page shows:
-
Patient Satisfaction Rating by Practitioner Name
-
Total Revenue by Practitioner Name
-
Treatment Cost by Practitioner Name
-
Medicine Cost by Practitioner Name
Therefore, clinic owners can:
-
Reward high-performing practitioners
-
Provide training where satisfaction drops
-
Balance workload distribution
Additionally, practitioners gain transparency regarding their performance metrics.
Click to Purchases Alternative Medicine Dashboard in Excel
4. Treatment Type Analysis – Which Treatments Drive Growth?
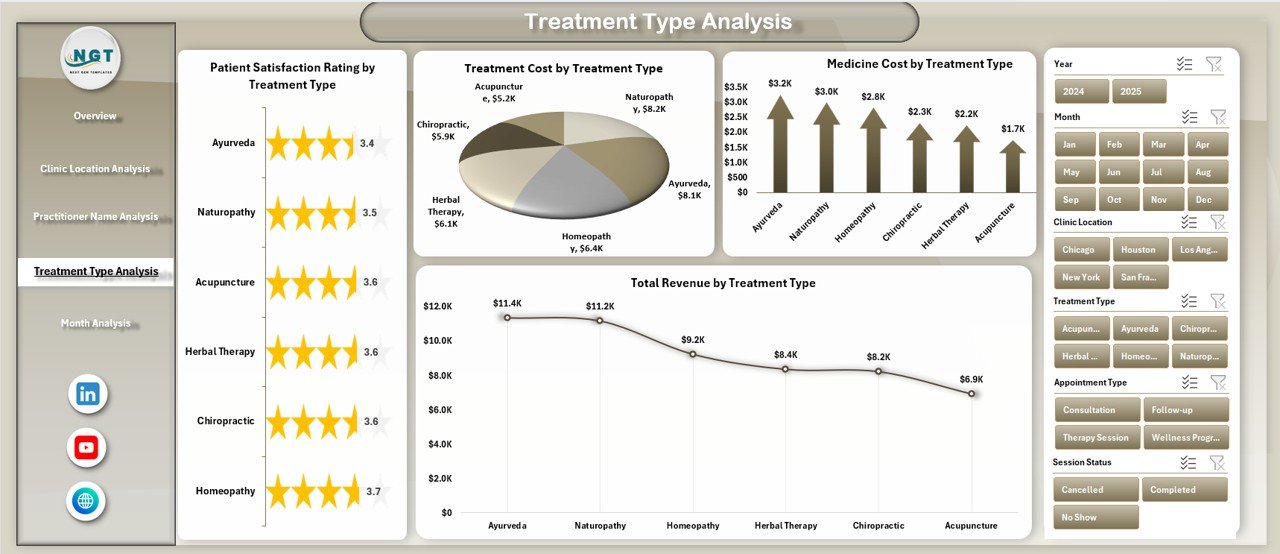
Alternative medicine clinics usually offer various therapies. However, not every treatment contributes equally to profitability.
This page analyzes:
-
Patient Satisfaction Rating by Treatment Type
-
Total Revenue by Treatment Type
-
Treatment Cost by Treatment Type
-
Medicine Cost by Treatment Type
Consequently, clinics can identify:
-
Most profitable therapies
-
High-cost treatments
-
Popular healing methods
-
Services needing improvement
Because of these insights, clinics refine their service offerings strategically.
5. Month Analysis – How Does Performance Change Over Time?
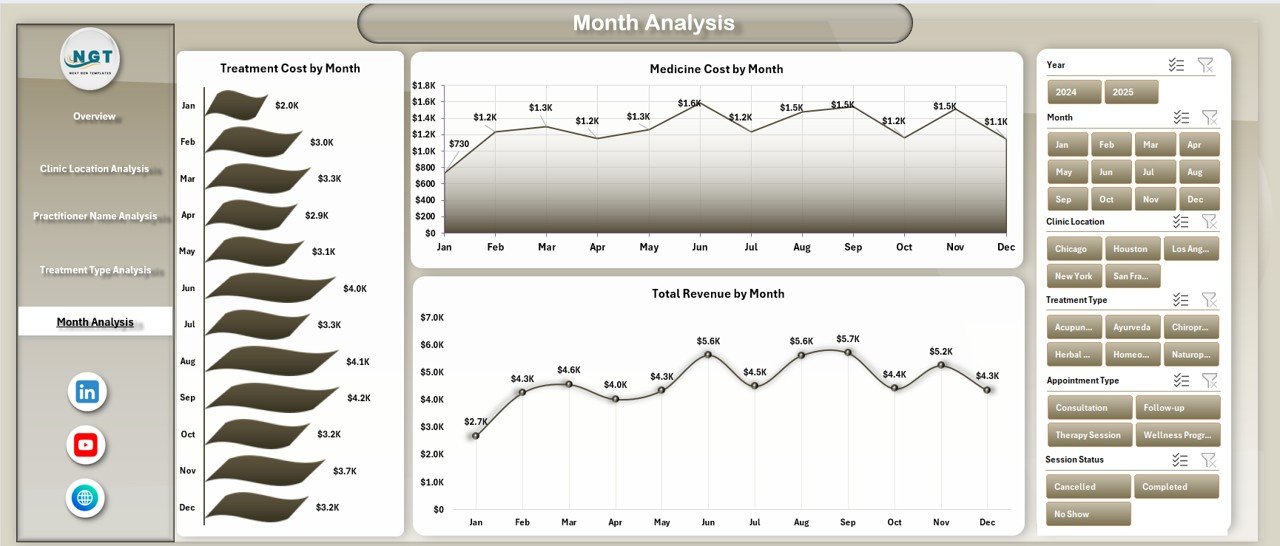
Trend analysis helps clinics plan future strategies.
The Month Analysis page includes:
-
Total Revenue by Month
-
Treatment Cost by Month
-
Medicine Cost by Month
This page allows users to:
-
Identify seasonal trends
-
Forecast revenue
-
Control expenses
-
Plan marketing campaigns effectively
Therefore, clinics move from reactive management to proactive planning.
What Sheets Support the Dashboard?
Data Sheet
The Data Sheet stores all operational records, including:
-
Patient details
-
Appointment information
-
Treatment type
-
Practitioner name
-
Costs and revenue
All dashboard visuals pull data from this structured sheet.
Support Sheet
The Support Sheet contains helper calculations and reference lists used for formulas, slicers, and validations. As a result, dashboard performance remains smooth and accurate.
Advantages of Alternative Medicine Dashboard in Excel
Click to Purchases Alternative Medicine Dashboard in Excel
Implementing this dashboard provides multiple operational benefits.
✔ Improved Decision-Making
Managers instantly view performance metrics. Therefore, they make data-driven decisions instead of assumptions.
✔ Better Patient Experience
By tracking satisfaction ratings, clinics quickly identify service gaps.
✔ Revenue Optimization
The dashboard highlights profitable treatments and practitioners. Consequently, clinics focus on high-value services.
✔ Cost Control
Treatment and medicine cost tracking helps reduce unnecessary expenses.
✔ Time Savings
Automated reporting eliminates manual calculations.
✔ Easy Customization
Since Excel supports flexibility, clinics can modify metrics anytime.
✔ Affordable Solution
Unlike expensive healthcare software, Excel provides a cost-effective alternative.
How to Use the Alternative Medicine Dashboard in Excel?
Follow these simple steps to start using the dashboard effectively.
Step 1: Enter Data
Input clinic records into the Data Sheet.
Step 2: Validate Information
Ensure treatment names, practitioners, and locations remain consistent.
Step 3: Refresh Dashboard
Update pivot tables or refresh connections.
Step 4: Apply Filters
Use slicers to analyze performance by category.
Step 5: Review Insights
Observe charts and KPIs to identify trends.
Step 6: Take Action
Implement improvements based on findings.
Best Practices for the Alternative Medicine Dashboard in Excel
To achieve maximum value, clinics should follow proven best practices.
✅ Maintain Clean Data
Always enter accurate and standardized data.
✅ Update Regularly
Update records daily or weekly for reliable insights.
✅ Use Consistent Naming
Avoid variations in practitioner or treatment names.
✅ Monitor KPIs Frequently
Review dashboard insights regularly instead of monthly.
✅ Train Staff
Ensure team members understand how to use filters and interpret charts.
✅ Backup Files
Maintain secure backups to prevent data loss.
✅ Customize KPIs
Adapt metrics based on clinic goals.
Common Challenges and How to Overcome Them
Challenge: Inconsistent Data Entry
Solution: Use dropdown lists and validation rules.
Challenge: Slow Reporting
Solution: Use structured tables and optimized formulas.
Challenge: Lack of Analytical Skills
Solution: Provide simple dashboard training sessions.
Challenge: Data Overload
Solution: Focus on key KPIs instead of excessive metrics.
Who Can Benefit from This Dashboard?
This dashboard serves multiple healthcare professionals:
-
Alternative medicine clinics
-
Ayurveda centers
-
Naturopathy practitioners
-
Wellness studios
-
Chiropractic clinics
-
Holistic therapy centers
-
Clinic managers and administrators
Because Excel remains widely used, almost any clinic can adopt this solution immediately.
Future Scope of Alternative Medicine Analytics
Click to Purchases Alternative Medicine Dashboard in Excel
Healthcare analytics continues to evolve rapidly. Therefore, alternative medicine clinics must embrace data-driven management.
Future improvements may include:
-
Integration with appointment systems
-
Automated patient feedback collection
-
Predictive treatment analytics
-
AI-based patient insights
-
Cloud-based reporting
Clinics that adopt analytics early will gain competitive advantages.
Conclusion
The Alternative Medicine Dashboard in Excel transforms clinic management by combining healthcare operations and analytics into one powerful platform. Instead of relying on manual reports, clinics gain clear visibility into patient satisfaction, practitioner performance, treatment efficiency, and financial results.
Moreover, the dashboard simplifies decision-making, improves patient experience, and enhances profitability. Because Excel offers flexibility and affordability, even small clinics can implement advanced analytics without technical complexity.
Ultimately, organizations that use structured dashboards move toward smarter, faster, and more sustainable healthcare management.
Frequently Asked Questions (FAQs)
1. What is an Alternative Medicine Dashboard in Excel used for?
It helps clinics monitor patient satisfaction, treatments, practitioner performance, revenue, and costs using interactive visuals.
2. Do I need advanced Excel skills to use this dashboard?
No. Basic Excel knowledge is enough because the dashboard works through automated charts and slicers.
3. Can I customize the dashboard?
Yes. You can add KPIs, modify charts, and adjust filters based on clinic requirements.
4. Is this dashboard suitable for small clinics?
Yes. Excel makes it affordable and scalable for clinics of any size.
5. How often should I update the data?
You should update data daily or weekly for accurate reporting.
6. Can the dashboard track multiple clinic locations?
Yes. The Clinic Location Analysis page compares performance across branches.
7. Does it support monthly trend analysis?
Yes. The Month Analysis page tracks revenue and costs over time.
Visit our YouTube channel to learn step-by-step video tutorials