In today’s highly competitive footwear industry, manufacturers must continuously monitor production efficiency, product quality, operational costs, and delivery timelines. Footwear companies operate in a fast-moving market where customer expectations change quickly. Therefore, organizations must track performance accurately and make decisions based on real data.
However, many footwear manufacturers still depend on disconnected spreadsheets and manual reports. As a result, managers struggle to understand factory performance, production delays, and quality issues on time. Consequently, decision-makers often miss improvement opportunities that directly impact profitability.
Click to Purchases Footwear Manufacturing KPI Dashboard in Excel
So, how can footwear manufacturers monitor key performance indicators without investing in expensive software?
The answer is simple — Footwear Manufacturing KPI Dashboard in Excel.
This comprehensive article explains everything you need to know about the Footwear Manufacturing KPI Dashboard in Excel, including features, benefits, implementation steps, best practices, and frequently asked questions.
What Is a Footwear Manufacturing KPI Dashboard in Excel?
A Footwear Manufacturing KPI Dashboard in Excel is an interactive performance monitoring tool designed to track manufacturing metrics using structured visual reports.
Instead of reviewing multiple production sheets, managers can monitor all KPIs from one centralized dashboard. Moreover, Excel transforms raw production data into meaningful insights through charts, comparisons, and automated calculations.
This ready-to-use template helps footwear factories track:
-
Production efficiency
-
Defect rates
-
Machine utilization
-
Order completion performance
-
Cost control metrics
-
Delivery timelines
As a result, management teams gain real-time visibility into factory operations.
Why Do Footwear Manufacturers Need KPI Tracking?
Footwear manufacturing involves multiple processes such as cutting, stitching, assembling, finishing, and packaging. Each stage affects final product quality and delivery schedules.
Without structured KPI tracking:
-
Production delays increase.
-
Quality defects remain unnoticed.
-
Costs rise unexpectedly.
-
Teams lack accountability.
On the other hand, when companies implement KPI dashboards, they quickly identify performance gaps and improve operational efficiency.
Therefore, KPI dashboards become essential for modern footwear factories.
What Are the Key Features of the Footwear Manufacturing KPI Dashboard in Excel?
In this article, we created a ready-to-use Footwear Manufacturing KPI Dashboard in Excel designed specifically for manufacturing KPIs.
The dashboard includes 7 powerful worksheets, each serving a specific purpose.
1️⃣ Home Sheet – Smart Navigation Center
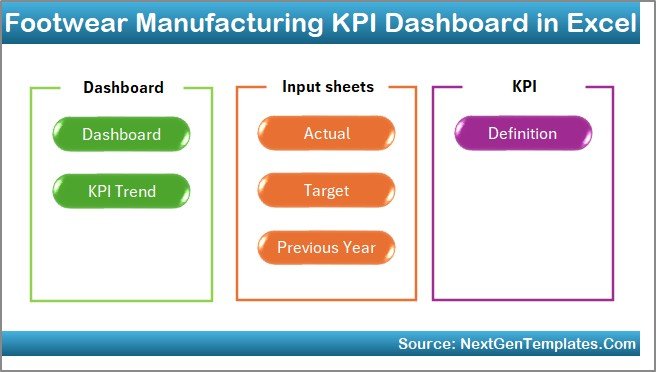
The Home Sheet works as the dashboard index page.
It allows users to navigate easily across the entire system.
Key highlights:
-
Six navigation buttons
-
One-click sheet access
-
User-friendly interface
-
Centralized dashboard control
Therefore, users do not need to search manually through multiple tabs.
Click to Purchases Footwear Manufacturing KPI Dashboard in Excel
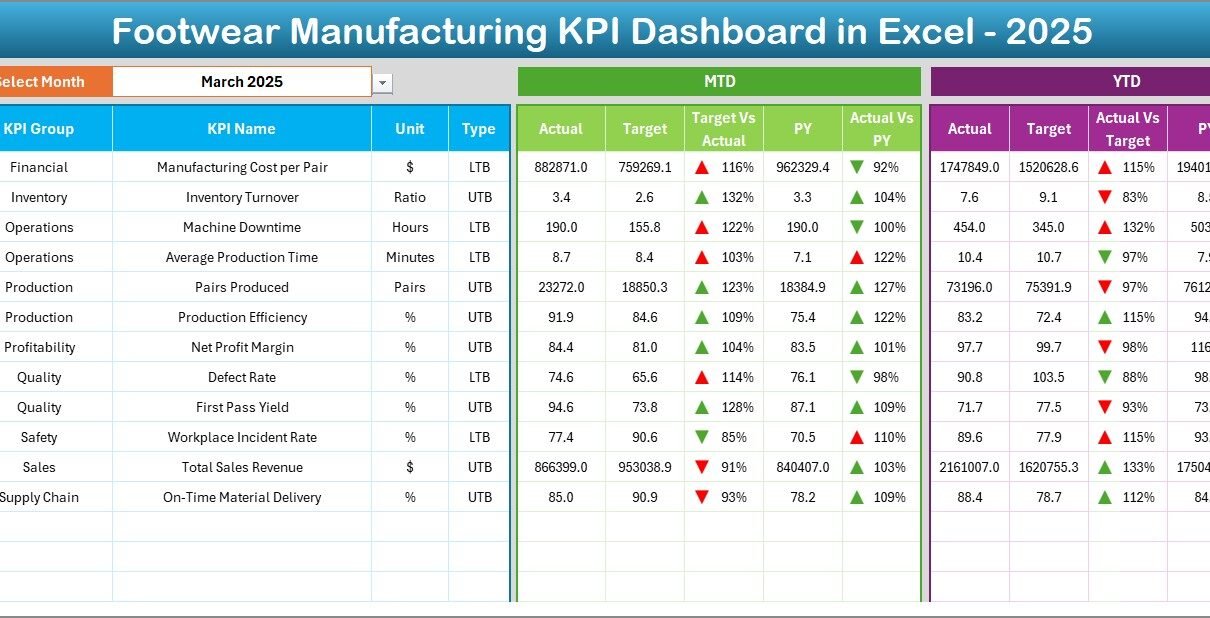
2️⃣ Dashboard Sheet – Main Performance Overview
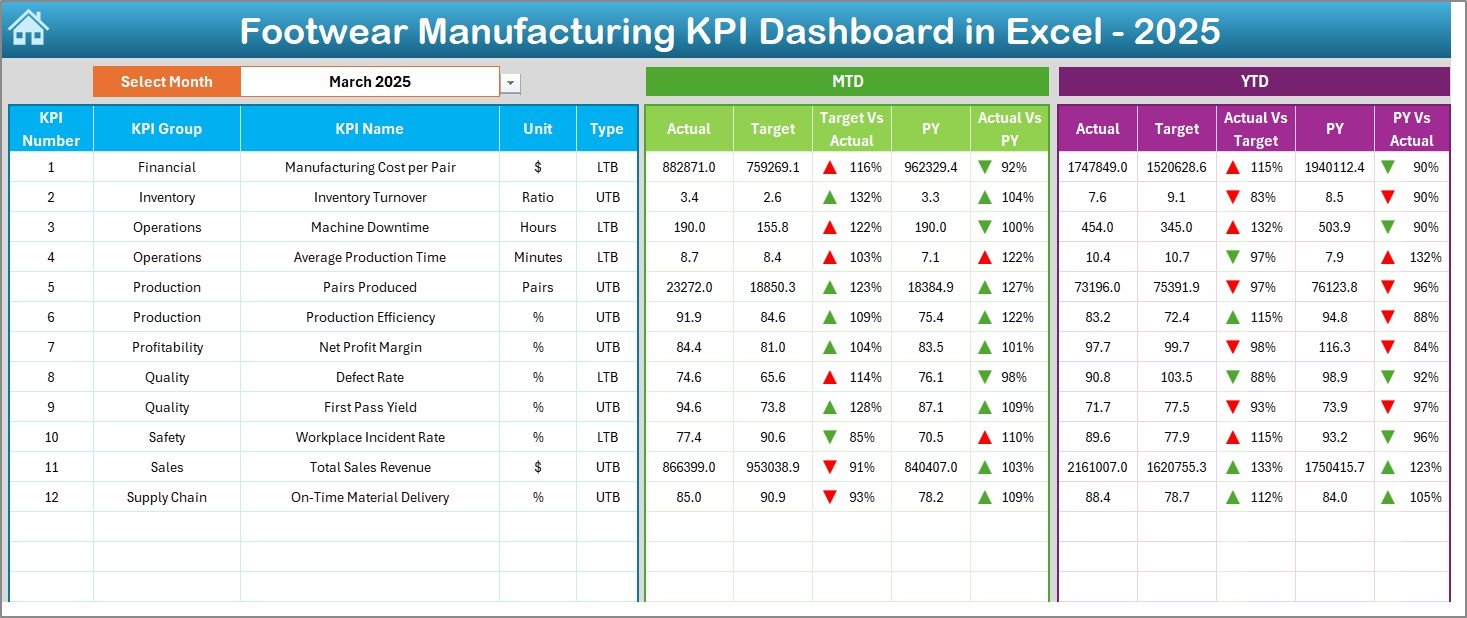
The Dashboard Sheet acts as the heart of the KPI system.
Here, users can view all KPI performance metrics in one place.
Dynamic Month Selection
-
Select the month from dropdown cell D3.
-
Entire dashboard updates automatically.
Performance Metrics Displayed
The dashboard shows:
-
MTD (Month-To-Date) Actual
-
Target Values
-
Previous Year Data
-
Target vs Actual comparison
-
Previous Year vs Actual comparison
Additionally, conditional formatting arrows instantly show performance direction:
-
🔼 Improvement
-
🔽 Decline
YTD Analysis Included
The dashboard also displays:
-
YTD Actual
-
YTD Target
-
YTD Previous Year comparison
As a result, managers understand both short-term and long-term performance trends.
3️⃣ KPI Trend Sheet – Detailed KPI Analysis
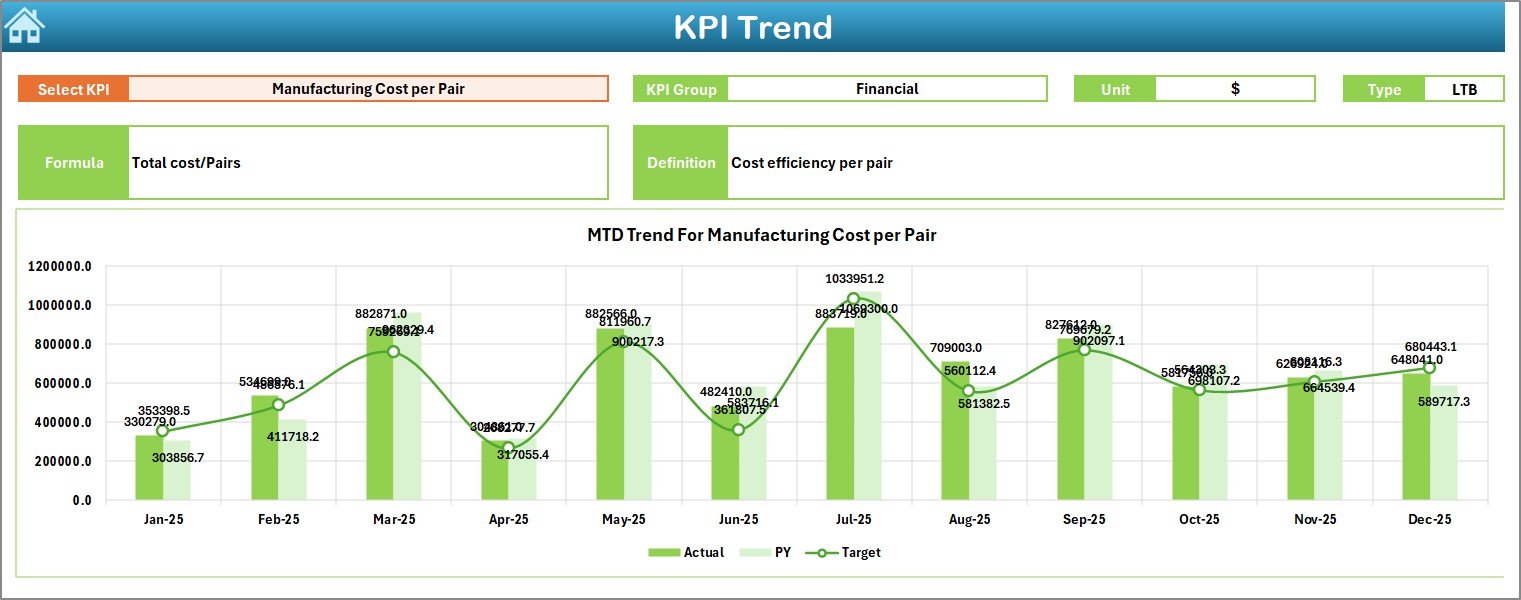
The KPI Trend Sheet provides deep analytical insights.
Users can select any KPI from dropdown cell C3.
Once selected, the dashboard displays:
-
KPI Group
-
KPI Unit
-
KPI Type (Lower is Better / Higher is Better)
-
KPI Formula
-
KPI Definition
Moreover, the sheet includes visual trend charts:
-
MTD trend comparison
-
YTD trend comparison
-
Actual vs Target vs Previous Year analysis
Therefore, teams easily identify performance patterns.
Click to Purchases Footwear Manufacturing KPI Dashboard in Excel
4️⃣ Actual Numbers Input Sheet – Data Entry Area
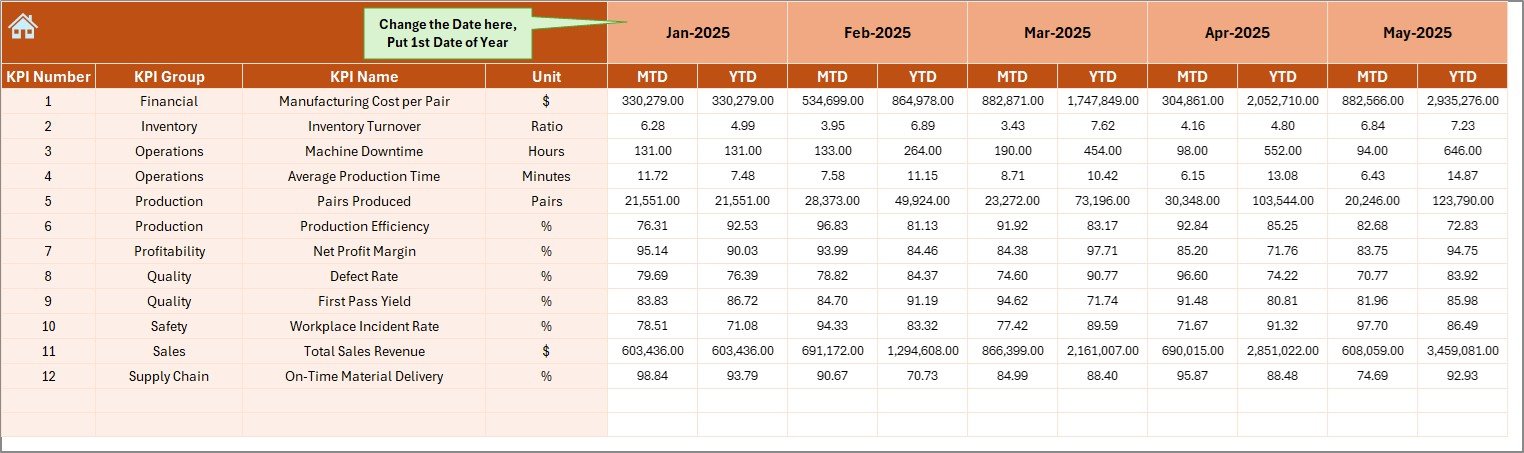
This sheet allows users to enter real production data.
How it works:
-
Enter the starting month in cell E1.
-
Input MTD and YTD actual numbers.
-
Dashboard updates automatically.
Because of structured input, data entry becomes simple and error-free.
5️⃣ Target Sheet – Goal Planning Module
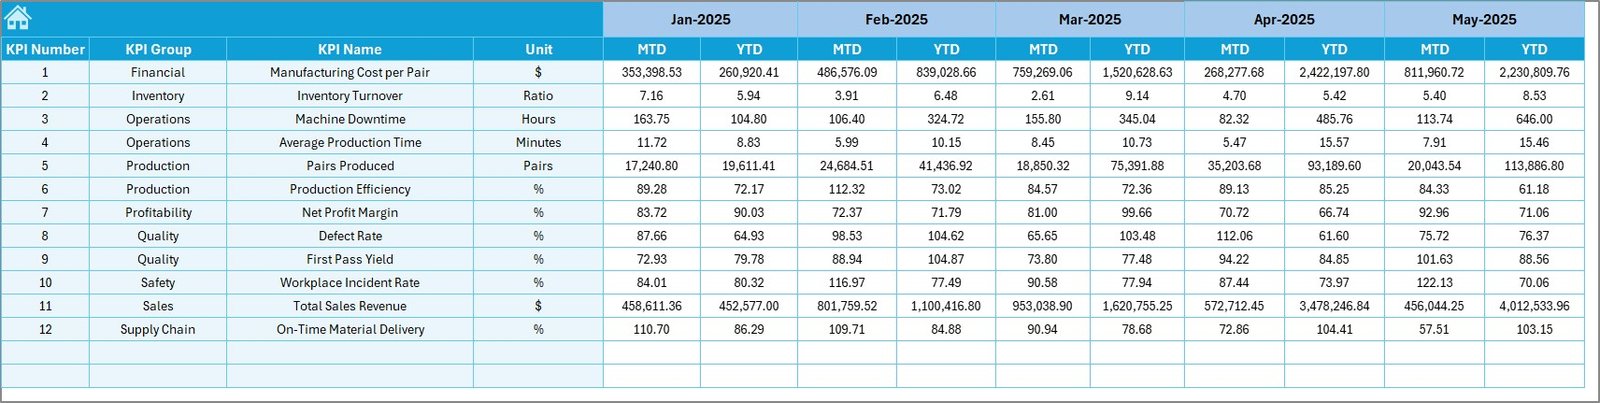
The Target Sheet helps organizations define performance expectations.
Users enter:
-
Monthly targets
-
YTD targets
-
KPI-specific goals
Consequently, management can measure performance against predefined objectives.
6️⃣ Previous Year Numbers Sheet – Historical Comparison
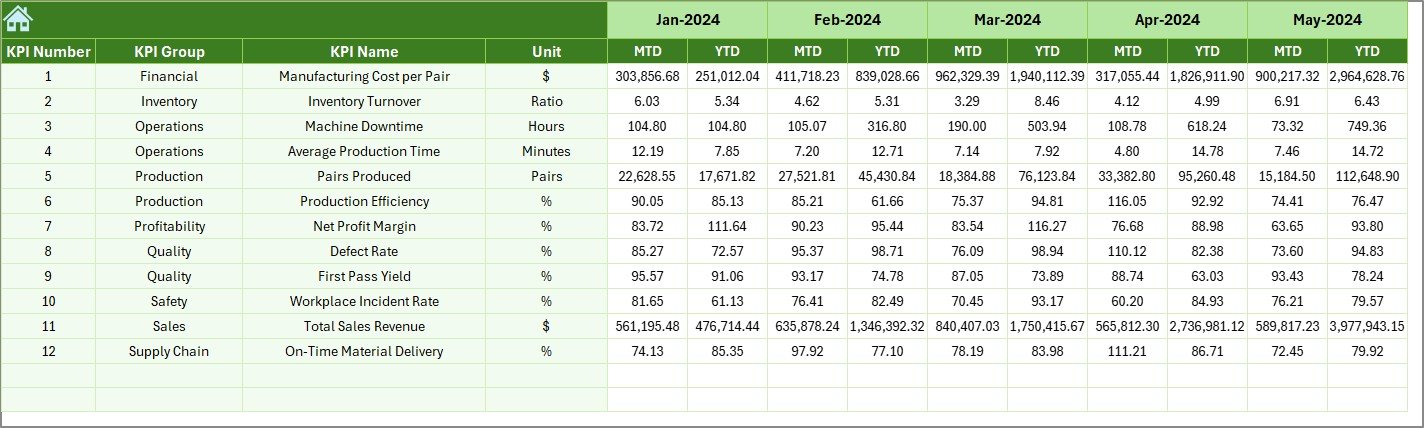
Historical analysis plays a crucial role in manufacturing improvement.
This sheet stores last year’s data.
Benefits include:
-
Year-over-year comparison
-
Performance benchmarking
-
Seasonal trend identification
Therefore, companies understand whether performance improves over time.
7️⃣ KPI Definition Sheet – KPI Knowledge Base
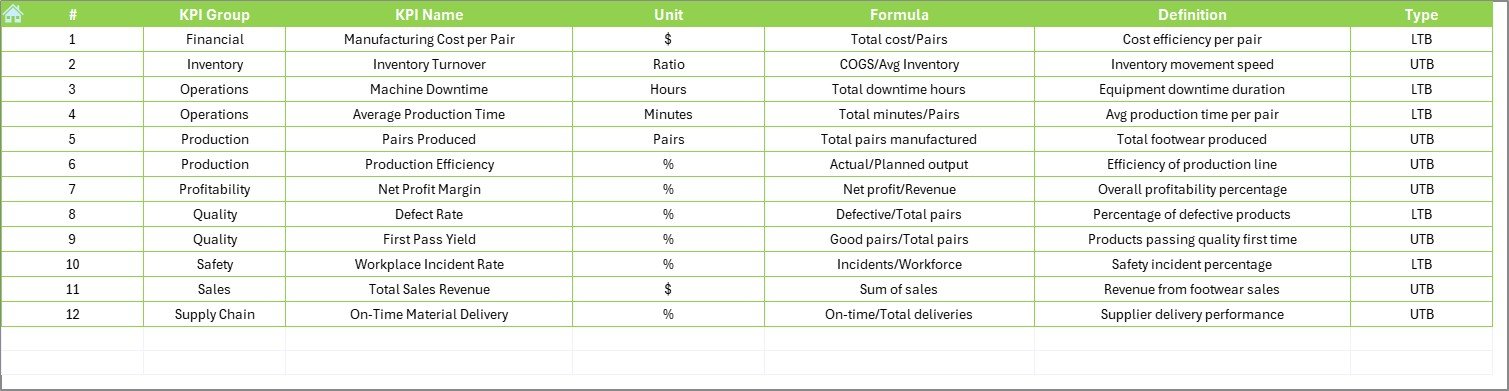
The KPI Definition Sheet works as a reference library.
Users define:
-
KPI Name
-
KPI Group
-
Unit of Measurement
-
KPI Formula
-
KPI Definition
As a result, every team member understands KPI meaning clearly.
Which KPIs Can You Track in Footwear Manufacturing?
Click to Purchases Footwear Manufacturing KPI Dashboard in Excel
Footwear manufacturers can monitor various operational metrics, including:
Production KPIs
-
Units produced per day
-
Production efficiency %
-
Line productivity
-
Machine utilization rate
Quality KPIs
-
Defect rate
-
Rework percentage
-
First-pass yield
-
Quality inspection score
Delivery KPIs
-
On-time delivery %
-
Order completion rate
-
Lead time performance
Cost KPIs
-
Cost per pair
-
Labor cost efficiency
-
Material utilization rate
Tracking these KPIs ensures balanced operational performance.
How Does the Dashboard Improve Decision-Making?
When managers rely on manual reports, they often react late. However, dashboards enable proactive decision-making.
Instant Visibility
Managers instantly see performance results.
Faster Problem Detection
Teams quickly identify declining KPIs.
Data-Driven Strategy
Leadership makes decisions based on numbers instead of assumptions.
Continuous Improvement
Regular tracking encourages operational discipline.
Advantages of Footwear Manufacturing KPI Dashboard in Excel
Implementing this dashboard provides several operational benefits.
✅ Centralized Performance Monitoring
All KPIs remain available in one location.
✅ Easy to Use
Excel familiarity reduces training requirements.
✅ Cost-Effective Solution
Organizations avoid expensive ERP analytics tools.
✅ Real-Time Updates
Dashboard updates automatically after data entry.
✅ Visual Insights
Charts and indicators simplify analysis.
✅ Better Accountability
Departments track responsibilities clearly.
How to Implement the Footwear Manufacturing KPI Dashboard?
Follow these steps for successful implementation.
Step 1: Define KPIs
Select manufacturing KPIs aligned with business goals.
Step 2: Enter KPI Definitions
Populate the KPI Definition sheet.
Step 3: Set Targets
Define monthly and yearly targets.
Step 4: Input Actual Data
Enter production numbers regularly.
Step 5: Review Dashboard
Analyze performance trends weekly or monthly.
Step 6: Take Corrective Actions
Improve weak-performing areas immediately.
Best Practices for the Footwear Manufacturing KPI Dashboard
Click to Purchases Footwear Manufacturing KPI Dashboard in Excel
Organizations achieve better results when they follow structured practices.
✔ Update Data Regularly
Always maintain consistent data entry schedules.
✔ Focus on Actionable KPIs
Track only KPIs that influence decisions.
✔ Maintain Data Accuracy
Validate numbers before entry.
✔ Use Monthly Reviews
Conduct performance meetings using dashboard insights.
✔ Train Team Members
Ensure everyone understands KPI definitions.
✔ Compare Trends
Always analyze YTD and Previous Year comparisons.
Common Challenges in KPI Tracking (And How to Solve Them)
Challenge 1: Data Inconsistency
Solution: Standardize data entry formats.
Challenge 2: Too Many KPIs
Solution: Focus on critical performance metrics.
Challenge 3: Lack of Ownership
Solution: Assign KPI responsibility to departments.
Challenge 4: Irregular Updates
Solution: Schedule fixed reporting timelines.
Why Excel Is Still Powerful for Manufacturing Dashboards?
Although advanced analytics tools exist, Excel remains highly effective.
Because:
-
Most teams already use Excel.
-
Implementation requires minimal cost.
-
Customization remains flexible.
-
Automation features simplify reporting.
Therefore, Excel dashboards provide excellent value for manufacturing businesses.
Who Can Benefit from This Dashboard?
This dashboard supports multiple roles:
-
Factory Managers
-
Production Supervisors
-
Quality Control Teams
-
Operations Managers
-
Business Owners
-
Supply Chain Analysts
Each stakeholder gains insights relevant to their responsibilities.
Future Improvements You Can Add
Organizations can further enhance dashboards by adding:
-
Power Query automation
-
VBA data entry forms
-
Automated alerts
-
Department-wise dashboards
-
Forecasting models
These additions increase analytical capability over time.
Conclusion: Why Every Footwear Manufacturer Needs a KPI Dashboard
Footwear manufacturing demands precision, efficiency, and continuous monitoring. Companies that rely on manual tracking often struggle with delayed insights and inconsistent performance evaluation.
However, the Footwear Manufacturing KPI Dashboard in Excel simplifies performance tracking by centralizing KPIs, automating calculations, and providing clear visual insights.
As a result, organizations improve productivity, reduce defects, and make smarter decisions.
Therefore, implementing this dashboard helps footwear manufacturers move toward data-driven operations and sustainable growth.
Frequently Asked Questions (FAQs)
Click to Purchases Footwear Manufacturing KPI Dashboard in Excel
What is a KPI dashboard in footwear manufacturing?
A KPI dashboard tracks production, quality, delivery, and cost metrics in one visual interface, helping managers monitor factory performance efficiently.
Is Excel suitable for manufacturing KPI tracking?
Yes. Excel provides flexible customization, automation features, and cost-effective reporting capabilities suitable for small and medium manufacturers.
How often should KPI data be updated?
Teams should update data monthly or weekly depending on operational requirements.
Can beginners use this dashboard?
Yes. The dashboard uses structured sheets and dropdown selections, making it easy for beginners to operate.
What type of KPIs should footwear factories track?
Factories should track production efficiency, defect rate, delivery performance, machine utilization, and cost efficiency KPIs.
Can this dashboard compare previous year performance?
Yes. The template includes a dedicated Previous Year sheet for year-over-year comparison.
Does the dashboard support trend analysis?
Yes. The KPI Trend sheet displays MTD and YTD trends for Actual, Target, and Previous Year values.
Visit our YouTube channel to learn step-by-step video tutorials