Modern libraries and archives manage vast collections, growing memberships, operational costs, and user engagement activities every day. However, many institutions still rely on static reports and manual spreadsheets to track performance. As a result, decision-makers struggle to understand trends, optimize budgets, and improve visitor experiences.
Therefore, organizations now need a smarter and more interactive way to monitor performance. A Libraries and Archives Dashboard in Power BI solves this challenge by transforming raw institutional data into clear visuals and actionable insights.
In this comprehensive guide, you will learn everything about the Libraries and Archives Dashboard in Power BI, including its features, benefits, dashboard structure, best practices, implementation methods, and frequently asked questions.
Click to Purchases Libraries and Archives Dashboard in Power BI
What Is a Libraries and Archives Dashboard in Power BI?
A Libraries and Archives Dashboard in Power BI is an interactive analytics solution designed to monitor library operations, archival activities, membership growth, operational costs, and user satisfaction through dynamic visual reports.
Instead of analyzing multiple disconnected spreadsheets, administrators can view performance indicators in one centralized dashboard. Moreover, Power BI automatically updates visuals when data changes, which allows teams to make faster and smarter decisions.
Because Power BI supports filters, slicers, drill-downs, and visual analytics, users can explore data from multiple perspectives without technical complexity.
Why Do Libraries and Archives Need a Data Dashboard?
Libraries today function as community hubs, research centers, and digital resource providers. Consequently, managing performance manually creates several challenges.
Common Problems Without a Dashboard
-
Data remains scattered across systems
-
Reporting consumes excessive time
-
Budget tracking lacks transparency
-
Visitor trends remain unclear
-
Decision-making becomes reactive instead of proactive
However, when institutions implement a Power BI dashboard, they gain clarity and control over operations.
Key Goals Achieved
-
Track membership growth easily
-
Monitor operating costs efficiently
-
Analyze collection usage trends
-
Measure visitor satisfaction
-
Improve strategic planning
Therefore, a dashboard does not only visualize data—it improves institutional performance.
Key Features of Libraries and Archives Dashboard in Power BI
This dashboard includes five powerful analytical pages, each designed to answer specific operational questions. Let’s explore each page in detail.
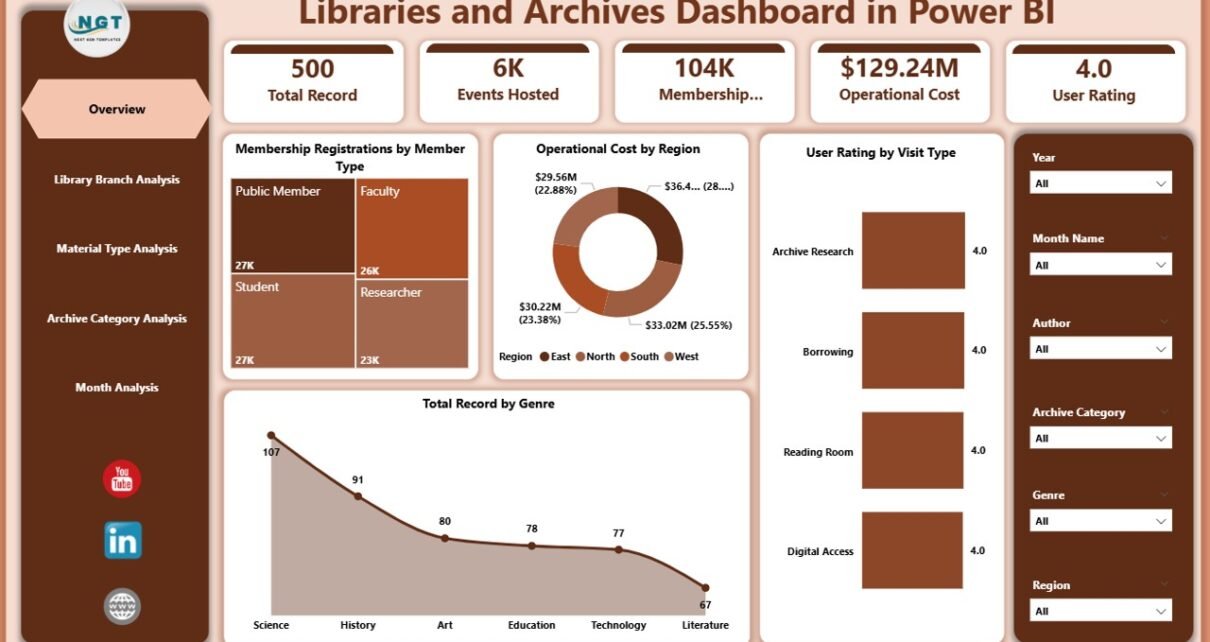
1. Overview Page – How Can You See Overall Performance Instantly?
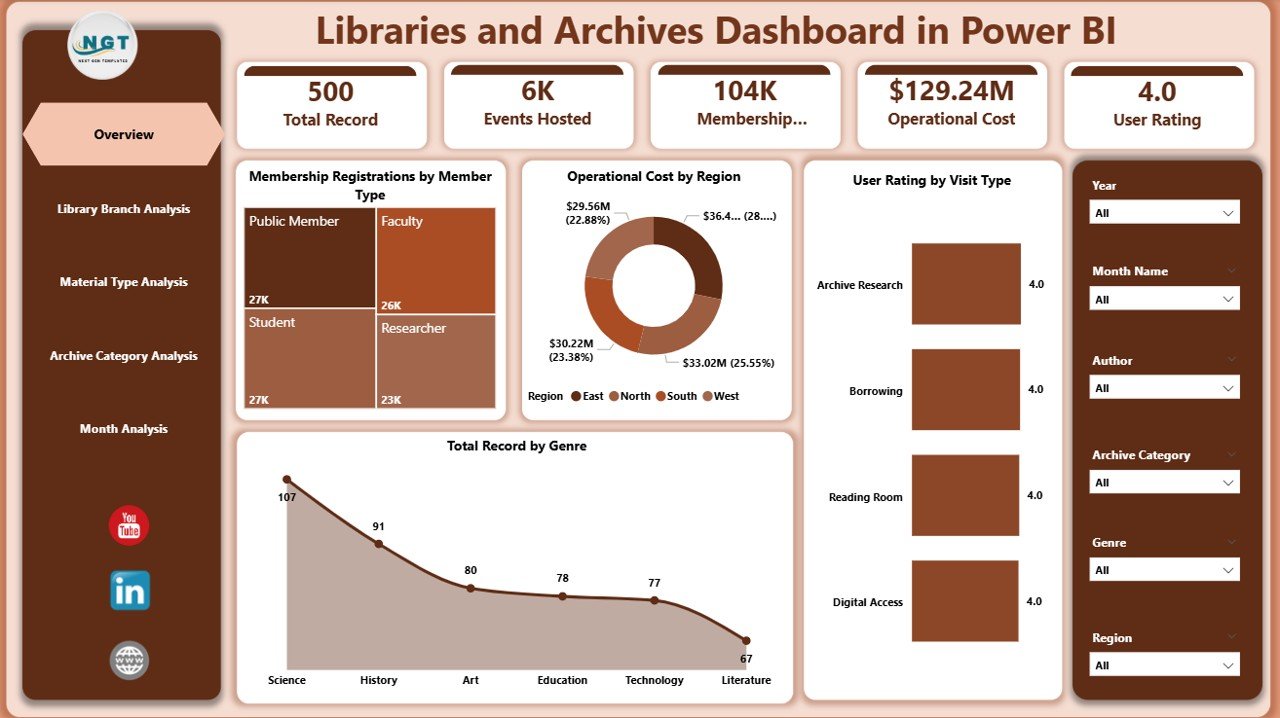
The Overview Page acts as the central command center of the dashboard. It provides a quick snapshot of major performance indicators.
Main Visual Elements
-
Membership Registration by Member Type
-
Operating Cost by Region
-
User Rating by Visit Type
-
Total Records by Genre
-
Interactive slicers for dynamic filtering
Because administrators often need quick insights, this page highlights essential metrics using cards and charts.
Why This Page Matters
-
Enables instant performance review
-
Helps leadership understand trends quickly
-
Supports high-level decision-making
Moreover, users can apply slicers to analyze data by period, region, or category within seconds.
2. Library Branch Analysis – Which Branch Performs Best?
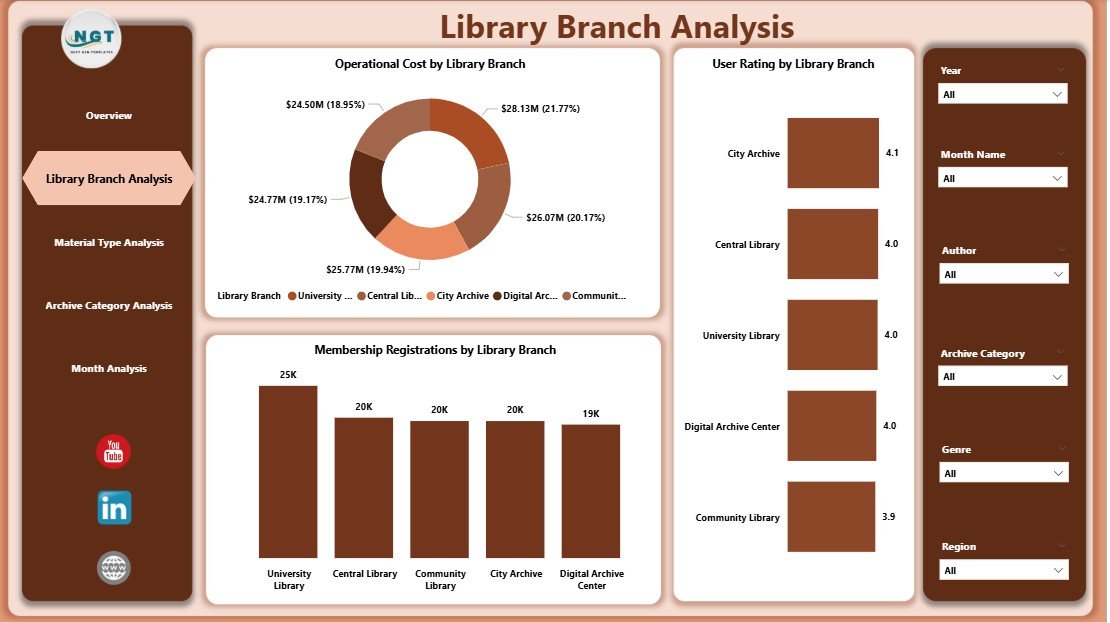
The Library Branch Analysis page focuses on comparing performance across different branches.
Included Charts
-
Membership Registration by Library Branch
-
Operating Cost by Library Branch
-
User Rating by Library Branch
Through these visuals, managers can easily identify high-performing branches and areas requiring improvement.
Insights You Can Gain
-
Which branch attracts the most members?
-
Where do operating costs increase?
-
Which location receives the highest user satisfaction?
Therefore, branch managers can allocate resources more effectively.
3. Material Type Analysis – Which Resources Do Users Prefer?
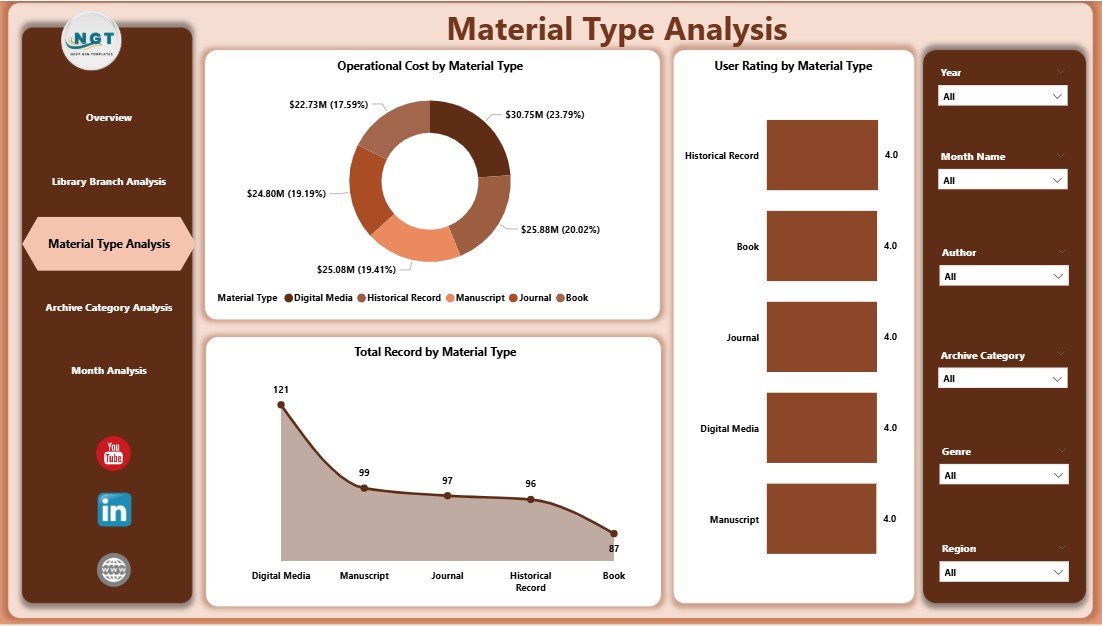
Libraries manage multiple material types such as books, manuscripts, digital archives, audio recordings, and journals. Consequently, understanding usage patterns becomes essential.
Dashboard Visuals
-
Total Records by Material Type
-
Operating Cost by Material Type
-
User Rating by Material Type
Benefits of This Analysis
-
Identify popular materials
-
Optimize acquisition budgets
-
Improve collection planning
For example, if digital resources show higher engagement, administrators can prioritize digital investments.
Click to Purchases Libraries and Archives Dashboard in Power BI
4. Archive Category Analysis – How Do Archive Categories Perform?
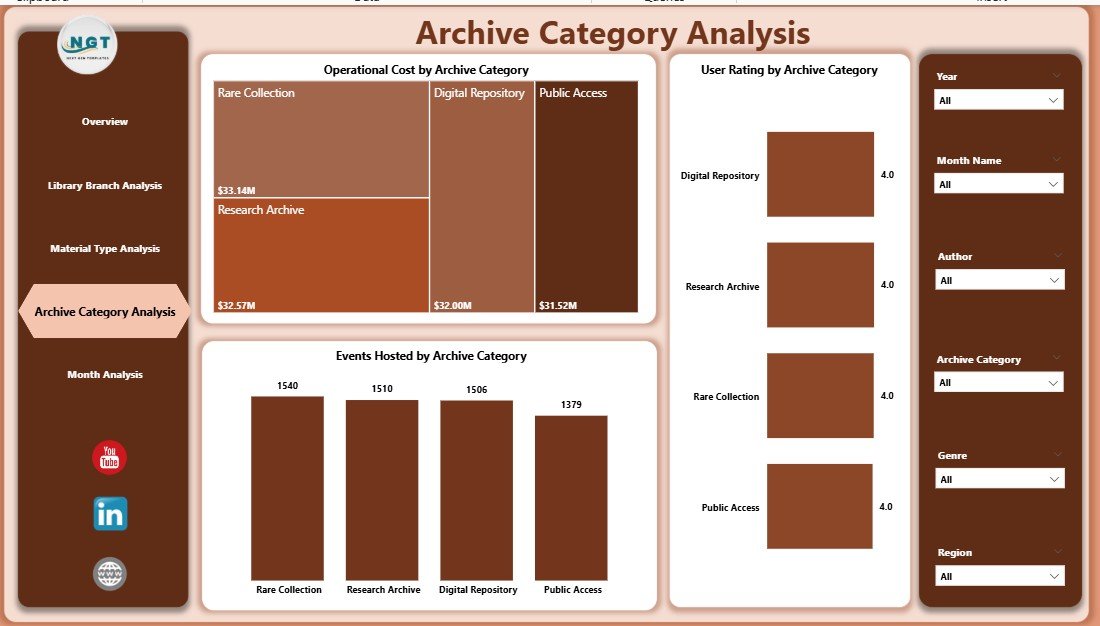
Archives preserve historical and cultural records. However, institutions must evaluate engagement levels to justify preservation investments.
Charts Included
-
Event Hosting by Archive Category
-
Operating Cost by Archive Category
-
User Rating by Archive Category
Why This Analysis Helps
-
Measures archival engagement
-
Evaluates event impact
-
Supports cultural program planning
As a result, archivists can align programs with audience interests.
5. Month Analysis – What Trends Appear Over Time?
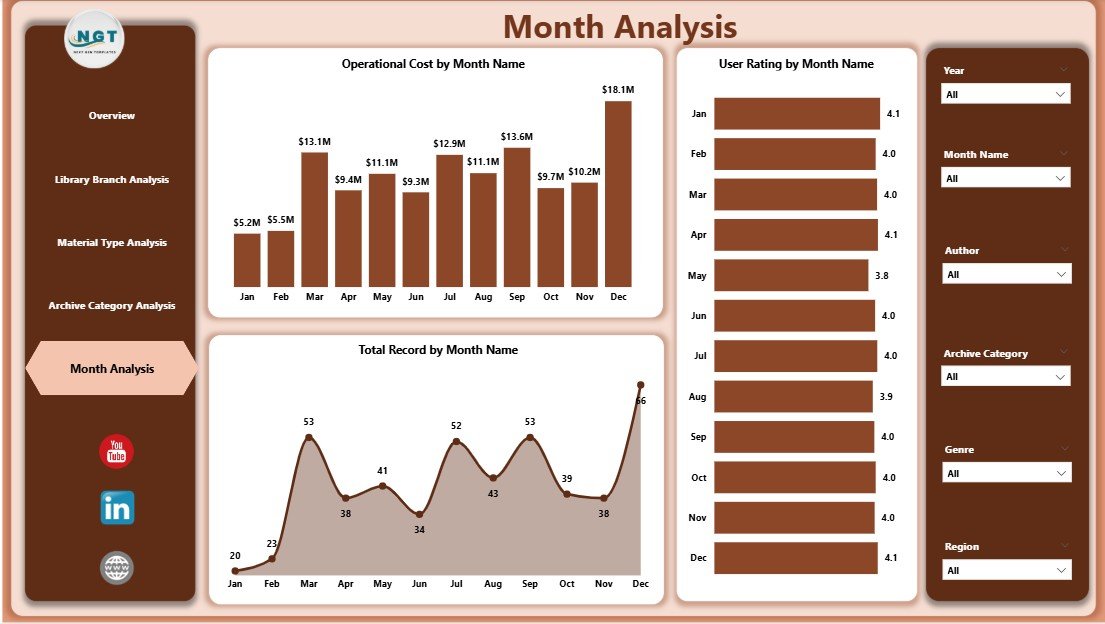
The Month Analysis Page highlights performance trends across the year.
Monthly Metrics
-
Total Records by Month
-
Operating Cost by Month
-
User Rating by Month
Because trends reveal patterns, this page helps administrators forecast demand and manage budgets proactively.
Practical Outcomes
-
Plan seasonal programs
-
Predict visitor traffic
-
Control operational expenses
Therefore, organizations move from reactive planning to predictive management.
How Does Power BI Improve Library and Archive Management?
Power BI transforms traditional reporting into interactive analytics.
Key Capabilities
-
Real-time data updates
-
Interactive filtering
-
Drill-down analysis
-
Automated visualization
-
Cross-department reporting
Additionally, staff members without technical backgrounds can easily explore insights through visuals.
Advantages of Libraries and Archives Dashboard in Power BI
Implementing this dashboard offers several operational and strategic advantages.
📊 Better Decision-Making
-
Provides real-time insights
-
Reduces guesswork
-
Supports data-driven planning
⏱ Saves Reporting Time
-
Automates calculations
-
Eliminates manual reporting
-
Generates instant summaries
💰 Improved Cost Control
-
Tracks operational spending
-
Identifies budget inefficiencies
-
Enables smarter resource allocation
👥 Enhanced User Experience
-
Monitors satisfaction ratings
-
Improves service quality
-
Aligns services with user needs
📈 Strategic Growth Support
-
Identifies growth opportunities
-
Tracks membership trends
-
Supports long-term planning
Therefore, institutions gain both operational efficiency and strategic clarity.
How to Use the Libraries and Archives Dashboard Effectively?
Using the dashboard becomes simple when organizations follow a structured approach.
Step 1: Prepare Data Sources
Collect data from:
-
Library management systems
-
Membership records
-
Cost reports
-
Archive databases
Step 2: Clean and Structure Data
Click to Purchases Libraries and Archives Dashboard in Power BI
Ensure:
-
Consistent naming
-
Accurate categories
-
Complete records
Step 3: Load Data into Power BI
Import datasets and create relationships between tables.
Step 4: Apply Visualizations
Use charts, cards, and slicers to present insights clearly.
Step 5: Share Dashboard
Publish reports securely for stakeholders.
What KPIs Should Libraries Track?
A successful dashboard depends on meaningful KPIs.
Operational KPIs
-
Membership registrations
-
Collection growth
-
Event participation
Financial KPIs
-
Operating cost per branch
-
Cost per material type
-
Budget utilization
User Experience KPIs
-
Visitor satisfaction rating
-
Visit frequency
-
Program participation rate
Because KPIs guide decisions, institutions should review them regularly.
Best Practices for the Libraries and Archives Dashboard in Power BI
Following best practices ensures long-term dashboard success.
✅ Keep Visuals Simple
Use clear charts instead of crowded visuals.
✅ Use Consistent Metrics
Maintain standardized KPI definitions.
✅ Update Data Regularly
Schedule automatic refresh cycles.
✅ Focus on Actionable Insights
Highlight trends that support decisions.
✅ Train Staff Members
Ensure users understand filters and navigation.
✅ Maintain Data Accuracy
Validate data before publishing reports.
By applying these practices, organizations maximize dashboard value.
Common Challenges and How to Overcome Them
Even powerful dashboards face challenges initially.
Data Quality Issues
Solution: Establish data validation processes.
Resistance to Change
Solution: Provide training and demonstrate benefits.
Overloaded Reports
Solution: Focus only on essential KPIs.
Lack of Standardization
Solution: Define consistent reporting rules.
Therefore, proactive planning ensures successful adoption.
Future of Libraries and Archives Analytics
Libraries continue evolving into digital knowledge centers. Consequently, analytics plays a larger role in operations.
Emerging Trends
-
AI-driven recommendations
-
Predictive visitor analytics
-
Digital archive monitoring
-
Cloud-based reporting
-
Automated performance alerts
As technology advances, dashboards will become even more intelligent and proactive.
Who Can Benefit from This Dashboard?
Many stakeholders gain value from this solution.
-
Library administrators
-
Archive managers
-
Government cultural departments
-
Educational institutions
-
Research organizations
-
Community libraries
Because each role requires insights, the dashboard supports organization-wide decision-making.
How Does This Dashboard Support Strategic Planning?
Strategic planning requires reliable data. Fortunately, Power BI provides clarity through visualization.
Planning Benefits
-
Understand resource utilization
-
Identify growth areas
-
Optimize budgets
-
Improve community engagement
Therefore, leadership teams can design evidence-based strategies.
Conclusion
Libraries and archives manage knowledge, culture, and community engagement. However, modern operations demand data-driven management rather than manual reporting.
The Libraries and Archives Dashboard in Power BI transforms complex institutional data into meaningful insights. It allows administrators to monitor memberships, analyze costs, evaluate materials, track archive engagement, and study monthly trends from one interactive platform.
Moreover, the dashboard improves efficiency, enhances user satisfaction, and supports strategic growth. As libraries continue embracing digital transformation, adopting analytics tools like Power BI becomes essential rather than optional.
Organizations that leverage dashboards today will build smarter, more sustainable, and more responsive libraries tomorrow.
Frequently Asked Questions (FAQs)
1. What is the purpose of a Libraries and Archives Dashboard in Power BI?
The dashboard helps institutions track performance metrics such as memberships, operating costs, material usage, and user satisfaction through interactive visuals.
2. Can small libraries use this dashboard?
Yes. Small libraries benefit greatly because the dashboard simplifies reporting and improves decision-making without complex systems.
3. Does Power BI require coding skills?
No. Users can create and interact with dashboards using drag-and-drop features and built-in visuals.
4. How often should the dashboard data update?
Organizations should refresh data weekly or monthly depending on operational needs.
5. Can the dashboard track digital archives?
Yes. You can include digital resource data alongside physical collections for complete analysis.
6. Is Power BI suitable for government or academic libraries?
Absolutely. Many public institutions use Power BI because it supports secure and scalable reporting.
7. What data sources can connect to Power BI?
Power BI connects with Excel, databases, cloud platforms, and library management systems.
8. How does the dashboard improve user experience?
It tracks ratings and engagement patterns, allowing institutions to improve services based on real feedback.
Visit our YouTube channel to learn step-by-step video tutorials