Modern supply chains generate massive volumes of operational data every single day. Companies manage shipments, warehouses, transportation costs, delivery timelines, fuel expenses, and insurance charges across multiple regions and customers. However, many organizations still struggle to transform logistics data into actionable insights.
As a result, managers often depend on manual spreadsheets and disconnected reports. Consequently, decision-making becomes slow, operational costs increase, and delivery performance declines. Therefore, businesses now adopt intelligent analytics tools that provide real-time visibility into logistics operations.
A Logistics Dashboard in Power BI offers exactly that solution. It converts complex logistics data into interactive visuals, helping organizations monitor costs, improve delivery performance, and optimize supply chain efficiency.
In this comprehensive guide, you will learn everything about the Logistics Dashboard in Power BI — including its structure, features, advantages, best practices, and real-world applications.
Click to buy Logistics Dashboard in Power BI
What Is a Logistics Dashboard in Power BI?
A Logistics Dashboard in Power BI is an interactive business intelligence solution designed to analyze logistics operations using dynamic charts, KPIs, and filters.
Instead of reviewing multiple reports, decision-makers can view logistics performance on a single screen. Moreover, Power BI connects multiple datasets and transforms them into meaningful visual insights.
Typically, the dashboard tracks:
- Logistics costs
- Freight expenses
- Fuel consumption
- Handling charges
- Insurance costs
- Shipment performance
- Delivery delays
- Regional logistics trends
Because Power BI updates visuals automatically, organizations gain real-time operational visibility.
Why Do Businesses Need a Logistics Dashboard?
Logistics operations involve many moving parts. Therefore, tracking performance manually becomes difficult as operations scale.
Without a structured dashboard:
- Cost leaks remain unnoticed.
- Delivery delays increase.
- Regional inefficiencies stay hidden.
- Managers spend hours preparing reports.
However, when companies implement a Logistics Dashboard in Power BI, they immediately gain transparency and control.
Key Business Challenges Solved
- Lack of centralized logistics data
- Poor cost monitoring
- Limited delivery performance visibility
- Manual reporting delays
- Difficulty comparing regions and carriers
As a result, organizations improve operational efficiency and reduce logistics expenses.
Key Features of the Logistics Dashboard in Power BI
This Logistics Dashboard contains five interactive pages within the Power BI Desktop application. Each page focuses on a specific logistics analysis area.
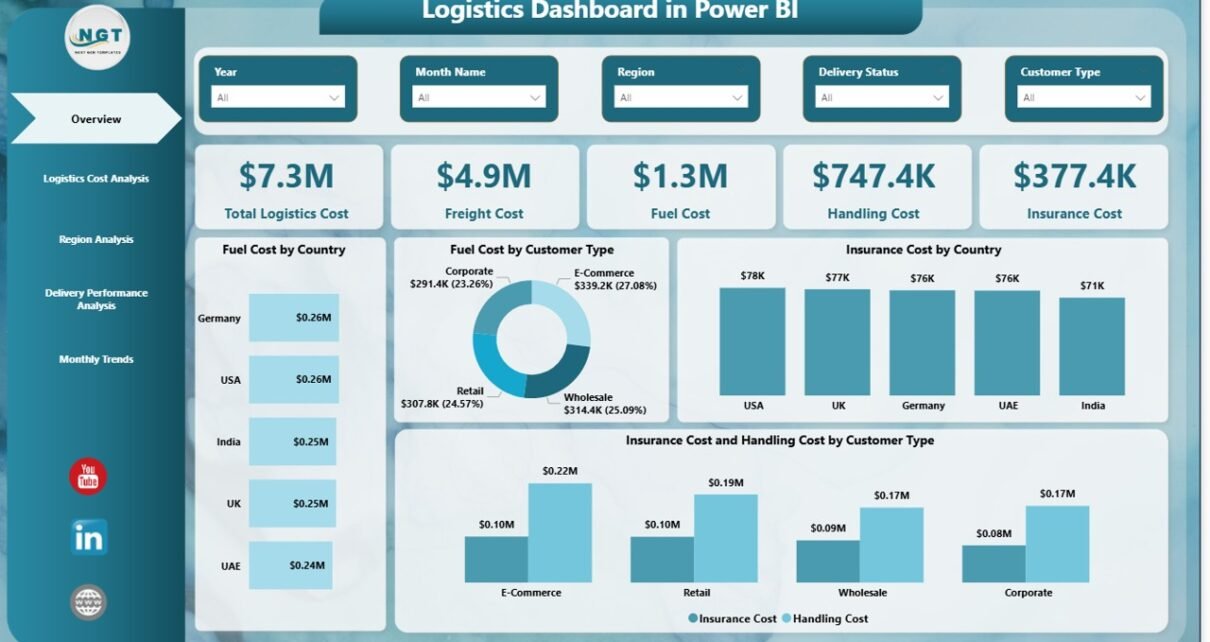
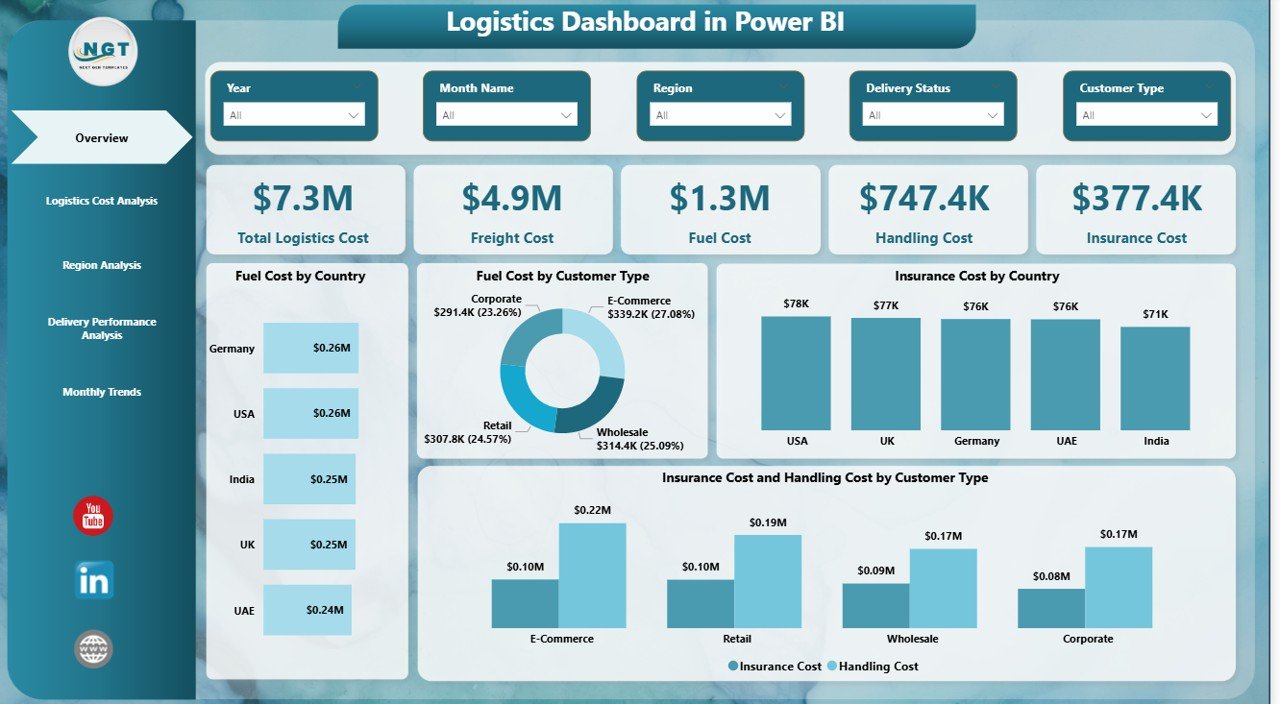
Overview Page – The Central Control Panel
The Overview Page works as the main dashboard interface. Users can quickly understand logistics performance through summarized KPIs and visuals.
KPI Cards
- Total Logistics Cost
- Freight Cost
- Fuel Cost
- Handling Cost
- Insurance Cost
These KPI cards provide instant performance insights.
Charts Included
- Fuel Cost by Country
- Fuel Cost by Customer Type
- Insurance Cost by Country
- Insurance & Handling Cost by Customer Type
Additionally, slicers allow users to filter data dynamically, enabling deeper analysis within seconds.
Click to buy Logistics Dashboard in Power BI
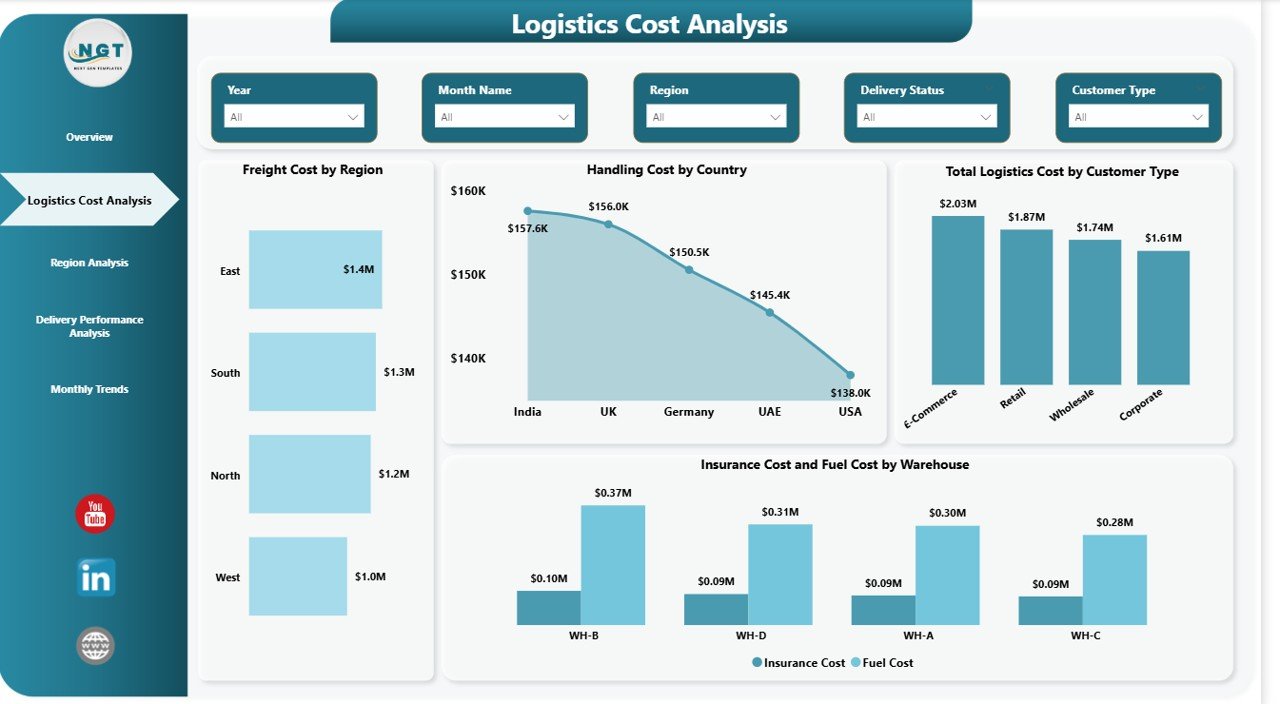
Logistics Cost Analysis – Where Is Money Being Spent?
Cost control remains one of the biggest priorities in logistics management. Therefore, this page focuses entirely on cost breakdown analysis.
Charts Available
- Freight Cost by Region
- Handling Cost by Country
- Total Logistics Cost by Customer Type
- Insurance Cost & Fuel Cost by Warehouse
Managers can easily identify:
- High-cost regions
- Expensive warehouses
- Customer segments generating higher logistics expenses
Consequently, organizations can implement targeted cost optimization strategies.
Click to buy Logistics Dashboard in Power BI
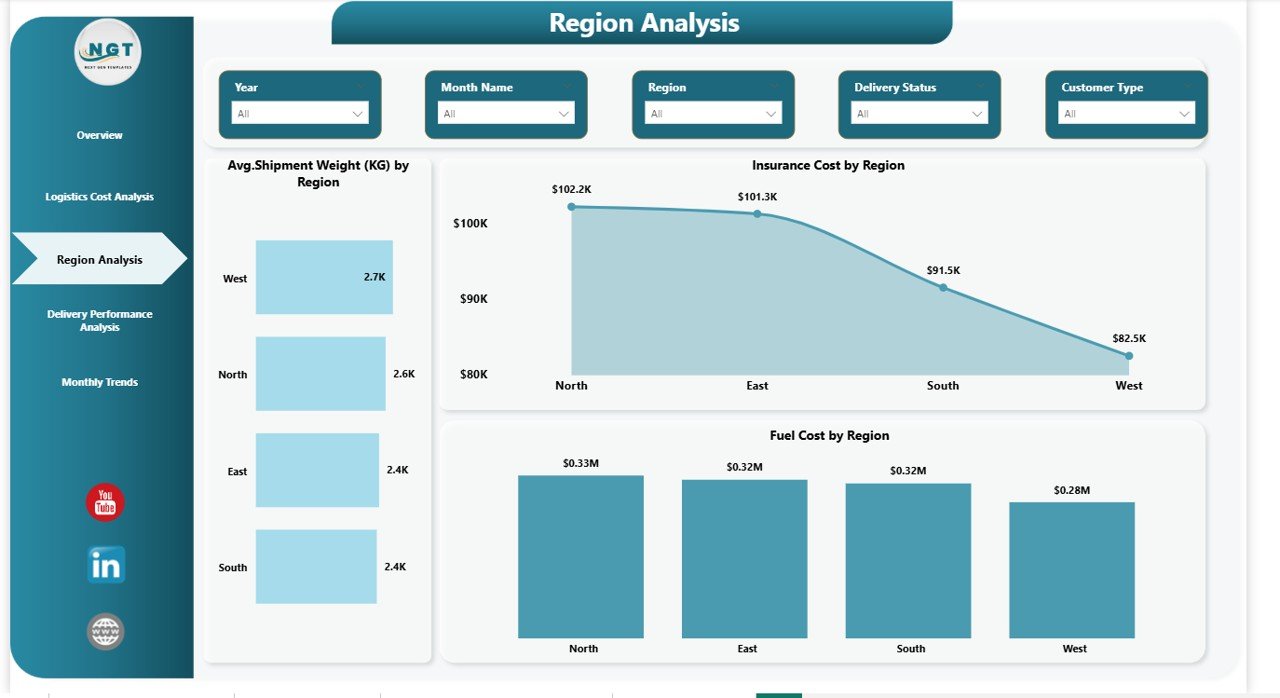
Region Analysis – Understanding Geographic Performance
Regional performance plays a critical role in supply chain efficiency. Hence, this page analyzes logistics operations across different regions.
Visuals Included
- Average Shipment Weight (kg) by Region
- Insurance Cost by Region
- Fuel Cost by Region
Through these insights, companies can:
- Compare regional efficiency
- Adjust transportation strategies
- Optimize shipment distribution
As a result, logistics managers improve planning accuracy.
Click to buy Logistics Dashboard in Power BI
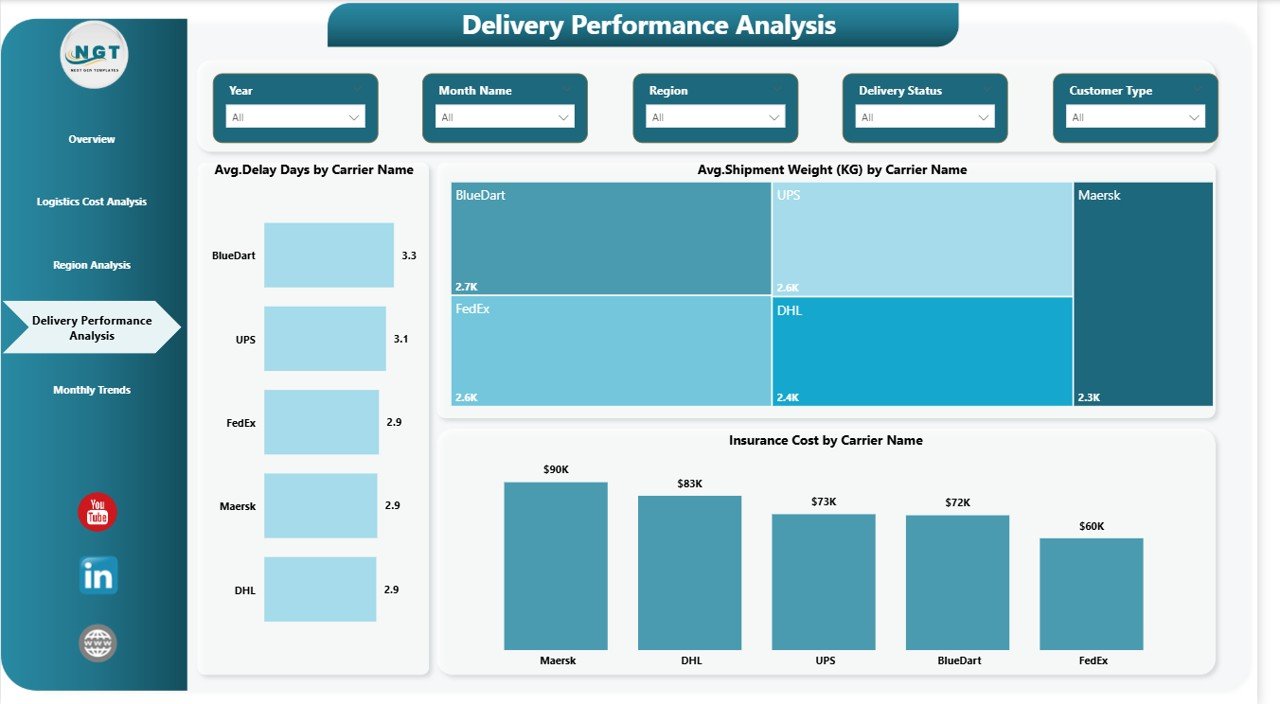
Delivery Performance Analysis – Measuring Operational Efficiency
Delivery performance directly impacts customer satisfaction. Therefore, monitoring shipment delays and carrier performance becomes essential.
Charts Included
- Average Delay Days by Carrier Name
- Average Shipment Weight by Carrier Name
- Insurance Analysis by Carrier
This analysis helps organizations:
- Identify unreliable carriers
- Improve delivery timelines
- Reduce penalty costs
- Enhance customer experience
Moreover, performance comparisons encourage data-driven carrier selection.
Click to buy Logistics Dashboard in Power BI
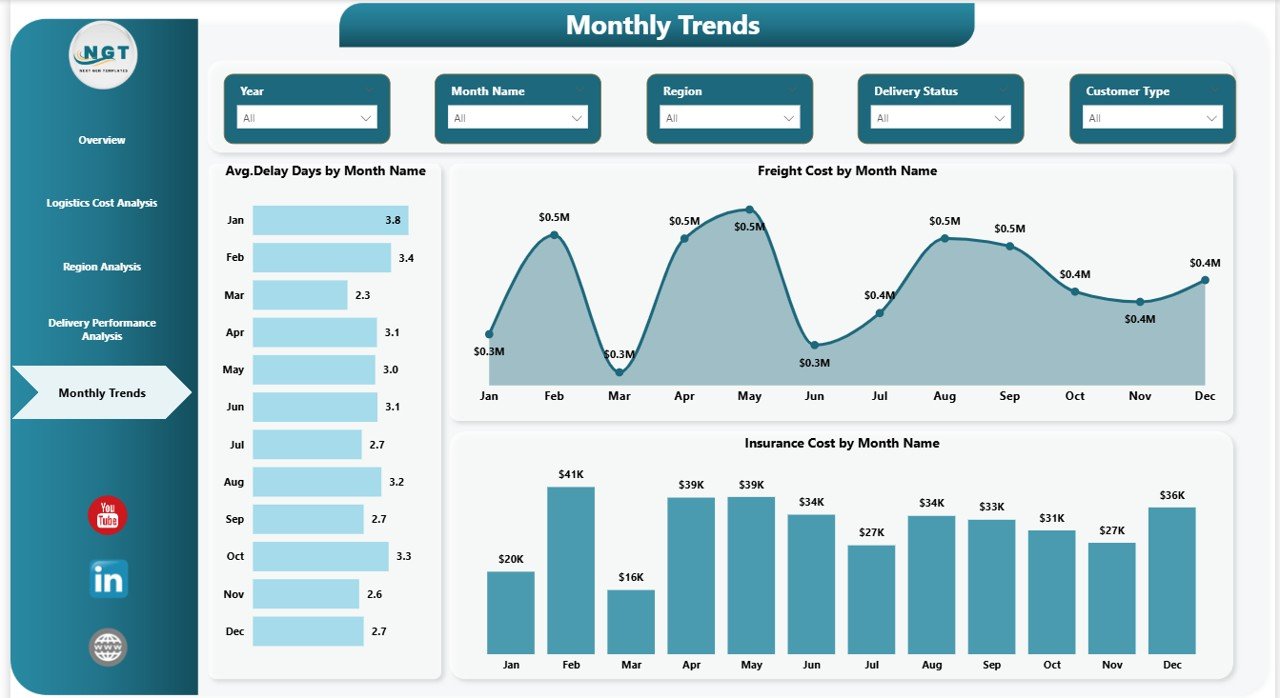
Monthly Trends – Tracking Logistics Patterns Over Time
Trend analysis helps businesses forecast future logistics performance.
Charts Included
- Average Delay Days by Month
- Freight Cost by Month
- Insurance Cost by Month
Because trends reveal seasonal patterns, companies can plan budgets and logistics capacity more effectively.
Click to buy Logistics Dashboard in Power BI
How Does a Logistics Dashboard Improve Decision-Making?
A well-designed dashboard transforms raw logistics data into insights. Consequently, leaders make faster and smarter decisions.
Decision-Making Benefits
- Instant KPI visibility
- Real-time cost tracking
- Performance comparison across regions
- Faster issue identification
- Accurate forecasting
Instead of guessing, managers rely on data-backed insights.
Advantages of Logistics Dashboard in Power BI
Organizations experience several benefits after implementing this dashboard.
Centralized Data Visibility
All logistics metrics appear in one unified platform.
Real-Time Monitoring
Users view updated performance instantly.
Cost Optimization
Managers identify unnecessary expenses quickly.
Improved Delivery Performance
Teams monitor delays and carrier efficiency continuously.
Interactive Analysis
Filters and slicers allow flexible exploration.
Faster Reporting
Automated dashboards eliminate manual report preparation.
Better Strategic Planning
Historical trends support future logistics planning.
Who Can Benefit from a Logistics Dashboard?
Many industries depend heavily on logistics operations.
Primary Users
- Supply Chain Managers
- Logistics Coordinators
- Warehouse Managers
- Transportation Teams
- Finance Analysts
- Operations Leaders
Industries That Benefit
- Manufacturing
- Retail & E-commerce
- Distribution Companies
- FMCG Businesses
- Import & Export Firms
- Third-Party Logistics Providers
How to Use a Logistics Dashboard in Power BI Effectively?
Although dashboards provide insights automatically, users must follow structured steps.
Step 1: Connect Data Sources
Import logistics data such as shipment records, fuel expenses, and carrier information.
Step 2: Clean and Prepare Data
Ensure consistent formats and remove duplicate records.
Step 3: Define KPIs
Set measurable logistics indicators like delay days or cost per shipment.
Step 4: Use Filters and Slicers
Analyze performance by region, customer type, or warehouse.
Step 5: Monitor Trends Regularly
Review monthly trends to detect operational changes early.
Best Practices for the Logistics Dashboard in Power BI
To maximize dashboard value, organizations should follow proven practices.
Keep KPIs Clear and Relevant
Avoid overcrowding visuals with unnecessary metrics.
Maintain Data Accuracy
Update data sources regularly.
Use Standard Cost Definitions
Ensure teams calculate logistics costs consistently.
Focus on Actionable Insights
Design visuals that support decisions, not just reporting.
Monitor Performance Frequently
Schedule weekly or monthly performance reviews.
Optimize Visual Layout
Place critical KPIs at the top for quick visibility.
Train Users
Educate teams on interpreting dashboard insights.
Common Logistics KPIs Tracked in Power BI
A strong dashboard measures meaningful indicators.
Cost KPIs
- Total Logistics Cost
- Freight Cost per Shipment
- Fuel Expense Ratio
- Insurance Cost Percentage
Performance KPIs
- Average Delivery Delay
- Shipment Weight Efficiency
- Carrier Performance Score
Operational KPIs
- Warehouse Cost Efficiency
- Regional Shipment Volume
- Monthly Cost Trend
Real-World Use Cases of Logistics Dashboard
Manufacturing Companies
Track transportation costs and optimize shipping routes.
E-commerce Businesses
Monitor delivery timelines and customer fulfillment performance.
Logistics Service Providers
Evaluate carrier performance and pricing efficiency.
Global Supply Chains
Compare logistics performance across countries.
How Does Power BI Make Logistics Analytics Powerful?
Power BI provides advanced capabilities that traditional reporting tools cannot match.
Key Power BI Advantages
- Interactive dashboards
- Drill-down analysis
- Real-time data refresh
- Automated reporting
- Cloud sharing capabilities
- Mobile dashboard access
Therefore, teams can access logistics insights anytime and anywhere.
Future Trends in Logistics Analytics
Logistics analytics continues evolving rapidly.
Emerging Trends
- AI-driven demand forecasting
- Predictive delivery analytics
- Automated route optimization
- IoT-based shipment tracking
- Sustainability tracking dashboards
As technology advances, dashboards will become even more intelligent.
Conclusion
A Logistics Dashboard in Power BI transforms logistics management from reactive reporting into proactive decision-making. Instead of analyzing scattered spreadsheets, organizations gain a centralized, real-time view of logistics costs and delivery performance.
Moreover, interactive visuals allow managers to identify inefficiencies instantly. As a result, companies reduce operational expenses, improve delivery reliability, and strengthen customer satisfaction.
Therefore, businesses that adopt logistics analytics today build a competitive advantage for tomorrow’s supply chains.
Frequently Asked Questions (FAQs)
What is a Logistics Dashboard in Power BI used for?
It helps organizations monitor logistics costs, delivery performance, shipment trends, and regional operations using interactive analytics.
Can small businesses use this dashboard?
Yes. Small and medium businesses benefit greatly because Power BI simplifies complex logistics analysis.
Does the dashboard update automatically?
Yes. Power BI refreshes data automatically when connected to updated sources.
What data is required to build a logistics dashboard?
You need shipment data, cost details, carrier information, regional data, and delivery performance records.
How often should companies review logistics dashboards?
Organizations should review dashboards weekly or monthly to track performance effectively.
Is Power BI suitable for logistics analytics?
Yes. Power BI provides powerful visualization, automation, and real-time analytics capabilities ideal for logistics management.
Visit our YouTube channel to learn step-by-step video tutorials
Watch the step-by-step video tutorial:
Click to buy Logistics Dashboard in Power BI