Fashion retail moves fast. Trends change quickly, customer preferences evolve every season, and competition grows every day. Therefore, boutique owners and fashion retailers must track performance continuously. However, many boutiques still rely on manual spreadsheets and scattered reports. As a result, decision-making becomes slow and inaccurate.
So, how can fashion boutiques monitor sales, profit, and performance in one place?
The answer is a Fashion Boutiques Dashboard in Power BI — a modern analytics solution that transforms raw retail data into clear, interactive insights.
In this complete guide, you will learn everything about the Fashion Boutiques Dashboard in Power BI, including its features, structure, benefits, analysis capabilities, best practices, and frequently asked questions.
Click to Purchases Fashion Boutiques Dashboard in Power BI
What Is a Fashion Boutiques Dashboard in Power BI?
A Fashion Boutiques Dashboard in Power BI is an interactive business intelligence dashboard designed to monitor boutique sales performance, profitability, product trends, and customer behavior using visual analytics.
Instead of reviewing multiple Excel files, managers can analyze all important KPIs from a centralized dashboard. Consequently, teams identify performance gaps faster and take data-driven actions immediately.
Power BI connects boutique sales data with visual charts, slicers, and filters. Therefore, users can explore performance by:
-
Boutique name
-
Product category
-
Sales channel
-
Region
-
Month
-
Customer segment
Because Power BI updates visuals dynamically, even non-technical users can analyze business performance easily.
Why Do Fashion Boutiques Need a Dashboard?
Fashion boutiques operate in a highly competitive environment. While creativity drives fashion, data drives profitability.
Without analytics, boutiques often face:
-
Unclear profit visibility
-
Overstock or understock problems
-
Poor sales forecasting
-
Inefficient marketing decisions
-
Slow reporting cycles
However, when boutiques adopt a Power BI dashboard, they gain real-time performance insights.
Common Challenges Without Analytics
-
Sales data scattered across systems
-
No centralized reporting
-
Difficult performance comparison
-
Manual report preparation
-
Limited visibility into profitable products
Therefore, dashboards become essential tools for modern retail management.
How Does Power BI Improve Boutique Decision-Making?
Click to Purchases Fashion Boutiques Dashboard in Power BI
Power BI converts complex retail data into easy visuals. As a result, boutique owners quickly understand business performance.
Key Improvements Include
-
Faster sales analysis
-
Better inventory planning
-
Accurate profit tracking
-
Customer behavior understanding
-
Improved sales strategy
Moreover, interactive slicers allow managers to filter results instantly, which saves time and improves clarity.
Key Features of the Fashion Boutiques Dashboard in Power BI
This dashboard contains five powerful analytical pages, each focusing on a specific business area.
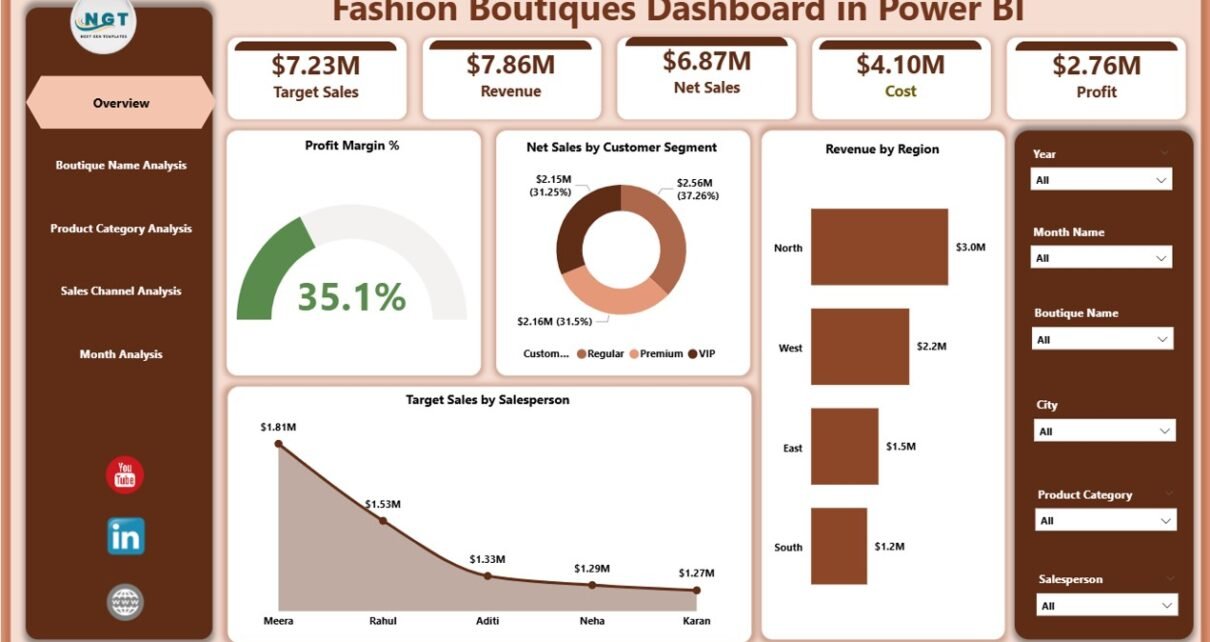
1️⃣ Overview Page – Complete Business Snapshot
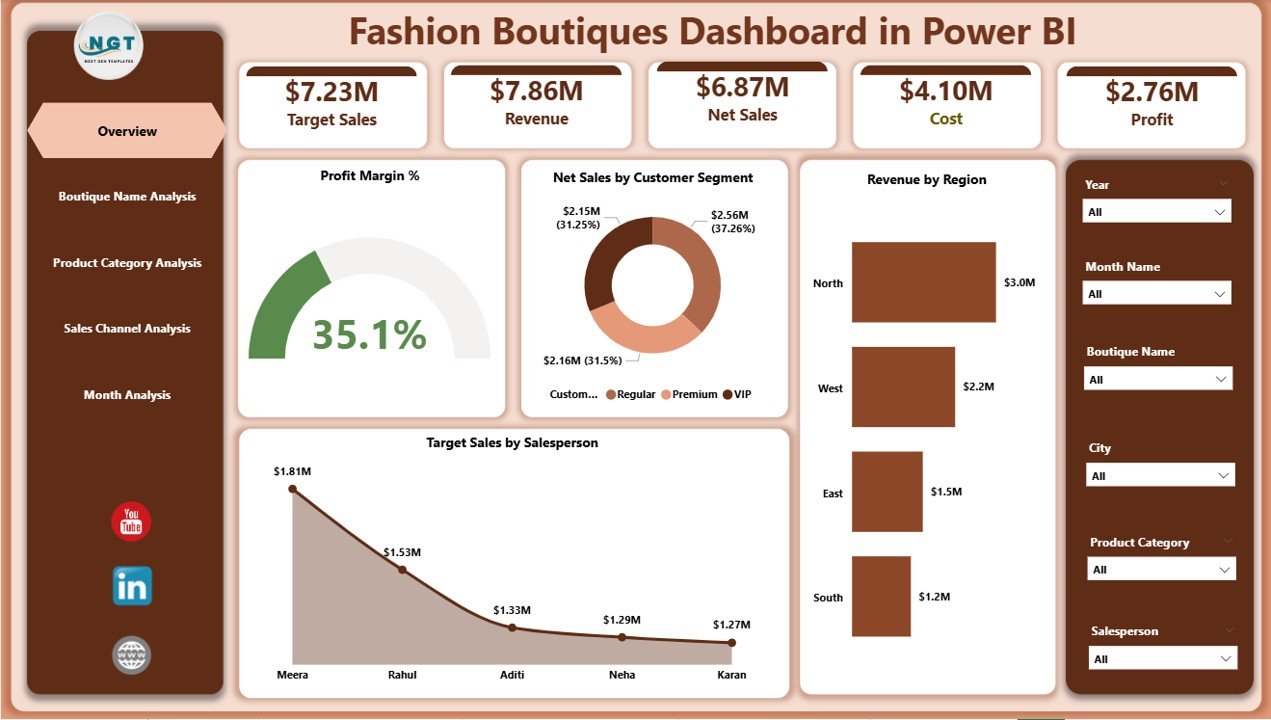
The Overview Page acts as the main control center of the dashboard.
Here, users immediately understand overall business health.
Key Elements
-
Interactive slicers for filtering data
-
KPI cards showing:
-
Profit Margin %
-
Net Sales by Customer Segment
-
Revenue by Region
-
Target Sales by Salesperson
-
Overall performance indicators
-
What Insights Can You Get?
-
Which region generates maximum revenue?
-
Are sales targets achieved?
-
How profitable is the boutique business?
-
Which customer segment contributes most?
Because all KPIs appear on one page, executives make quick strategic decisions.
Click to Purchases Fashion Boutiques Dashboard in Power BI
2️⃣ Boutique Name Analysis – Performance by Store
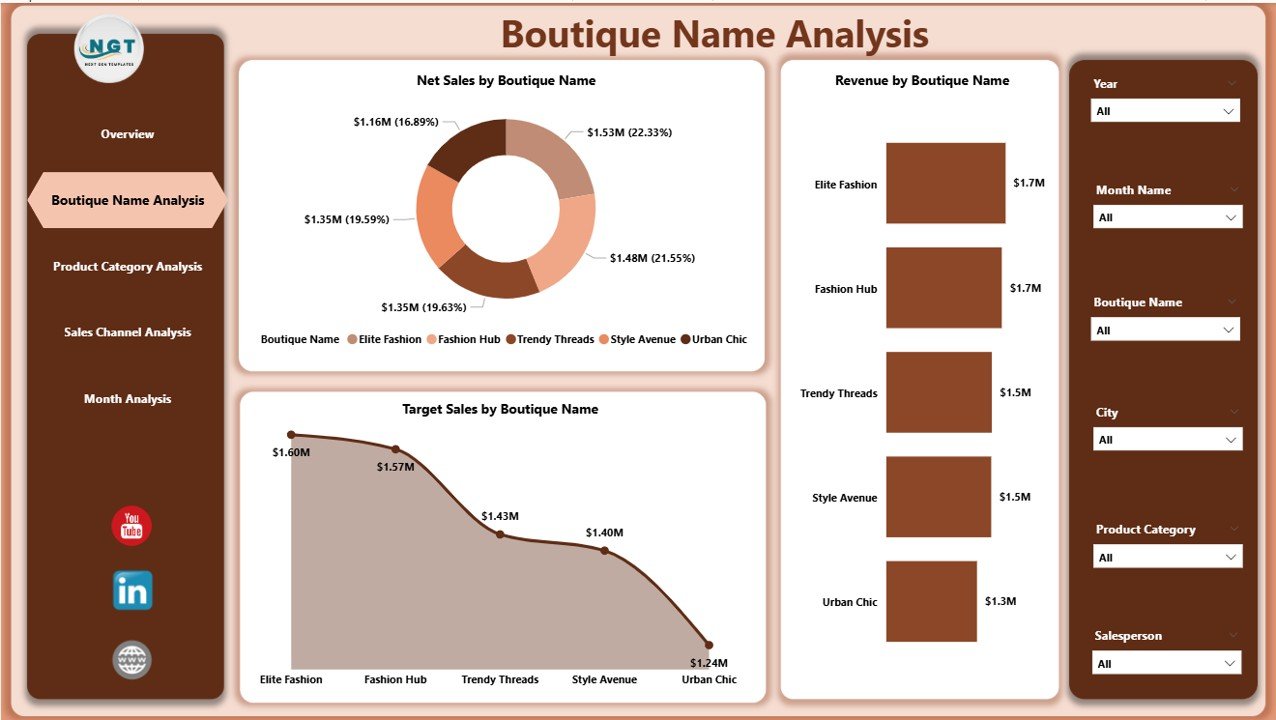
The Boutique Name Analysis Page helps compare performance across multiple boutiques or store locations.
Charts Included
-
Net Sales by Boutique Name
-
Revenue by Boutique Name
-
Target Sales by Boutique Name
Business Value
This page helps answer important questions:
-
Which boutique performs best?
-
Which store misses targets?
-
Where should marketing efforts increase?
Therefore, managers allocate resources more effectively.
3️⃣ Product Category Analysis – Product Profitability Insights
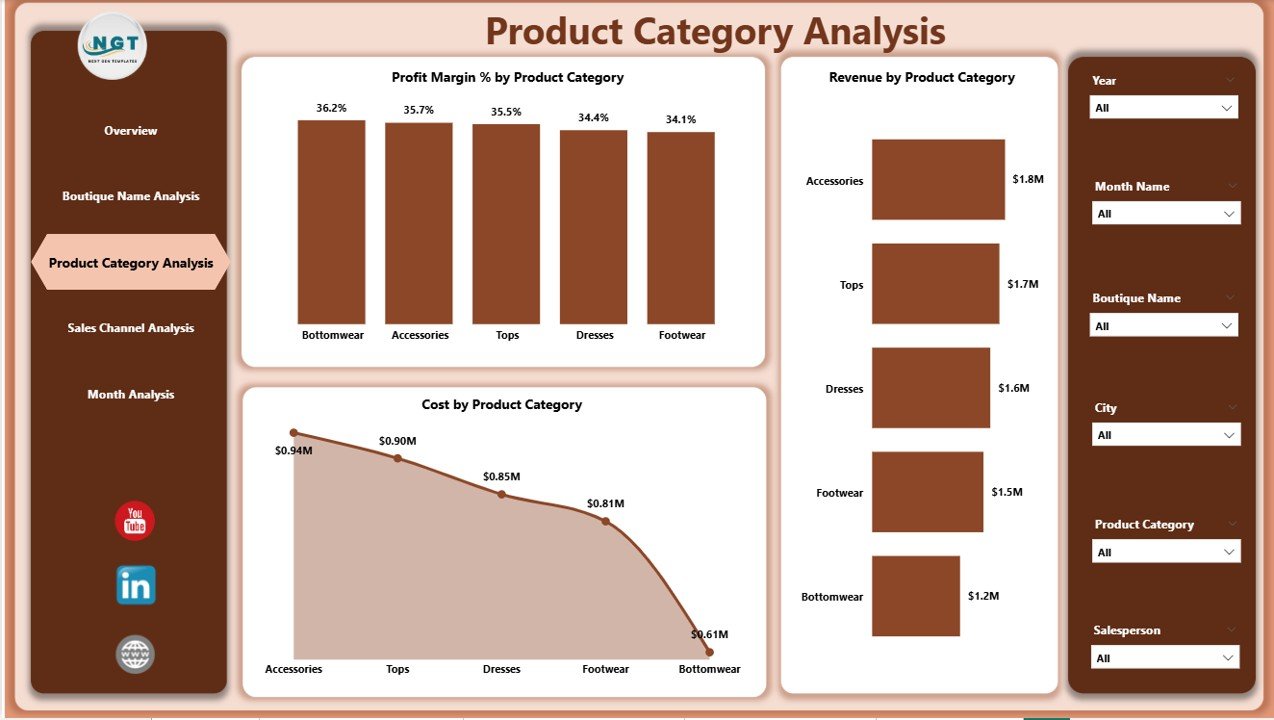
Fashion success depends heavily on product performance. Consequently, category analysis becomes crucial.
Charts Available
-
Profit Margin % by Product Category
-
Revenue by Product Category
-
Cost by Product Category
Insights You Can Discover
-
Which category generates the highest profit?
-
Which products have high costs but low returns?
-
Which categories need promotion?
For example, if accessories show higher margins than apparel, managers can adjust purchasing strategies accordingly.
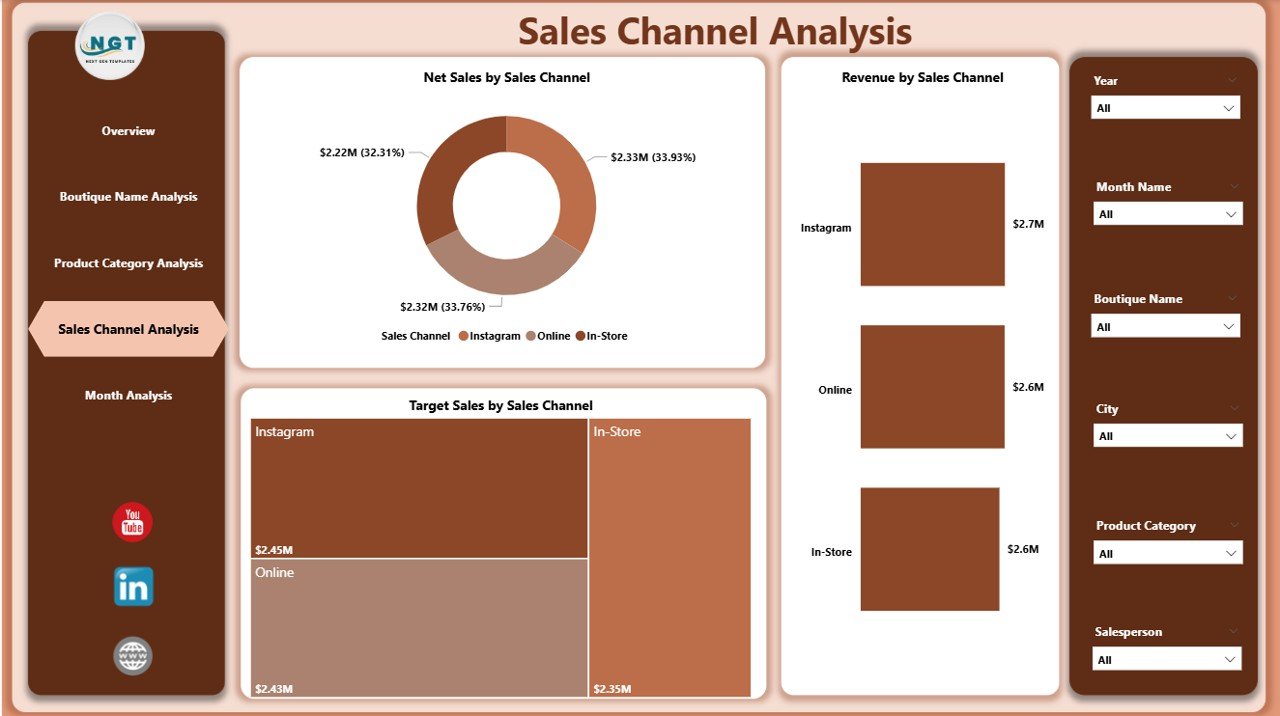
4️⃣ Sales Channel Analysis – Where Do Sales Come From?
Modern boutiques sell through multiple channels such as:
-
Physical stores
-
Online websites
-
Social media platforms
-
Marketplace apps
The Sales Channel Analysis Page compares performance across these channels.
Click to Purchases Fashion Boutiques Dashboard in Power BI
Charts Included
-
Net Sales by Sales Channel
-
Revenue by Sales Channel
-
Target Sales by Sales Channel
Key Benefits
-
Identify top-performing channels
-
Optimize marketing budgets
-
Improve omnichannel strategy
As a result, boutiques invest more in profitable platforms.
5️⃣ Month Analysis – Trend and Seasonal Performance
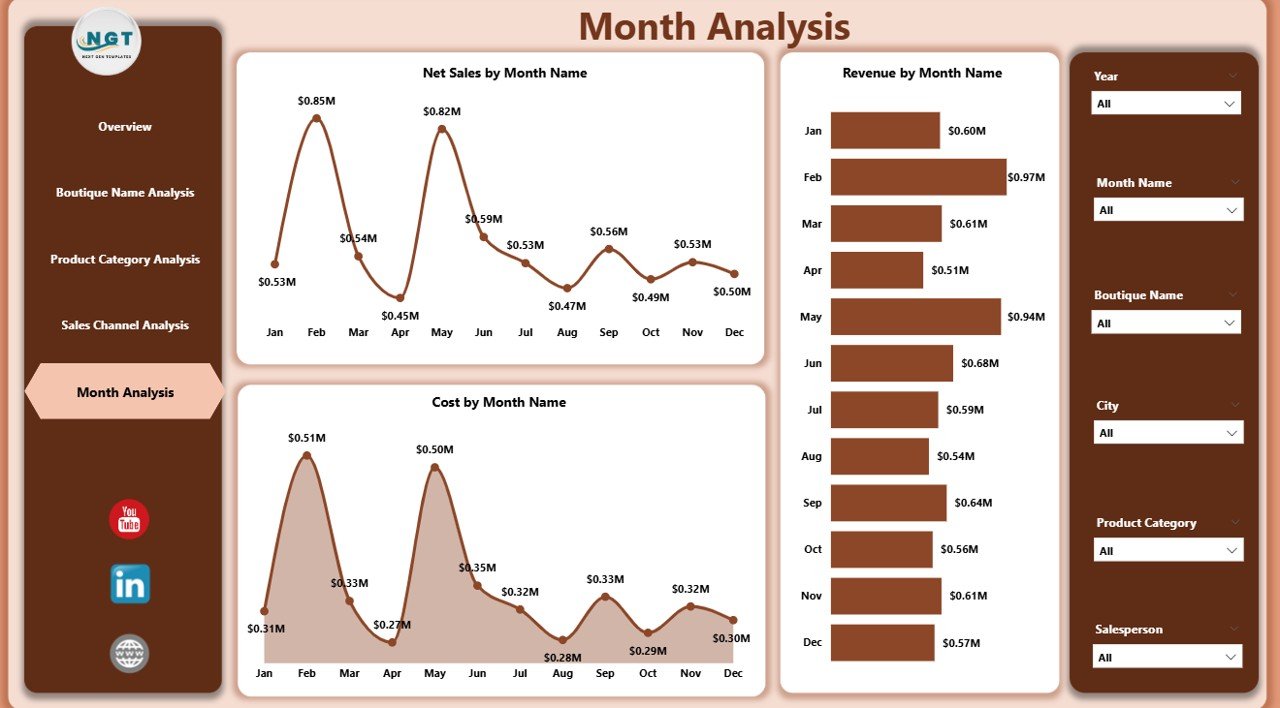
Fashion retail strongly depends on seasons and trends. Therefore, monthly analysis becomes essential.
Charts Included
-
Net Sales by Month
-
Revenue by Month
-
Cost by Month
Insights Generated
-
Seasonal sales patterns
-
High-performing months
-
Cost fluctuations
-
Sales growth trends
Because fashion demand changes frequently, monthly tracking helps boutiques prepare inventory in advance.
What KPIs Can Fashion Boutiques Track?
A well-designed dashboard tracks meaningful metrics.
Important Retail KPIs Include
-
Net Sales
-
Revenue
-
Profit Margin %
-
Cost of Goods Sold (COGS)
-
Target Achievement %
-
Sales by Channel
-
Customer Segment Revenue
-
Monthly Growth Rate
These KPIs provide a complete business overview.
Advantages of Fashion Boutiques Dashboard in Power BI
Using this dashboard provides several operational and strategic benefits.
✅ Centralized Data Visibility
All performance data appears in one place, which eliminates confusion.
✅ Faster Decision-Making
Managers instantly analyze trends instead of waiting for reports.
✅ Improved Profitability Tracking
Profit margin visuals help identify profitable categories quickly.
✅ Interactive Analysis
Users filter reports using slicers without technical knowledge.
✅ Better Sales Strategy
Businesses focus on high-performing products and channels.
✅ Time Saving
Automation reduces manual reporting effort significantly.
How Does the Dashboard Help Boutique Owners Grow?
Growth requires continuous monitoring and improvement. This dashboard supports growth in multiple ways.
Strategic Benefits
-
Identifies best-selling products
-
Detects underperforming boutiques
-
Improves pricing decisions
-
Enhances customer targeting
-
Supports expansion planning
Therefore, boutique owners operate more strategically rather than reactively.
Best Practices for the Fashion Boutiques Dashboard in Power BI
Click to Purchases Fashion Boutiques Dashboard in Power BI
To achieve maximum value, businesses should follow best practices.
✔ Maintain Clean Data
Ensure sales data remains accurate and consistent.
✔ Update Data Regularly
Frequent updates keep insights reliable.
✔ Use Meaningful KPIs
Track metrics that influence decisions directly.
✔ Apply Proper Filters
Use slicers for region, month, and category comparisons.
✔ Train Team Members
Educate staff on interpreting dashboard visuals.
✔ Monitor Trends Continuously
Review dashboards weekly or monthly.
Following these practices improves dashboard effectiveness.
How to Implement a Fashion Boutique Dashboard Successfully?
Implementation becomes easier when you follow a structured approach.
Step-by-Step Process
-
Collect boutique sales data.
-
Organize data in Excel format.
-
Import data into Power BI.
-
Create relationships between tables.
-
Design KPI visuals.
-
Add slicers and filters.
-
Publish dashboard to Power BI Service.
After implementation, teams can access reports anytime.
Who Can Benefit from This Dashboard?
Many professionals within the fashion industry can use this solution.
Ideal Users
-
Boutique Owners
-
Fashion Retail Managers
-
Sales Teams
-
Marketing Analysts
-
Retail Consultants
-
E-commerce Managers
Because insights remain visual and simple, anyone can use the dashboard effectively.
How Does This Dashboard Support Data-Driven Retail Strategy?
Data-driven businesses outperform competitors. Therefore, analytics plays a major role in retail success.
This dashboard helps by:
-
Highlighting profitable customer segments
-
Identifying sales opportunities
-
Improving promotional planning
-
Supporting inventory optimization
Consequently, boutiques reduce risks and increase revenue stability.
Future Opportunities with Power BI in Fashion Retail
Power BI continues evolving. Therefore, boutiques can expand analytics further.
Future Enhancements
-
AI-driven demand forecasting
-
Customer purchase prediction
-
Inventory optimization models
-
Real-time sales monitoring
-
Automated alerts
These features will make boutique analytics even more powerful.
Conclusion
The Fashion Boutiques Dashboard in Power BI transforms retail data into actionable insights. Instead of relying on manual reports, boutique owners gain a clear and interactive view of business performance.
Because the dashboard includes five analytical pages — Overview, Boutique Analysis, Product Category Analysis, Sales Channel Analysis, and Month Analysis — users understand performance from every angle.
Moreover, interactive visuals, KPI tracking, and dynamic filters enable faster decisions, better profitability management, and improved growth strategies.
In today’s competitive fashion industry, businesses that use data outperform those that rely on intuition alone. Therefore, adopting a Power BI dashboard becomes not just helpful but essential.
Frequently Asked Questions (FAQs)
1. What is a Fashion Boutiques Dashboard in Power BI used for?
It helps boutiques track sales, revenue, profit margins, and performance using interactive visual analytics.
2. Can small boutiques use this dashboard?
Yes. Small and large boutiques can both benefit because Power BI scales easily.
3. Do I need technical knowledge to use the dashboard?
No. Users interact with slicers and visuals without coding skills.
4. How often should I update the dashboard?
You should update data daily, weekly, or monthly depending on business needs.
5. Can the dashboard analyze online and offline sales together?
Yes. Power BI combines multiple sales channels into one report.
6. What data source does the dashboard use?
Typically, the dashboard captures data from an Excel file or connected databases.
7. Why is Power BI better than manual reporting?
Power BI automates analysis, reduces errors, and provides interactive insights instantly.
Visit our YouTube channel to learn step-by-step video tutorials