Modern startup ecosystems depend heavily on Business Angel Networks. These networks connect early-stage startups with experienced investors who provide funding, mentorship, and strategic guidance. However, managing investment activities, monitoring startup performance, and tracking investor engagement can become complex when organizations rely on scattered spreadsheets and manual reports.
Therefore, many angel networks look for structured tools that allow them to track performance metrics clearly. A Business Angel Networks KPI Dashboard in Power BI helps organizations monitor important indicators, evaluate investment outcomes, and make better strategic decisions.
Moreover, Power BI dashboards allow teams to visualize data through interactive charts, slicers, and performance indicators. As a result, decision-makers can quickly identify trends, opportunities, and risks in the investment portfolio.
In this article, we will explore what a Business Angel Networks KPI Dashboard in Power BI is, why organizations need it, how it works, its key features, advantages, and best practices for using it effectively.
Click to buy Business Angel Networks KPI Dashboard in Power BI
What is a Business Angel Networks KPI Dashboard in Power BI?
A Business Angel Networks KPI Dashboard in Power BI is a data visualization and analytics tool designed to monitor the performance of angel investment networks. It collects and analyzes Key Performance Indicators (KPIs) related to investments, startup growth, deal flow, investor participation, and funding activities.
Instead of analyzing multiple reports manually, organizations can use this dashboard to view real-time performance metrics in one centralized interface.
Furthermore, Power BI provides advanced data visualization capabilities. Therefore, users can analyze:
- Investment performance
- Startup funding trends
- Investor engagement
- Portfolio growth
- KPI achievement against targets
As a result, angel networks can track investment outcomes more efficiently and make informed decisions.
Why Do Business Angel Networks Need KPI Dashboards?
Angel investment networks manage multiple startups, investors, and funding rounds. Without a structured tracking system, it becomes difficult to evaluate performance.
However, KPI dashboards simplify performance monitoring.
Key Reasons Angel Networks Use KPI Dashboards
- Centralized data management
- Better investment monitoring
- Faster decision making
- Improved investor reporting
- Better startup performance tracking
Additionally, dashboards provide visual insights that allow managers to quickly identify areas that need attention.
Therefore, organizations that use KPI dashboards gain a significant advantage in managing their investment ecosystem.
Key Features of the Business Angel Networks KPI Dashboard in Power BI
This ready-to-use Power BI dashboard captures data from an Excel data source and presents performance metrics through three interactive pages.
The dashboard structure allows users to monitor KPIs at both summary and detailed levels.
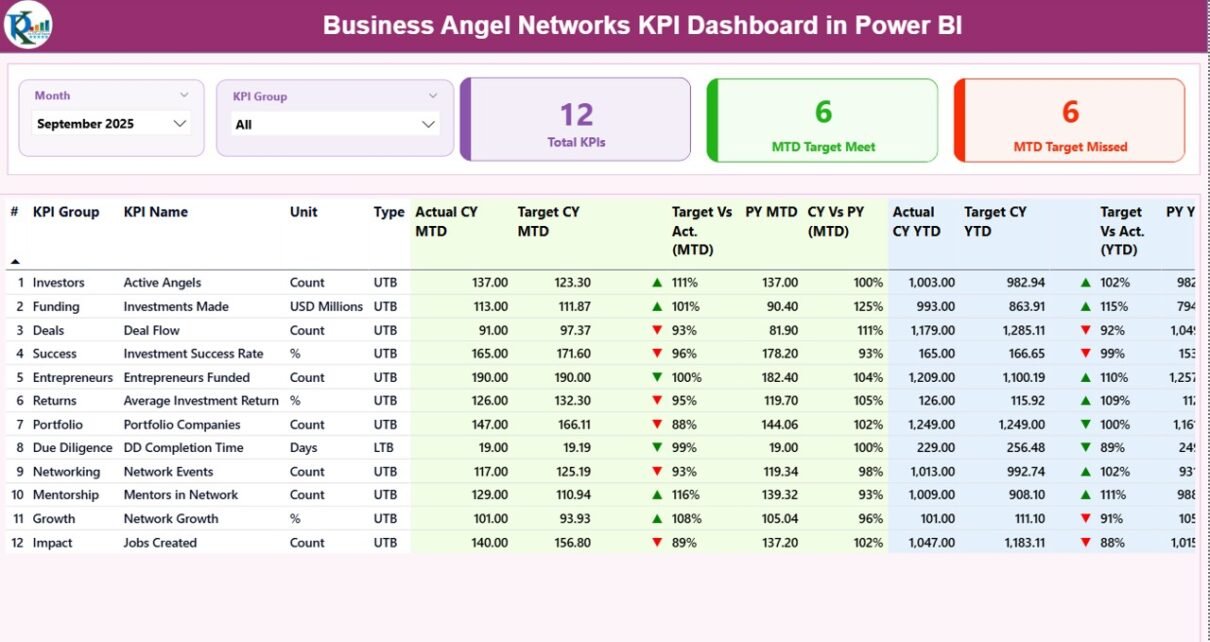
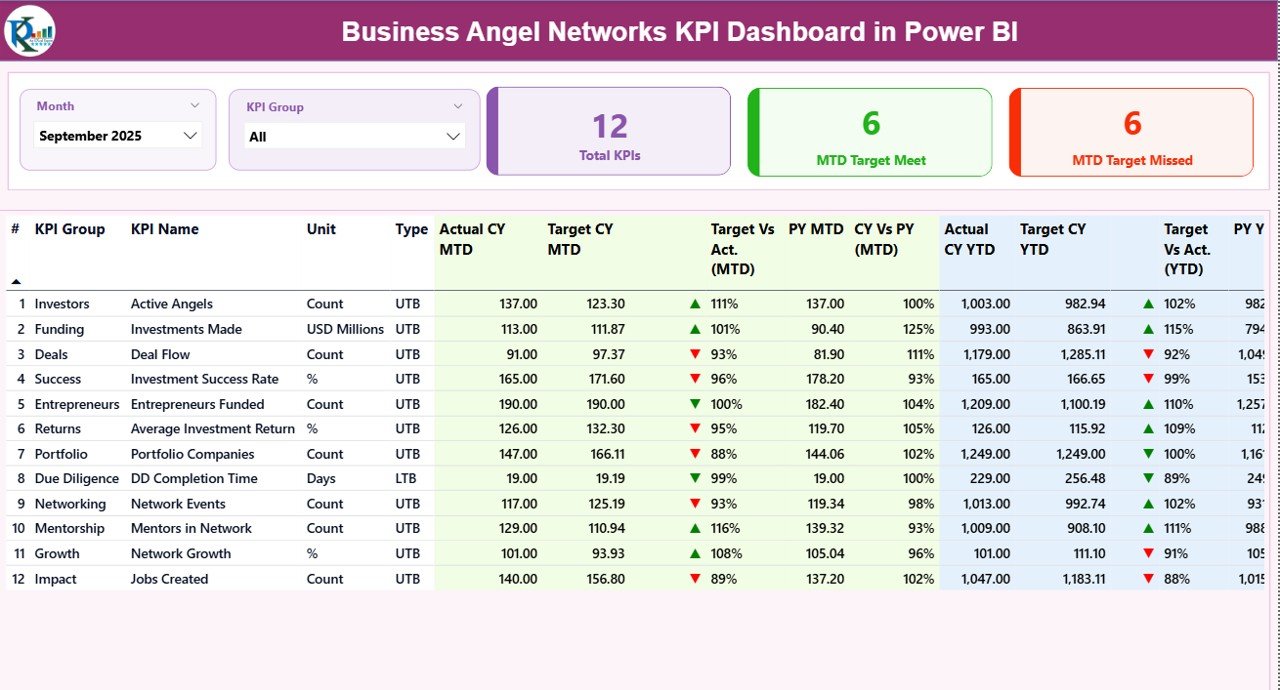
Summary Page
The Summary Page acts as the main dashboard page where users can view key performance indicators at a glance.
At the top of the dashboard, users can access the following filters:
- Month Slicer
- KPI Group Slicer
These slicers allow users to analyze KPI performance for specific months and KPI categories.
KPI Cards
The dashboard displays three important KPI cards:
- Total KPIs Count
- MTD Target Meet Count
- MTD Target Missed Count
These cards provide an instant overview of KPI performance.
Detailed KPI Table
Below the KPI cards, the dashboard displays a detailed KPI performance table.
The table contains the following columns:
KPI Number
Sequence number assigned to each KPI.
KPI Group
Category or group of the KPI.
KPI Name
Name of the performance indicator.
Unit
Measurement unit used for the KPI.
Type
Indicates whether the KPI is:
- LTB (Lower the Better)
- UTB (Upper the Better)
Actual CY MTD
Actual performance value for the Current Year Month-to-Date.
Target CY MTD
Target value for the Current Year Month-to-Date.
MTD Icon
Visual indicator showing KPI performance:
- ▲ Green icon indicates the target is achieved
- ▼ Red icon indicates the target is missed
Target vs Actual (MTD)
Percentage comparison between actual performance and target.
Formula used:
Actual MTD ÷ Target MTD
PY MTD
Previous Year Month-to-Date performance.
CY vs PY (MTD)
Comparison between current year MTD and previous year MTD.
Formula used:
Current Year MTD ÷ Previous Year MTD
YTD KPI Tracking
The dashboard also displays Year-to-Date performance metrics.
These include:
Actual CY YTD
Actual KPI performance for the current year.
Target CY YTD
Target KPI performance for the current year.
YTD Icon
Visual indicator showing whether the KPI meets the yearly target.
Target vs Actual (YTD)
Percentage comparison between actual YTD performance and target.
Formula used:
Actual YTD ÷ Target YTD
PY YTD
Previous year YTD KPI value.
CY vs PY (YTD)
Comparison between current year and previous year performance.
Formula used:
Current Year YTD ÷ Previous Year YTD
Because of these metrics, decision-makers can easily evaluate both short-term and long-term performance trends.
Click to buy Business Angel Networks KPI Dashboard in Power BI
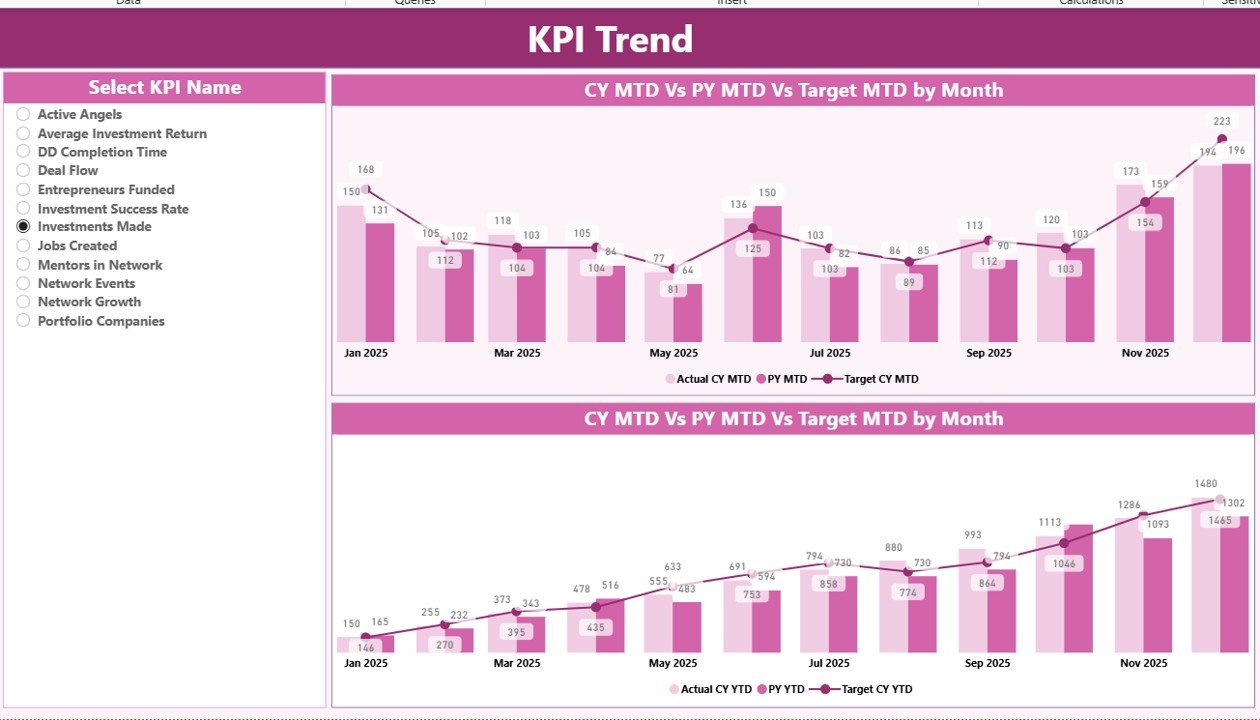
KPI Trend Page
The KPI Trend Page allows users to analyze performance trends over time.
On this page, users can view two combo charts.
These charts display:
- Current Year Actual values
- Previous Year values
- Target values
The charts show data for both:
- MTD (Month-to-Date)
- YTD (Year-to-Date)
Additionally, the page contains a KPI Name slicer on the left side. Users can select any KPI to analyze its trend performance.
As a result, users can quickly identify whether performance improves, declines, or remains stable over time.
Click to buy Business Angel Networks KPI Dashboard in Power BI
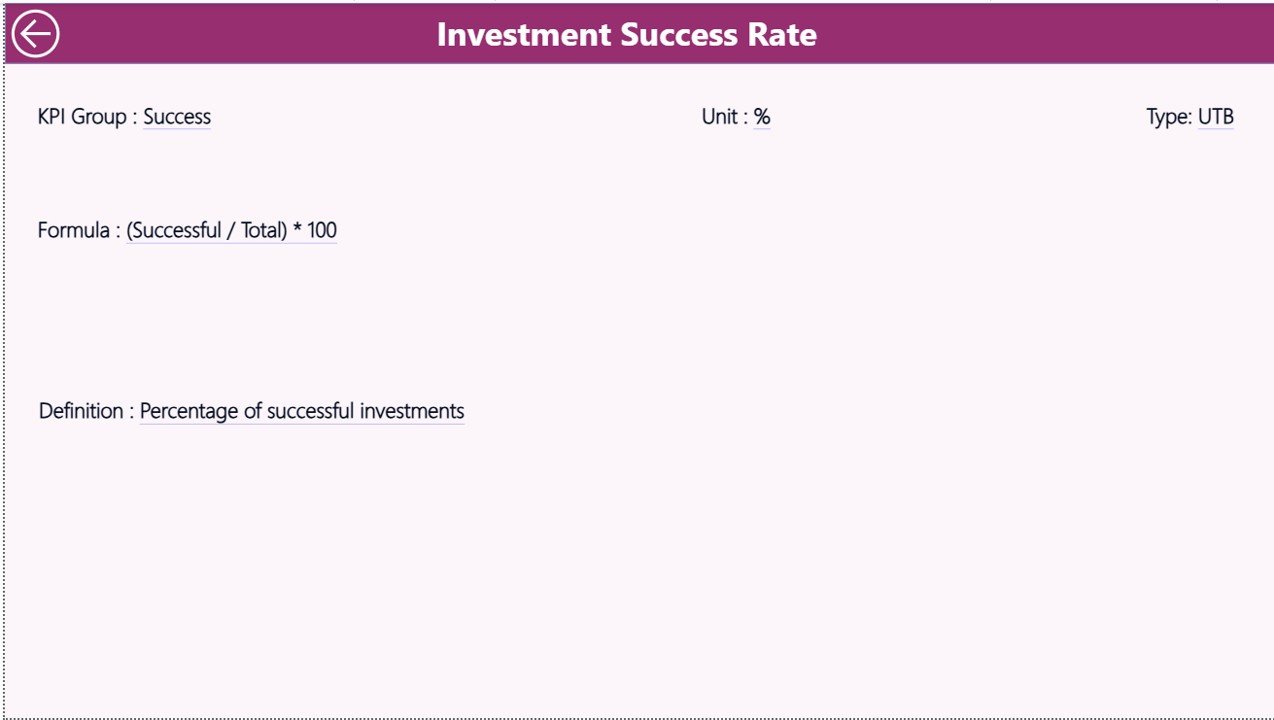
KPI Definition Page
The KPI Definition Page provides detailed information about each KPI.
This page works as a drill-through page and remains hidden in the main dashboard navigation.
From the Summary Page, users can drill through to see:
- KPI formula
- KPI definition
- KPI unit
- KPI group
- KPI type
This feature helps users understand the meaning and calculation method of each KPI.
Additionally, users can return to the main dashboard by clicking the Back button located at the top left corner.
Click to buy Business Angel Networks KPI Dashboard in Power BI
Excel Data Source Structure
The dashboard uses Excel as the data source.
Users only need to fill three worksheets in the Excel file.
After that, Power BI automatically updates the dashboard.
Input_Actual Sheet
This sheet stores the actual performance values of KPIs.
Users need to enter the following fields:
- KPI Name
- Month (first date of the month)
- MTD Value
- YTD Value
These values represent the actual performance of KPIs.
Input_Target Sheet
This sheet contains target values for each KPI.
Users must fill:
- KPI Name
- Month
- MTD Target
- YTD Target
Power BI compares these values against actual performance.
KPI Definition Sheet
This sheet defines each KPI.
Users must fill the following information:
- KPI Number
- KPI Group
- KPI Name
- Unit
- Formula
- Definition
- Type (LTB or UTB)
This structure ensures that every KPI has clear documentation.
Advantages of Business Angel Networks KPI Dashboard in Power BI
Organizations gain several benefits when they use KPI dashboards.
- Real-Time Performance Monitoring
Power BI dashboards allow users to track investment performance instantly.
Therefore, managers can identify issues quickly.
- Better Decision Making
Visual dashboards provide clear insights into investment outcomes.
Consequently, angel networks can make smarter investment decisions.
- Improved Transparency
Investors often demand transparency.
However, manual reports often create confusion.
Dashboards solve this problem by presenting clear and accurate performance metrics.
- Efficient Portfolio Management
Angel networks often manage dozens of startups.
Dashboards help managers monitor:
- Startup growth
- Investment performance
- Funding milestones
- Data Driven Strategy
Because dashboards highlight trends and comparisons, organizations can adjust their strategies based on data rather than assumptions.
Best Practices for Using a Business Angel Networks KPI Dashboard in Power BI
Although dashboards provide powerful insights, organizations must follow best practices.
- Define Clear KPIs
First, organizations must define KPIs clearly.
Each KPI should measure a specific business objective.
Examples include:
- Investment success rate
- Startup revenue growth
- Investor participation rate
- Deal conversion rate
- Maintain Accurate Data
Dashboards depend on data quality.
Therefore, teams must update Excel data sources regularly.
Accurate data ensures reliable insights.
- Use Consistent KPI Definitions
Different departments sometimes interpret KPIs differently.
However, organizations should maintain standardized KPI definitions.
This approach ensures consistent analysis.
- Monitor KPIs Regularly
Organizations should review dashboards frequently.
Regular monitoring helps detect problems early.
- Use Drill-Through Features
Drill-through functionality helps users explore detailed KPI information.
Therefore, managers can analyze the root cause of performance changes.
How Does Power BI Improve KPI Tracking?
Power BI offers several advantages over traditional spreadsheets.
Interactive Visualization
Power BI transforms raw data into visual insights.
Charts, slicers, and filters improve data exploration.
Automated Reporting
Power BI automatically refreshes reports when data updates.
Therefore, users always see the latest performance metrics.
Easy Data Integration
Power BI connects easily with Excel, databases, and cloud systems.
This flexibility simplifies data management.
Scalability
Power BI supports large datasets.
Therefore, angel networks can expand their dashboards as their investment portfolio grows.
Who Can Use a Business Angel Networks KPI Dashboard?
Several professionals can benefit from this dashboard.
Angel Network Managers
Managers use dashboards to monitor investment performance.
Startup Portfolio Managers
Portfolio managers analyze startup growth and funding progress.
Investors
Investors use dashboards to evaluate investment returns.
Financial Analysts
Analysts use dashboards to identify trends and opportunities.
How to Implement a KPI Dashboard for Angel Networks?
Organizations can implement the dashboard using the following steps.
Step 1: Define KPIs
Identify the most important performance indicators.
Step 2: Prepare Data
Collect KPI data in Excel.
Step 3: Build Data Model
Import the Excel file into Power BI.
Step 4: Create Visualizations
Build KPI cards, tables, and trend charts.
Step 5: Share Dashboard
Publish the dashboard to Power BI Service.
Future of Investment Analytics with Power BI
Investment analytics continues to evolve.
Organizations now rely on data-driven decision making.
Power BI enables angel networks to analyze large volumes of investment data quickly.
In the future, dashboards may include:
- AI-driven investment insights
- Predictive analytics
- Automated KPI alerts
- Real-time startup performance tracking
Therefore, organizations that adopt modern analytics tools will remain competitive.
Conclusion
Business Angel Networks play a vital role in supporting startup ecosystems. However, managing investment activities without structured analytics creates challenges.
A Business Angel Networks KPI Dashboard in Power BI solves this problem by centralizing data and visualizing key performance metrics.
The dashboard allows organizations to monitor KPIs, analyze trends, and evaluate investment performance efficiently.
Moreover, Power BI provides powerful visualization tools that transform raw data into meaningful insights.
Therefore, angel networks can make faster decisions, improve transparency, and manage their investment portfolios more effectively.
Frequently Asked Questions (FAQs)
What is a Business Angel Networks KPI Dashboard?
A Business Angel Networks KPI Dashboard is a data analytics tool that tracks and visualizes key performance indicators related to angel investments and startup performance.
Why should angel networks use Power BI dashboards?
Power BI dashboards provide real-time insights, automated reporting, and interactive visualizations that help organizations track investment performance efficiently.
What KPIs can angel networks track?
Angel networks can track several KPIs such as:
- Investment success rate
- Startup revenue growth
- Investor participation
- Deal flow volume
- Funding round performance
Is Excel required for the dashboard?
Yes. Excel serves as the primary data source. Users enter KPI actual values, target values, and KPI definitions in Excel.
Can organizations customize the dashboard?
Yes. Power BI dashboards allow users to customize KPIs, charts, and visualizations based on their business requirements.
Visit our YouTube channel to learn step-by-step video tutorials
Watch the step-by-step video tutorial:
Click to buy Business Angel Networks KPI Dashboard in Power BI