In today’s fast-moving retail world, especially in the baby products industry, businesses deal with large volumes of data every single day. From tracking sales, profit, shipping costs, and customer behavior, retailers must stay on top of everything to remain competitive.
However, managing all this data manually becomes confusing and time-consuming. As a result, decision-making slows down, and opportunities get missed.
So, how can baby product retailers simplify data analysis and make smarter decisions?
The answer is the Baby Products Retail Dashboard in Excel.
This ready-to-use Excel dashboard helps you track, analyze, and visualize your retail performance in one place. Moreover, it converts raw data into meaningful insights using interactive charts and dynamic reports.
Click to buy Baby Products Retail Dashboard in Excel
In this comprehensive guide, you will learn everything about this dashboard, including its features, benefits, structure, best practices, and FAQs.
What is a Baby Products Retail Dashboard in Excel?
A Baby Products Retail Dashboard in Excel is an advanced reporting tool designed to monitor and analyze key retail metrics related to baby products.
Instead of using multiple spreadsheets, this dashboard allows you to:
- Track total sales and profit in real time
- Analyze customer purchasing behavior
- Monitor regional and store performance
- Evaluate shipping and delivery efficiency
- Make data-driven business decisions
Therefore, it becomes an essential tool for retailers, eCommerce sellers, wholesalers, and analysts working in the baby products segment.
Why Do You Need a Baby Products Retail Dashboard?
You might wonder—why invest in a dashboard when Excel already stores data?
Well, here’s why:
- Without dashboards, data stays scattered
- Reports take longer to prepare
- Insights remain hidden in raw numbers
On the other hand, with a dashboard:
- You get instant insights
- You improve decision-making speed
- You identify trends quickly
- You optimize operations effectively
As a result, your business becomes more efficient, profitable, and scalable.
Key Features of Baby Products Retail Dashboard in Excel
This dashboard includes multiple interactive sheets that help you analyze different aspects of your business. Let’s explore each one in detail.
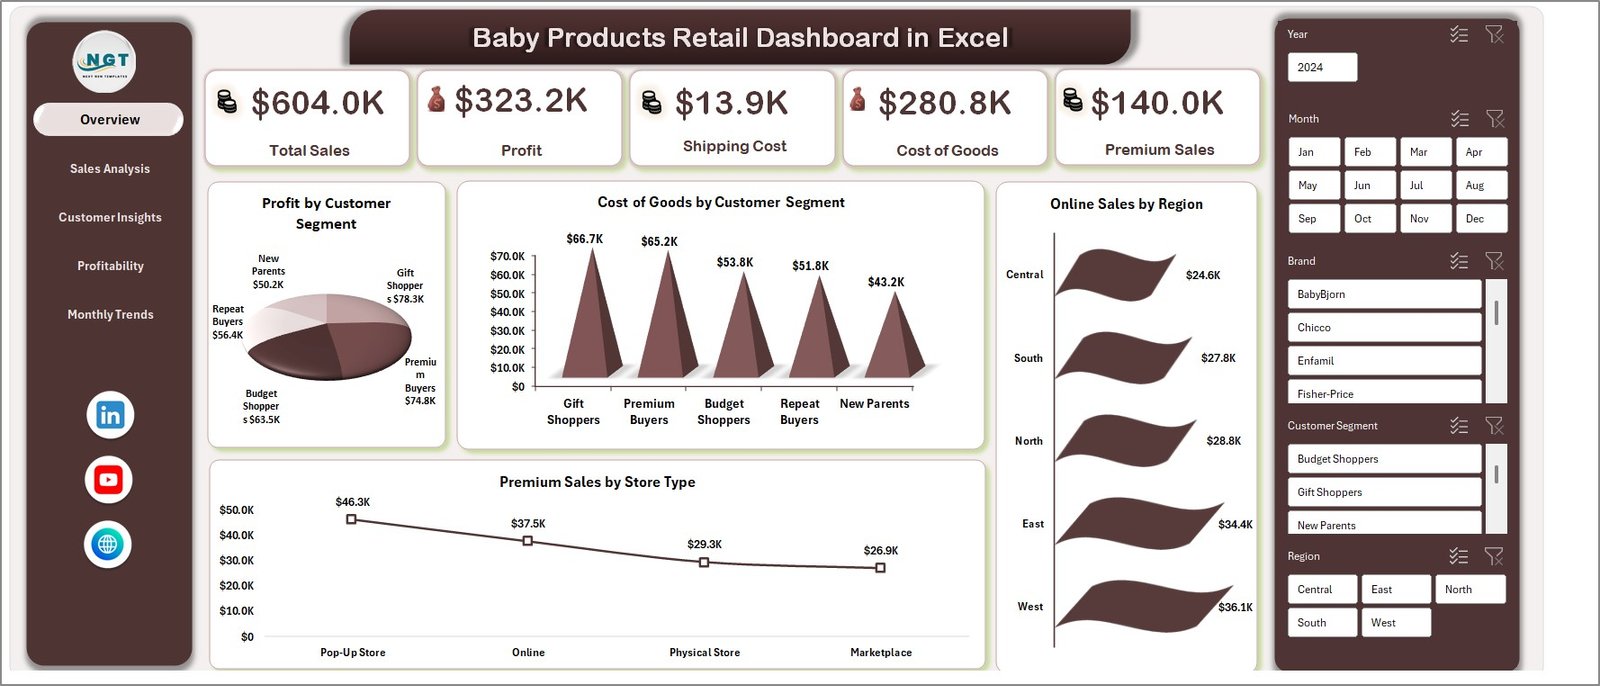
Overview Sheet – Your Business Snapshot
The Overview Sheet acts as the main control panel of the dashboard. It gives you a quick summary of your business performance.
Key Metrics Displayed:
- Total Sales
- Profit
- Shipping Cost
- Cost of Goods
- Premium Sales
Visual Insights:
- Profit by Customer Segment
- Cost of Goods by Customer Segment
- Online Sales by Region
- Premium Sales by Store Type
Click to buy Baby Products Retail Dashboard in Excel
Therefore, this sheet helps you understand your overall business performance at a glance.
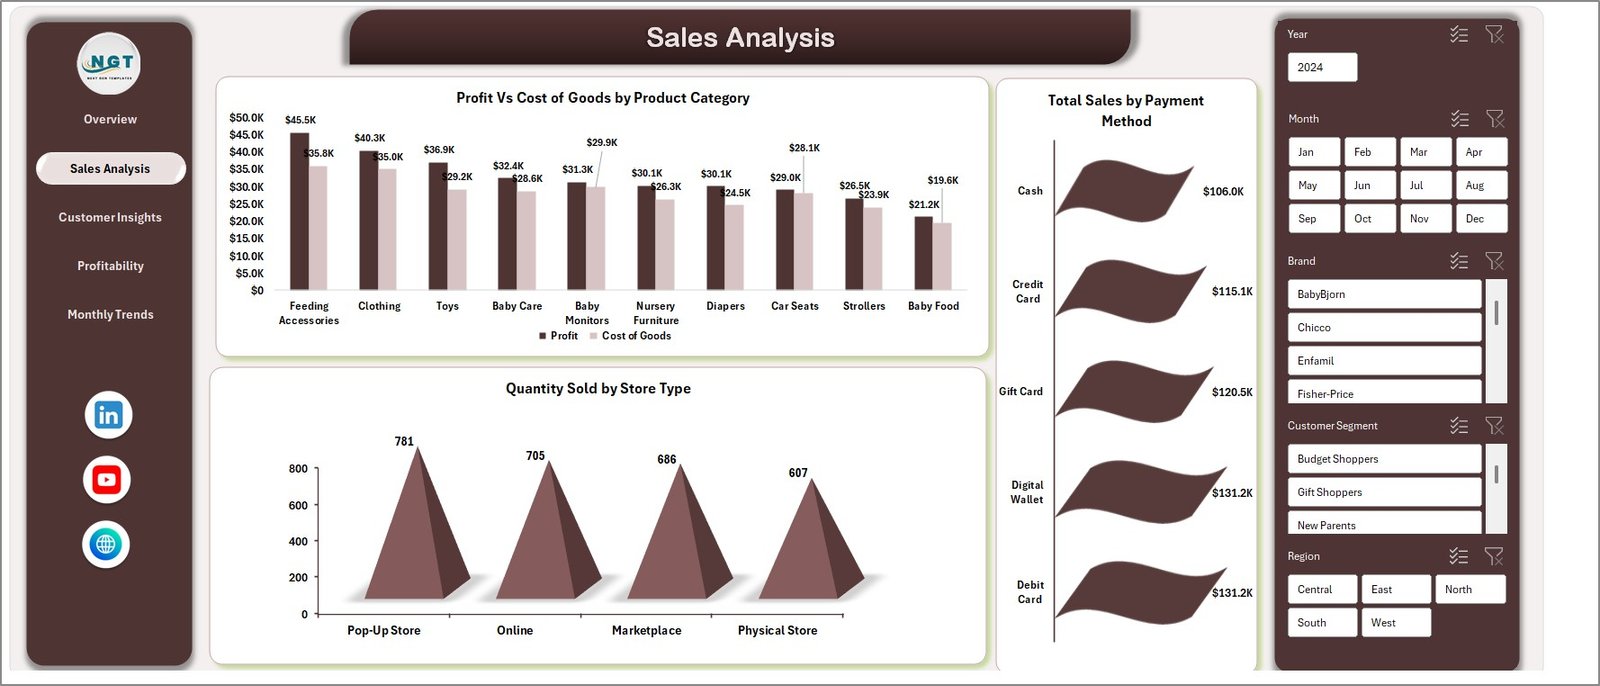
Sales Analysis – Deep Dive into Sales Performance
The Sales Analysis Sheet focuses on understanding how your sales perform across different categories.
Key Charts:
- Profit vs Cost of Goods by Product Category
- Total Sales by Payment Method
- Quantity Sold by Store Type
As a result, you can identify:
- High-performing product categories
- Most preferred payment methods
- Store types driving maximum sales
Click to buy Baby Products Retail Dashboard in Excel
Customer Insights – Know Your Customers Better
Understanding your customers is crucial for business success. This sheet provides valuable insights into customer behavior.
Key Metrics:
- Avg. Customer Rating by Customer Segment
- Avg. Delivery Days by Region
- Loyalty Points by Brand
- Online Sales by Customer Segment
Therefore, you can:
- Improve customer satisfaction
- Optimize delivery performance
- Strengthen customer loyalty programs

Click to buy Baby Products Retail Dashboard in Excel
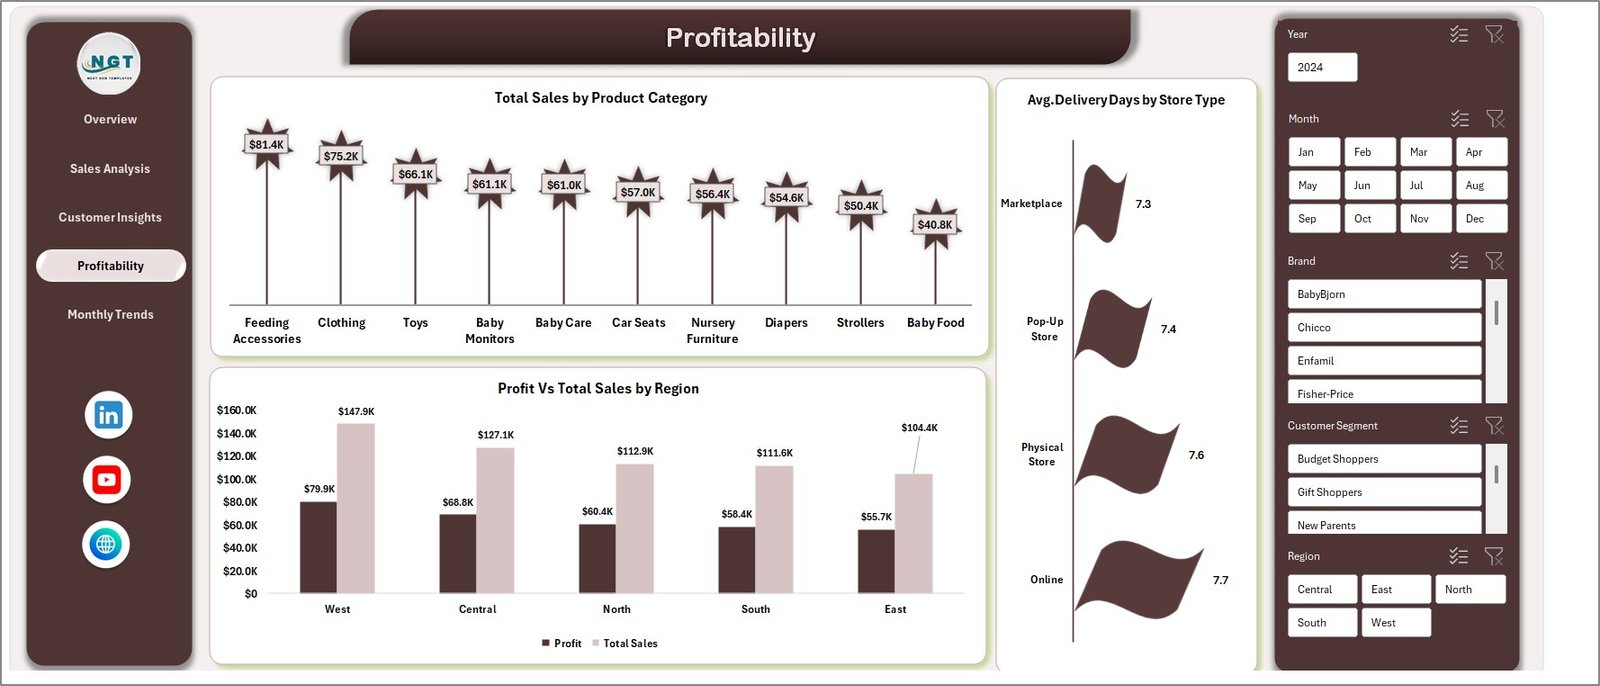
Profitability Analysis – Measure Business Efficiency
The Profitability Sheet helps you evaluate how efficiently your business generates profit.
Key Insights:
- Total Sales by Product Category
- Profit vs Total Sales by Region
- Avg. Delivery Days by Store Type
Consequently, you can:
- Identify profitable regions
- Optimize product pricing
- Improve operational efficiency
Click to buy Baby Products Retail Dashboard in Excel
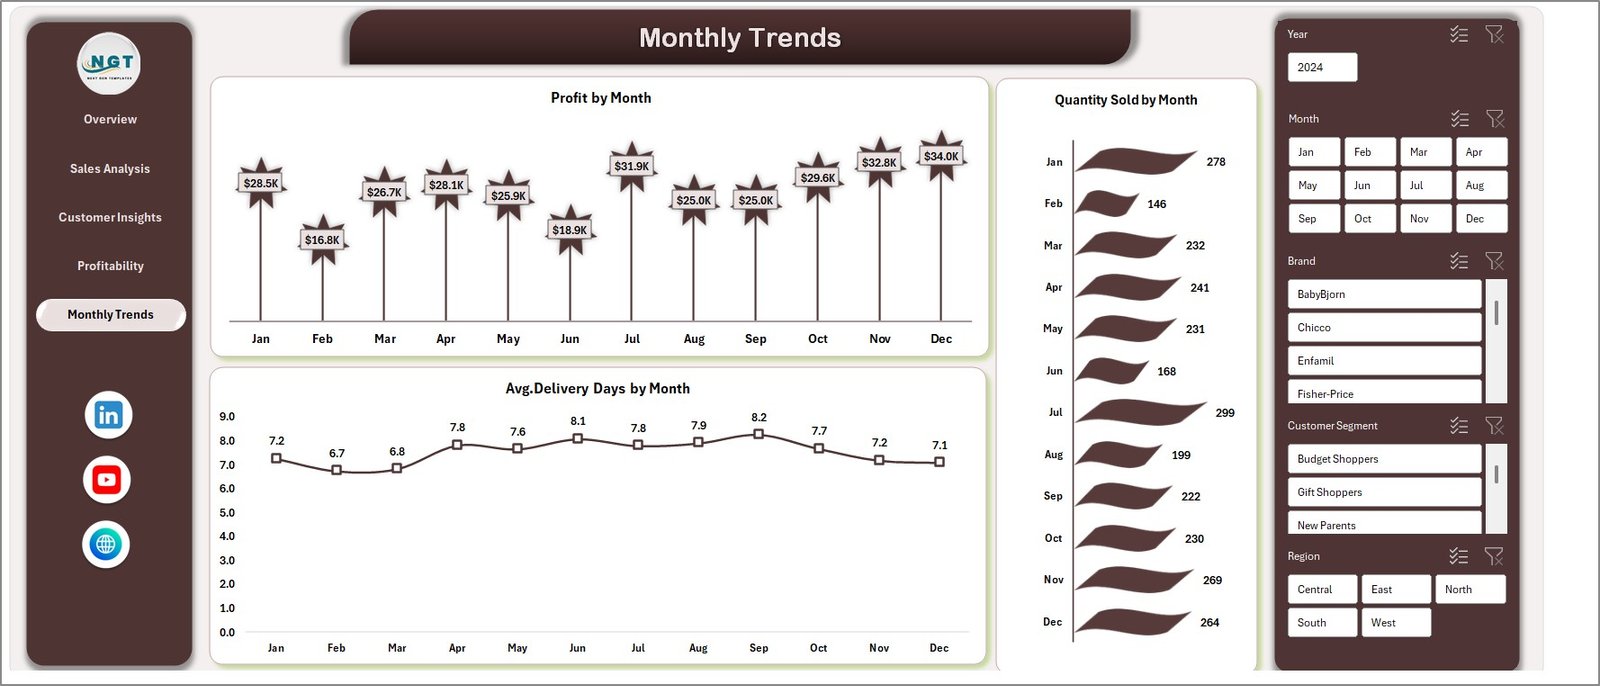
Monthly Trends – Track Performance Over Time
The Monthly Trends Sheet helps you analyze business performance over time.
Key Charts:
- Profit by Month
- Avg. Delivery Days by Month
- Quantity Sold by Month
As a result, you can:
- Identify seasonal trends
- Forecast future sales
- Plan inventory effectively
Click to buy Baby Products Retail Dashboard in Excel
Advantages of Baby Products Retail Dashboard in Excel
Using this dashboard offers several powerful benefits.
1Centralized Data Management
All your data stays in one place, which reduces confusion and saves time.
Real-Time Insights
You can instantly view key metrics without creating manual reports.
Improved Decision-Making
Since you get clear insights, you can make faster and better decisions.
Better Customer Understanding
You can analyze customer behavior and improve satisfaction.
Increased Profitability
By identifying trends and inefficiencies, you can boost profits.
Easy Customization
Excel allows you to modify the dashboard based on your business needs.
How to Use the Baby Products Retail Dashboard in Excel?
Using this dashboard is simple and user-friendly.
Step-by-Step Guide:
- Enter Data
Input your sales, customer, and product data into the Excel sheet. - Refresh Dashboard
Update pivot tables or refresh connections. - Apply Filters
Use slicers to analyze data by region, category, or time. - Analyze Charts
Review charts and KPIs to understand performance. - Make Decisions
Use insights to improve operations and strategy.
Best Practices for the Baby Products Retail Dashboard
To get the best results, follow these proven practices:
Keep Data Updated Regularly
Always update your data to ensure accurate insights.
Use Clean and Structured Data
Avoid errors by maintaining proper formatting.
Leverage Filters and Slicers
Use them to analyze specific segments quickly.
Focus on Key KPIs
Do not overload the dashboard with unnecessary metrics.
Monitor Trends Frequently
Track monthly and seasonal trends to stay ahead.
Customize Based on Business Needs
Adapt the dashboard to your unique retail model.
Who Can Benefit from This Dashboard?
This dashboard is perfect for:
- Baby Product Retailers
- Store Owners
- eCommerce Businesses
- Data Analysts
- Supply Chain Managers
In short, anyone involved in retail operations or analytics can benefit from this tool.
Common Use Cases of This Dashboard
You can use this dashboard in multiple ways:
- Track sales performance across regions
- Analyze customer buying patterns
- Monitor shipping efficiency
- Improve profit margins
- Prepare business reports quickly
Opportunities for Improvement
While this dashboard is powerful, you can enhance it further:
- Integrate with Power BI for advanced analytics
- Create mobile-friendly versions
- Add automation using VBA
- Connect with live data sources
Conclusion
The Baby Products Retail Dashboard in Excel is a powerful and practical solution for modern retail businesses. It simplifies data analysis, improves decision-making, and helps you stay competitive in a dynamic market.
Moreover, it transforms complex data into easy-to-understand visuals. As a result, you can focus more on growing your business rather than managing spreadsheets.
If you want to boost your retail performance and gain actionable insights, this dashboard is a must-have tool.
Frequently Asked Questions (FAQs)
- What is a Baby Products Retail Dashboard?
It is an Excel-based tool that helps track and analyze retail performance metrics like sales, profit, and customer behavior.
- Is this dashboard suitable for small businesses?
Yes, it works perfectly for both small and large businesses.
- Do I need advanced Excel skills to use it?
No, the dashboard is user-friendly and easy to use.
- Can I customize the dashboard?
Yes, you can modify it according to your business needs.
- How often should I update the data?
You should update it regularly—daily, weekly, or monthly.
- Can this dashboard improve profitability?
Yes, it helps identify trends and inefficiencies, which leads to better profitability.
- Is it compatible with all Excel versions?
It works best with Excel 2016 and above.
Click to buy Baby Products Retail Dashboard in Excel