Bridge Maintenance Dashboard in Power BI: A Comprehensive Guide
The Bridge Maintenance Dashboard in Power BI is a ready-to-use, dynamic tool designed for efficient monitoring and management of bridge maintenance activities. By simply updating your data file and refreshing within Power BI, you can visualize comprehensive insights that support decision making and operational excellence.
Click to Purchases Bridge Maintenance Dashboard in Power BI
Introduction
The Bridge Maintenance Dashboard in Power BI empowers engineers, inspectors, and decision-makers by delivering clear, visualized data on bridge health and maintenance status. Whether you are tracking structural conditions or filtering records by urgency and inspector, this dashboard ensures you stay informed with minimal setup.
Key Features of Bridge Maintenance Dashboard in Power BI
- Multiple analytical pages covering overview, inspector, urgency, structure type, and monthly trends
- Interactive slicers to quickly apply filters and customize data views
- High-level summary cards showing critical metrics at a glance
- Drill-down capabilities with detailed charts for granular analysis
- Easy data refresh by updating source files and clicking the Refresh button in Power BI
Dashboard Pages Explanation
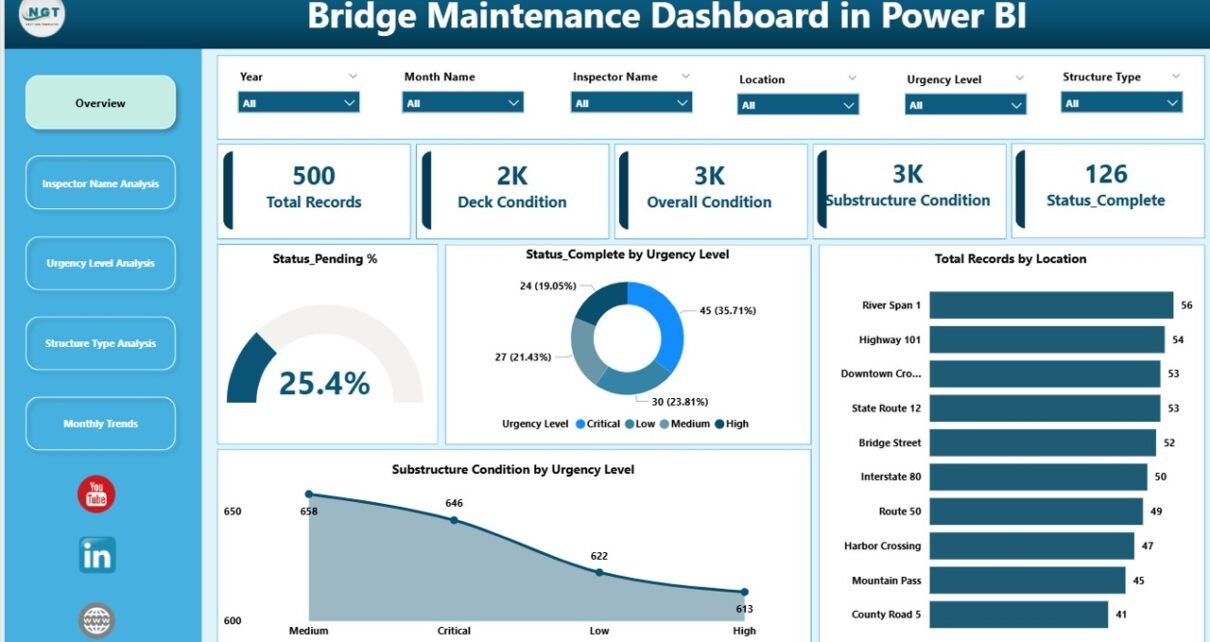
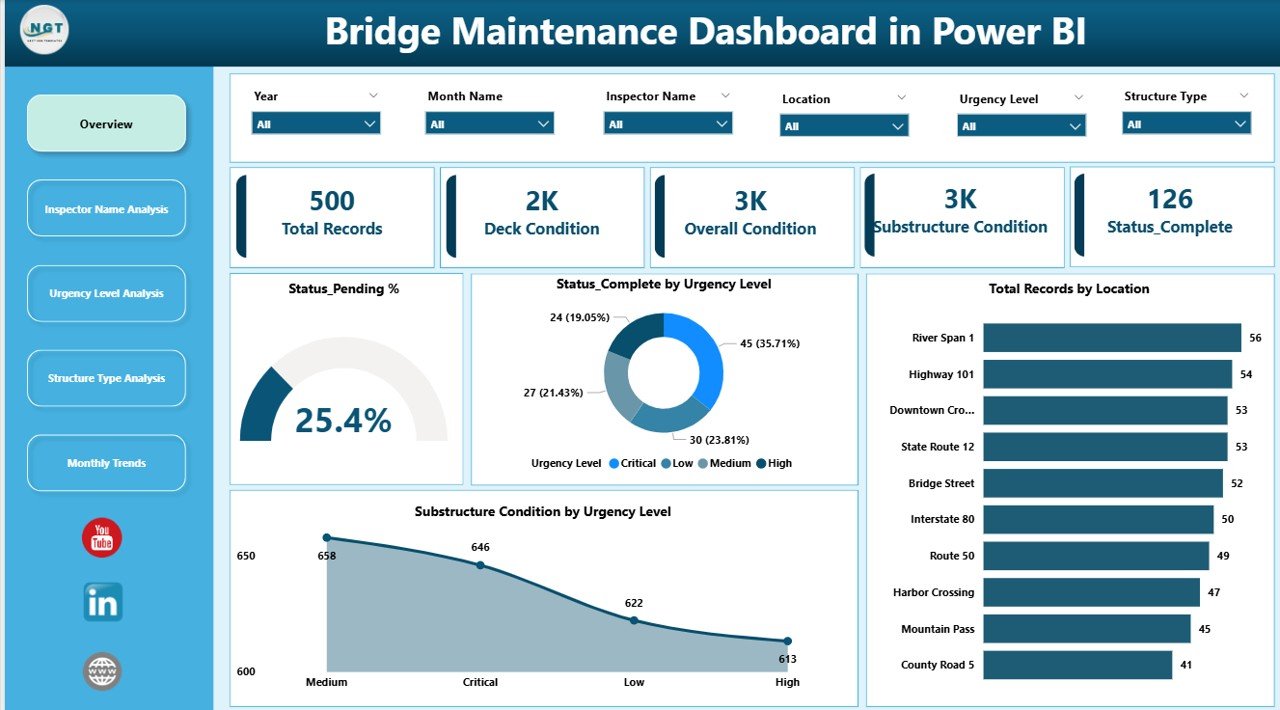
1. Overview Page
This page provides a comprehensive snapshot of the bridge maintenance status.
- Cards:
- Total Record: Displays the total number of bridge maintenance records.
- Deck Condition: Shows the overall condition status of bridge decks.
- Overall Condition: Summarizes the general health of all surveyed bridges.
- Substructure Condition: Indicates the condition of the bridge substructures.
- Status Completed: Highlights the count of completed maintenance tasks.
- Charts:
- Status Pending %: Represents the percentage of maintenance tasks that are still pending, helping prioritize work.
- Status Completed by Urgency Level: Breaks down completed tasks according to urgency, giving a view of critical task resolution.
- Total Records by Location: Displays the distribution of bridge records geographically, highlighting areas requiring more attention.
- Substructure Condition by Urgency Level: Visualizes the substructure’s health status aggregated by urgency, aiding quick decision-making.
-
Click to Purchases Bridge Maintenance Dashboard in Power BI
2. Inspector Name Analysis
This sheet tab focuses on assessing the performance and workload of inspectors.
- Status Completed by Inspector Name: Tracks the number of completed tasks per inspector.
- Total Records by Inspector Name: Shows the total maintenance records assigned to each inspector for workload balance analysis.
- Substructure Condition by Inspector Name: Analyzes the substructure condition for bridges inspected by each individual, signifying quality insights.
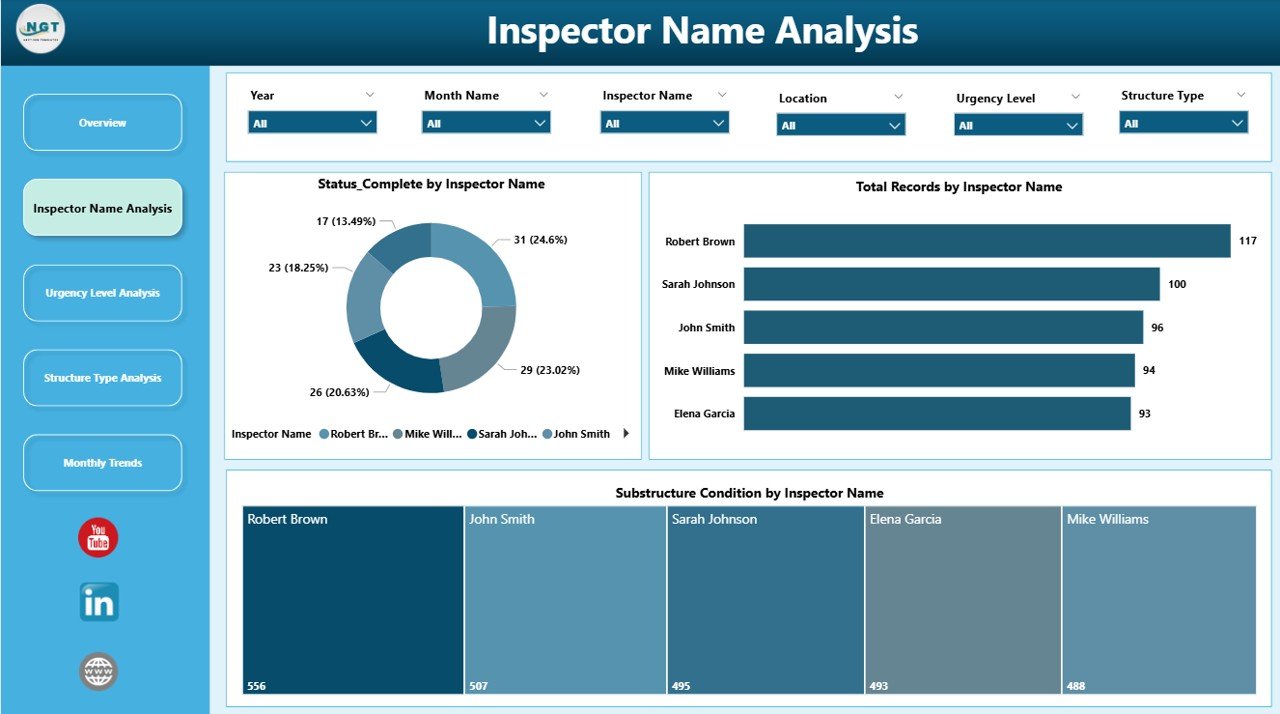
Inspector Name Analysis
3. Urgency Level Analysis
This page helps to understand maintenance needs based on urgency classifications.
- Overall Condition by Urgency Level: Displays bridge health status segmented by urgency levels to prioritize action.
- Total Records by Urgency Level: Shows the count of maintenance tasks categorized by urgency.
- Substructure Condition by Urgency Level: Focuses on the condition of bridge substructures sorted by urgency priority.
-
Click to Purchases Bridge Maintenance Dashboard in Power BI
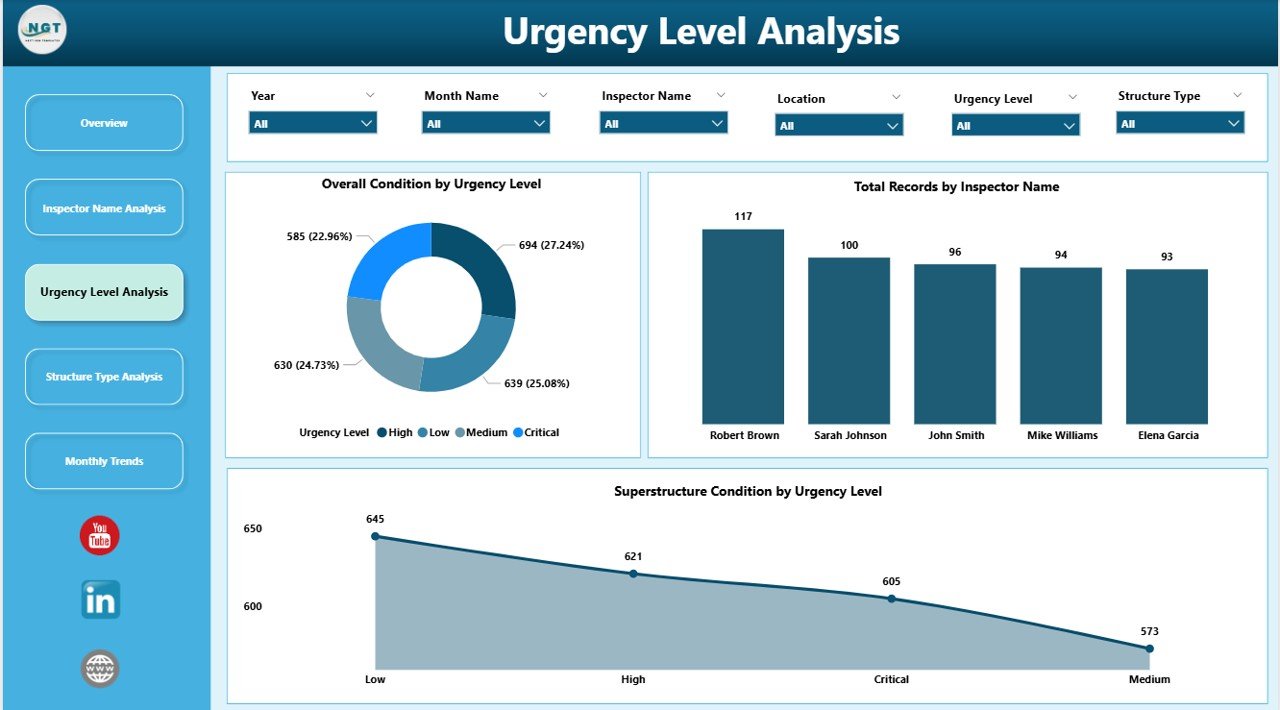
Urgency Level Analysis
4. Structure Type Analysis
This section helps evaluate bridge condition across different structure types.
- Overall Condition by Structure Type: Compares condition statuses between various structural categories.
- Total Records by Structure Type: Displays counts of recorded maintenance tasks based on structure types.
- Substructure Condition by Structure Type: Assesses substructure health according to structure classification.
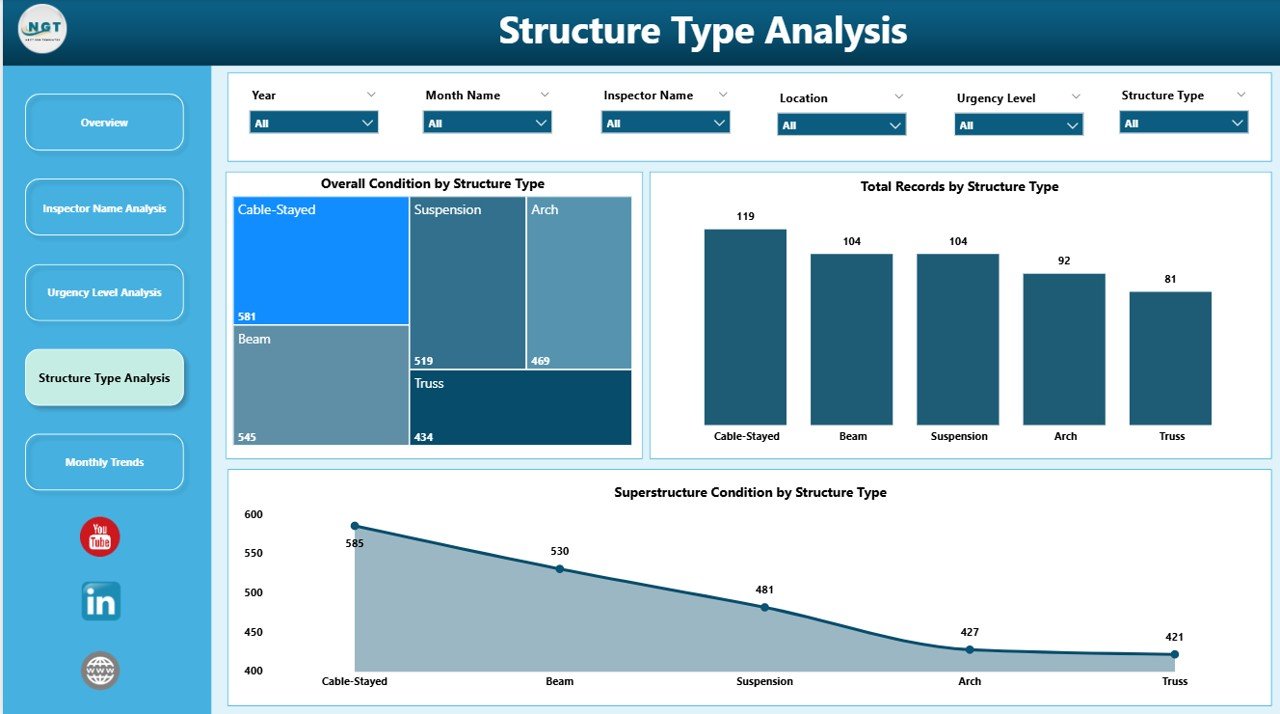
Structure Type Analysis
5. Monthly Trends
This tab provides a time series analysis to identify trends and seasonality in bridge maintenance data.
- Overall Condition by Month: Tracks the overall bridge condition over time to spot long-term patterns.
- Total Records by Month: Visualizes monthly volumes of maintenance activities conducted.
- Substructure Condition by Month: Analyzes the substructure’s condition trends on a monthly basis.
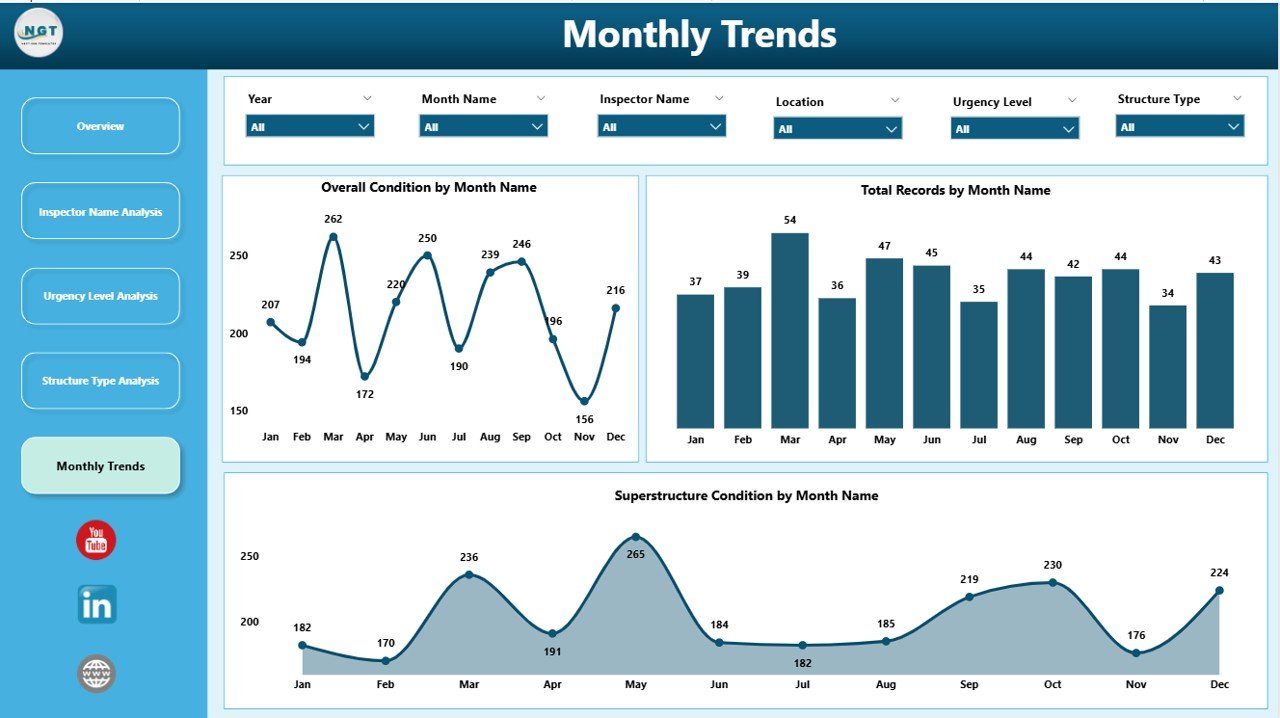
Monthly Trends
Advantages of Bridge Maintenance Dashboard in Power BI
- User-Friendly Interface: Intuitive controls allow quick filtering and data exploration.
- Time-Efficient: Simplifies complex data into clear visuals for faster decision-making.
- Customizable: Easily updated with new data and adaptable for various bridge management needs.
- Data-Driven Insights: Enables proactive maintenance prioritization by highlighting critical issues.
- Enhanced Reporting: Consolidated dashboards improve communication with stakeholders.
Opportunities for Improvement
- Incorporate real-time data integration with IoT sensors for live bridge monitoring.
- Add predictive analytics to forecast maintenance needs based on historical trends.
- Include mobile-friendly versions for field inspectors to access live data on the go.
- Integrate GIS maps to provide spatial visualization of bridge assets.
-
Click to Purchases Bridge Maintenance Dashboard in Power BI
Best Practices
- Regularly update the data file to maintain dashboard accuracy.
- Use slicers effectively to filter views based on your current analysis needs.
- Train users on interpreting visualizations to maximize the dashboard’s value.
- Keep data clean and consistent to avoid misinterpretation.
- Schedule periodic reviews and improvements based on feedback from users.
FAQs
- Q: How do I update the dashboard with new data?
A: Simply replace or update the data file connected to the Power BI report, then click Refresh in Power BI’s Home tab. - Q: Can I customize the dashboard visuals?
A: Yes, Power BI allows customization including adding filters, changing charts, and modifying layouts. - Q: Is this dashboard suitable for all types of bridges?
A: The dashboard is designed to be flexible and adaptable to different bridge types by updating the structure type data. - Q: Can multiple users access the dashboard simultaneously?
A: Yes, if published on Power BI Service, multiple users can access and interact with the dashboard online.
Conclusion
The Bridge Maintenance Dashboard in Power BI offers a powerful, easy-to-use platform for managing bridge maintenance operations efficiently. With its insightful visualizations and interactive features, it enables stakeholders to monitor conditions, track progress, and make informed decisions that prolong bridge life and enhance safety.
For further learning and live demonstrations, consider exploring Microsoft’s official Power BI resource: Power BI Official Site.
Visit our YouTube channel to watch the demo.