Rental Property Investment Dashboard in Power BI is a professionally designed, interactive Power BI template created to help property investors, landlords, real estate portfolio managers, and analysts track every aspect of their rental property investments from one centralized dashboard. This template includes 5 fully interactive pages covering Overview, Portfolio Analysis, Revenue Analysis, Occupancy Tracker, and ROI Analysis — giving you complete visibility into your property portfolio performance, occupancy trends, rental income, and investment returns.
Click here to Purchase the Rental Property Investment Dashboard in Power BI
Whether you manage a single rental property or an entire portfolio of residential and commercial units, this dashboard transforms your raw property data into clear, actionable insights. With dynamic KPI cards, interactive charts, and smart slicers, you can instantly drill down into the numbers that matter most — all inside Power BI Desktop, which is completely free to download and use.
Click here to Purchase the Rental Property Investment Dashboard in Power BI
Key Features of Rental Property Investment Dashboard in Power BI
The Rental Property Investment Dashboard in Power BI stands out as a comprehensive property management analytics tool. Here are the key features that make it an essential resource for every property investor:
- 6 Dynamic KPI Cards — The Overview page displays real-time KPI cards for Total Investment, Total Properties, Average Rent, Total Portfolio Value, Total Rent Income, and Occupancy Rate, giving you an instant snapshot of your entire portfolio health.
- 5 Interactive Dashboard Pages — Each page focuses on a different dimension of your rental business: Overview for high-level metrics, Portfolio Analysis for property mix insights, Revenue Analysis for income performance, Occupancy Tracker for vacancy and occupancy trends, and ROI Analysis for investment return evaluation.
- Smart Slicers and Filters — Every page includes interactive slicers that let you filter data by location, property type, lease status, tenant type, management type, and time period. This makes it effortless to drill down into specific segments of your portfolio.
- Professional Chart Library — The dashboard includes a wide variety of charts such as Total Rent Income by Location, Total Properties by Lease Status, Total Portfolio Value by Property Type, Total NOI by Month Name, Occupancy Rate by Property Type, and many more.
- Fully Customizable — Since this is a .pbix file, you get full editing access in Power BI Desktop. Add new pages, modify visuals, create calculated measures, and tailor the dashboard to your exact business requirements.
- No Coding Required — Simply replace the sample data with your own rental property data and the entire dashboard updates automatically. No formulas, no macros, no complex setup.
- Click here to Purchase the Rental Property Investment Dashboard in Power BI
Dashboard Pages Explained
1. Overview Page
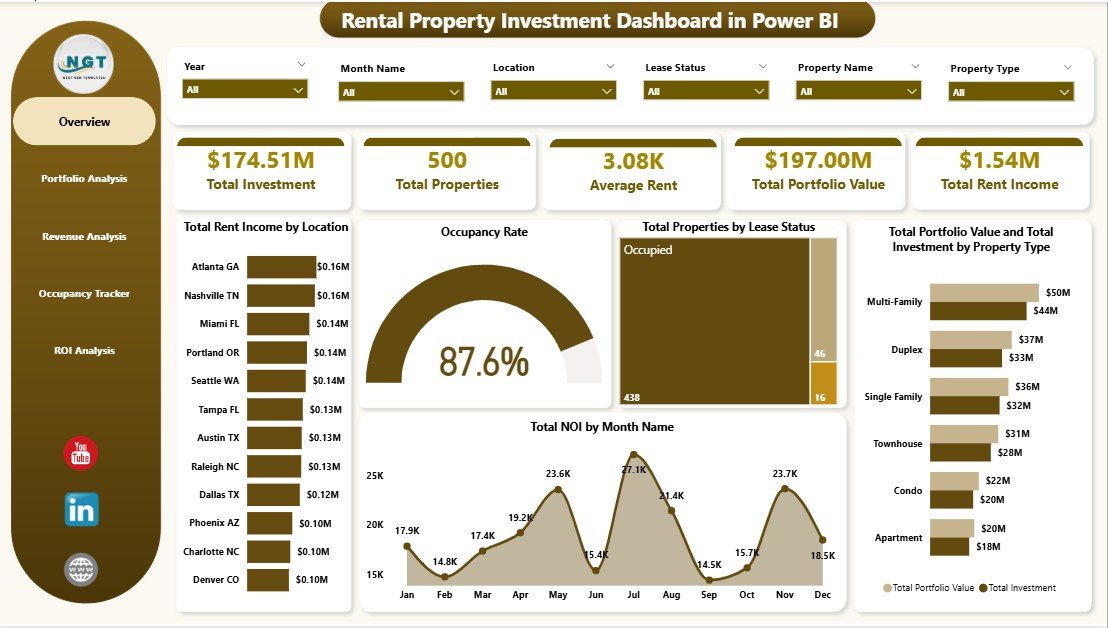
The Overview page serves as the command center for your rental property portfolio. At the top, you will find 6 KPI cards displaying Total Investment, Total Properties, Average Rent, Total Portfolio Value, Total Rent Income, and Occupancy Rate. These cards provide an immediate high-level view of your entire portfolio performance.
Below the KPI cards, interactive charts present deeper analysis. The Total Rent Income by Location chart shows you which locations generate the most rental revenue. Total Properties by Lease Status breaks down your portfolio into active, expired, and pending leases. The combined Total Portfolio Value and Total Investment by Property Type chart helps you compare how your investment is distributed across different property categories. Finally, Total NOI by Month Name reveals your net operating income trends throughout the year.
Multiple slicers are available at the top of the page, allowing you to instantly filter the entire dashboard by specific criteria and see filtered results in real time.
Rental Property Investment Dashboard in Power BI2. Portfolio Analysis
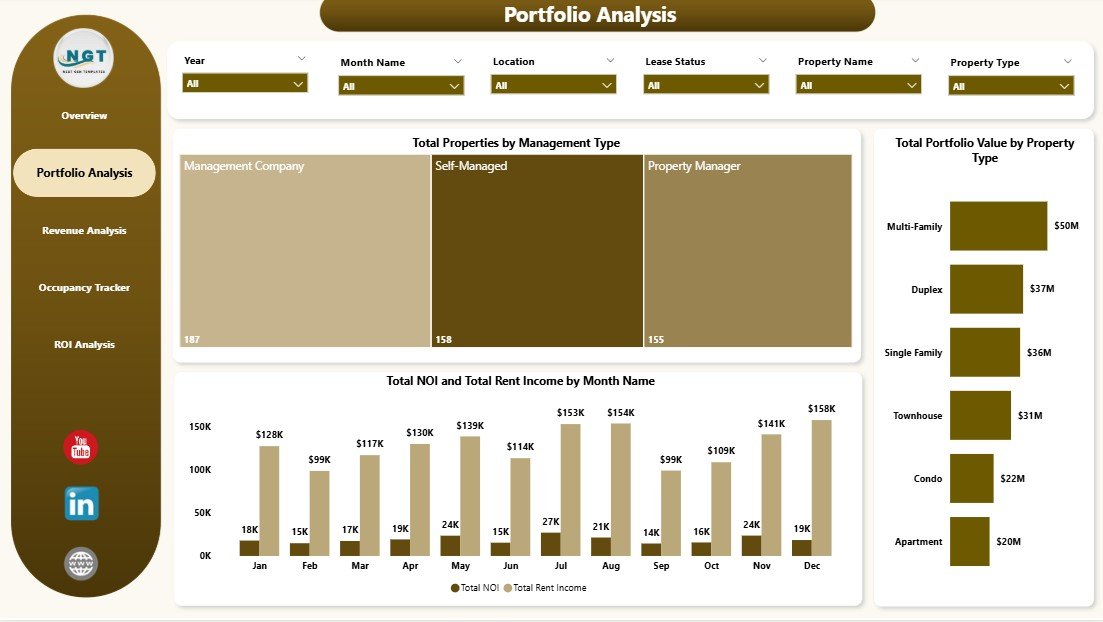
The Portfolio Analysis page dives deeper into the composition and structure of your property portfolio. This page helps you understand how your properties are distributed and which segments are driving the most value.
The Total Properties by Management Type chart reveals the split between self-managed properties, property management companies, and other management arrangements. Total Portfolio Value by Property Type shows you which property categories — such as apartments, single-family homes, commercial spaces, or mixed-use buildings — hold the highest portfolio value. The combined Total NOI and Total Rent Income by Month Name chart lets you compare your net operating income against total rent income on a monthly basis, helping you spot seasonal patterns and identify months where expenses eat into your margins.
Click here to Purchase the Rental Property Investment Dashboard in Power BI
 Portfolio Analysis
3. Revenue Analysis
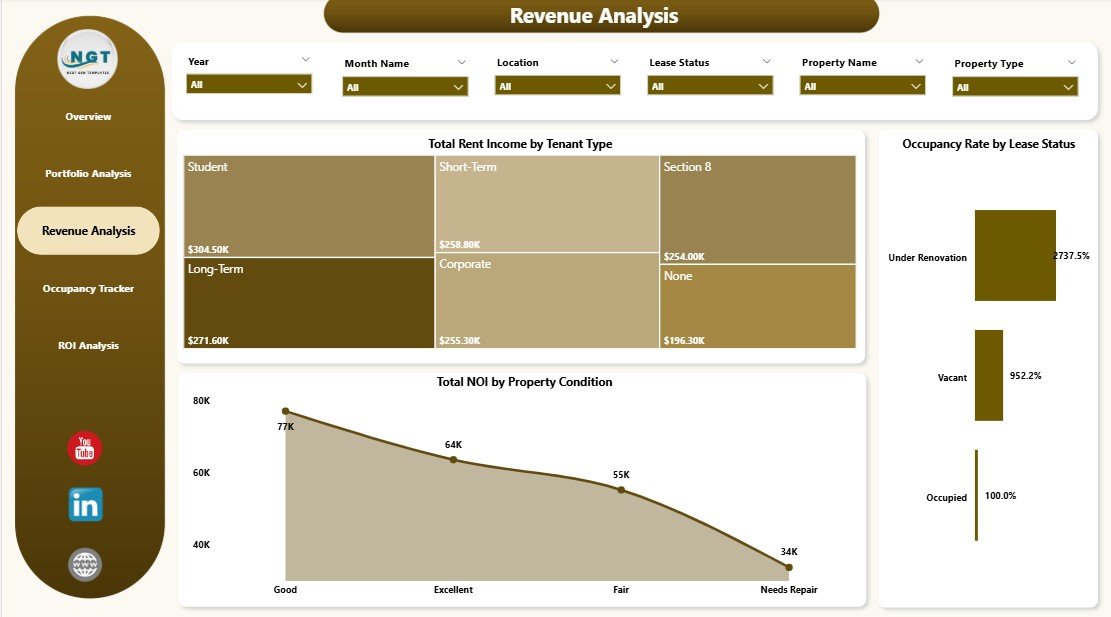
The Revenue Analysis page focuses entirely on the income side of your rental business. Understanding where your revenue comes from and how it is affected by different factors is critical for maximizing returns.
Total Rent Income by Tenant Type breaks down your rental income by tenant categories such as residential, commercial, corporate, or short-term tenants. Occupancy Rate by Lease Status shows you how occupancy varies depending on whether leases are active, month-to-month, or recently renewed. Total NOI by Property Condition reveals how the physical condition of your properties — excellent, good, fair, or poor — impacts your net operating income. This insight is invaluable for deciding where to invest in maintenance and renovation.
 Revenue Analysis
4. Occupancy Tracker
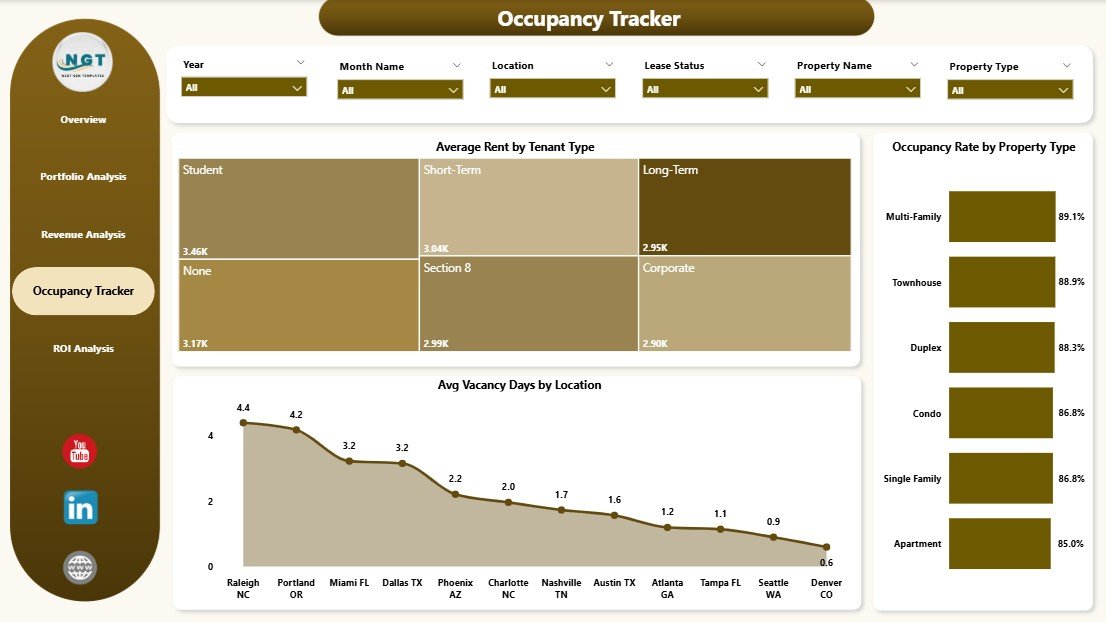
The Occupancy Tracker page is designed to help you monitor vacancy trends and optimize your occupancy strategy across your entire portfolio.
Average Rent by Tenant Type shows you how much different tenant categories are paying on average, helping you identify pricing opportunities. Occupancy Rate by Property Type reveals which property categories maintain the highest occupancy and which ones struggle with vacancies. The Avg Vacancy Days by Location chart pinpoints which geographic locations experience the longest vacancy periods, enabling you to focus your leasing efforts on underperforming areas. If you are looking for additional Power BI dashboard templates, we have a wide collection available.
 Occupancy Tracker
5. ROI Analysis
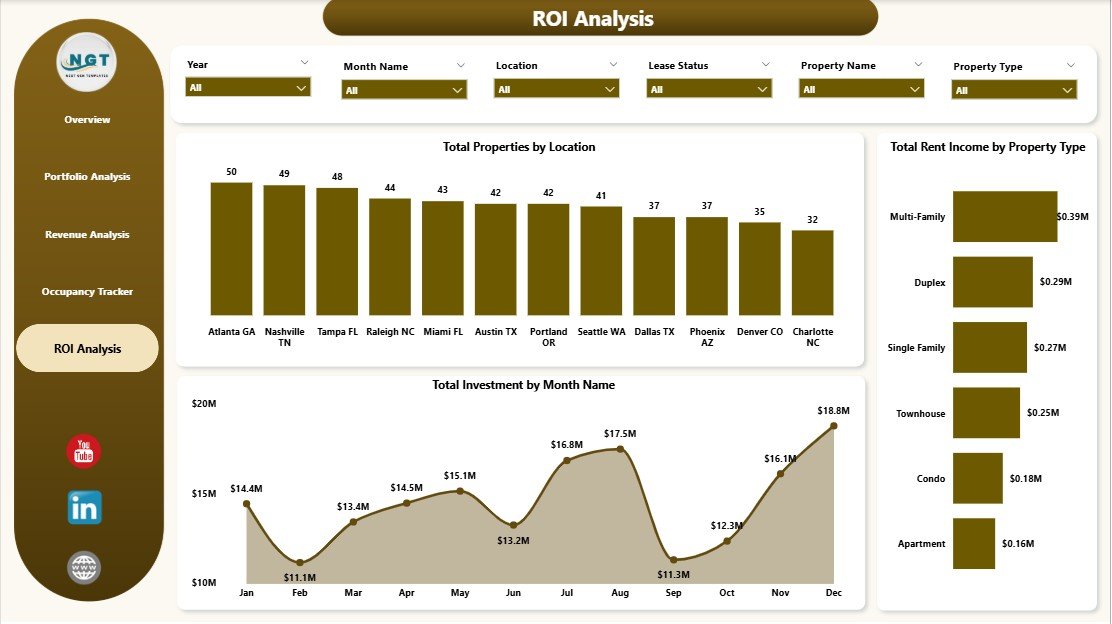
The ROI Analysis page brings everything together by evaluating investment returns across your portfolio. This is the page where data-driven investment decisions are made.
Click here to Purchase the Rental Property Investment Dashboard in Power BI
Total Properties by Location gives you a geographic breakdown of your portfolio distribution. Total Rent Income by Property Type shows which property categories generate the highest rental returns. Total Investment by Month Name tracks how your capital allocation has changed over time, helping you visualize your investment growth trajectory. Together, these charts provide a comprehensive picture of where your money is working hardest and where adjustments might be needed.
 ROI Analysis
Advantages of Using the Rental Property Investment Dashboard in Power BI
- Centralized Property Analytics — Stop juggling multiple spreadsheets and scattered reports. This dashboard brings all your rental property data into one unified, interactive view that updates in real time.
- Data-Driven Decision Making — With 5 dedicated analysis pages and 6 KPIs, you can make informed decisions about where to invest, which properties to improve, and how to optimize your rental strategy.
- Time Savings — The pre-built dashboard structure eliminates the need to build reports from scratch. Replace the sample data and your dashboard is ready within minutes.
- Professional Presentation — The clean, executive-level design makes this dashboard perfect for sharing with stakeholders, banks, partners, and co-investors who need to see your portfolio performance at a glance.
- Scalable — Whether you have 5 properties or 500, this dashboard scales with your portfolio. Power BI handles large datasets efficiently, so performance remains smooth as your portfolio grows.
Opportunities for Improvement
- Predictive Analytics — Adding forecasting models for rental income, occupancy rates, and property values could help investors plan ahead with more confidence.
- Expense Tracking — Including a dedicated expense analysis page with maintenance costs, property taxes, and insurance breakdowns would provide a more complete financial picture.
- Tenant Scoring — Integrating tenant reliability or payment history metrics could add another layer of portfolio risk assessment.
- Market Comparison — Adding benchmarks against local market rental rates and occupancy averages would help investors evaluate relative performance.
Best Practices for Using This Dashboard
- Update Your Data Monthly — For the most accurate insights, refresh your property data at least once a month so that KPIs and charts reflect your latest numbers.
- Use Slicers Strategically — Take advantage of the interactive slicers to compare performance across different locations, property types, and time periods. This is where the real analytical power lies.
- Share with Stakeholders — Export key pages as PDFs or publish to the Power BI Service to share insights with partners, accountants, and property managers.
- Customize to Your Needs — Do not hesitate to add custom calculated measures, new pages, or additional filters that are specific to your portfolio requirements.
- Monitor NOI Trends — Pay close attention to the Net Operating Income trends by month. Sudden drops could indicate rising expenses or declining occupancy that need immediate attention.
If you prefer using Excel, you can also check out the Rental Property Investment Dashboard in Excel. For those interested in office space analytics, we also have an Office Space Leasing KPI Dashboard in Power BI.
Explore Relevant Templates
- Rental Property Investment Dashboard in Excel — The Excel version of this template for spreadsheet-based property analysis.
- Real Estate Dashboard in HTML — A browser-based real estate analytics dashboard with no software installation needed.
- Office Space Leasing KPI Dashboard in Power BI — Dedicated Power BI template for commercial office space leasing performance tracking.
- Home Affordability Calculator in Excel — Evaluate home buying affordability with this handy Excel calculator.
Frequently Asked Questions
What is the best Power BI dashboard for tracking rental property investments?
The Rental Property Investment Dashboard in Power BI from NextGenTemplates is one of the best options available. It includes 5 interactive dashboard pages covering portfolio analysis, revenue tracking, occupancy monitoring, and ROI analysis. The template tracks 6 key KPIs including Total Investment, Total Properties, Average Rent, Total Portfolio Value, Total Rent Income, and Occupancy Rate.
How do I use a rental property dashboard in Power BI?
Download the .pbix file, open it in Power BI Desktop (free from Microsoft), and replace the sample data with your own rental property data. All charts, KPIs, and filters update automatically. Use the interactive slicers to filter data by location, property type, lease status, and more.
What KPIs should I track for rental property investments?
Key KPIs for rental property investments include Total Investment, Total Portfolio Value, Total Rent Income, Average Rent, Occupancy Rate, Net Operating Income (NOI), Vacancy Days, and ROI by property type and location. The Rental Property Investment Dashboard in Power BI tracks all of these metrics across 5 interactive pages.
Can I customize this Power BI rental property dashboard?
Yes. Since this is a .pbix file, you have full editing access in Power BI Desktop. You can add new charts, modify existing visuals, change colors, create custom calculated measures, add additional pages, and tailor the dashboard to your specific portfolio requirements.
Do I need a Power BI license to use this dashboard?
No. Power BI Desktop is completely free to download and use. You only need a Power BI Pro or Premium license if you want to publish and share your dashboard online through the Power BI Service. For personal analysis and local use, the free desktop version is all you need.
Is this dashboard suitable for large rental property portfolios?
Absolutely. Power BI is designed to handle large datasets efficiently. Whether you manage 10 properties or 500, this dashboard scales with your portfolio. The interactive slicers and filters make it easy to navigate even the largest datasets and focus on specific segments.
Conclusion
The Rental Property Investment Dashboard in Power BI is a must-have tool for anyone serious about managing rental property investments with data-driven precision. With 5 interactive pages, 6 dynamic KPI cards, and a comprehensive chart library, this template delivers complete visibility into portfolio composition, revenue performance, occupancy trends, and investment returns — all in a beautifully designed, ready-to-use Power BI file.
Stop relying on scattered spreadsheets and manual calculations. Click here to Purchase the Rental Property Investment Dashboard in Power BI and start making smarter investment decisions today.
Visit our YouTube channel for step-by-step video tutorials on Power BI dashboards and more: Youtube.com/@PK-AnExcelExpert
Click here to Purchase the Rental Property Investment Dashboard in Power BI