Corporate Secretarial Dashboard in Excel is a ready-to-use reporting template for company secretaries, legal teams, compliance officers, and governance managers who need a clearer way to monitor filing activity, service fees, review workload, late filing exposure, penalties, and client satisfaction. Instead of reviewing disconnected registers or manually preparing monthly summaries, this Excel dashboard organizes the work into 5 analytical dashboard pages, 5 KPI cards, multiple slicers, a Data Sheet, and a Support Sheet powered by pivot tables.
Microsoft Excel remains one of the most practical tools for recurring business reporting because it supports structured tables, pivots, charts, slicers, and local workbook control. You can learn more about Excel tables and structured data from Microsoft Support’s Excel table overview. This dashboard uses that familiar workflow: update the data, refresh all, and review the visuals.
Key Features of Corporate Secretarial Dashboard in Excel
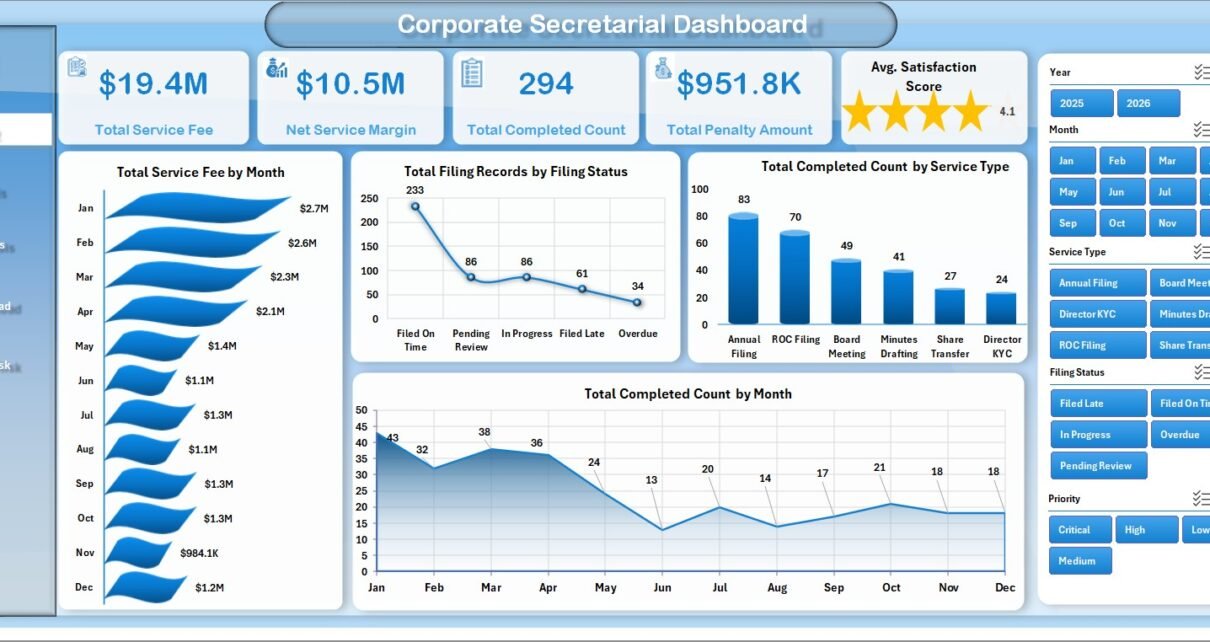
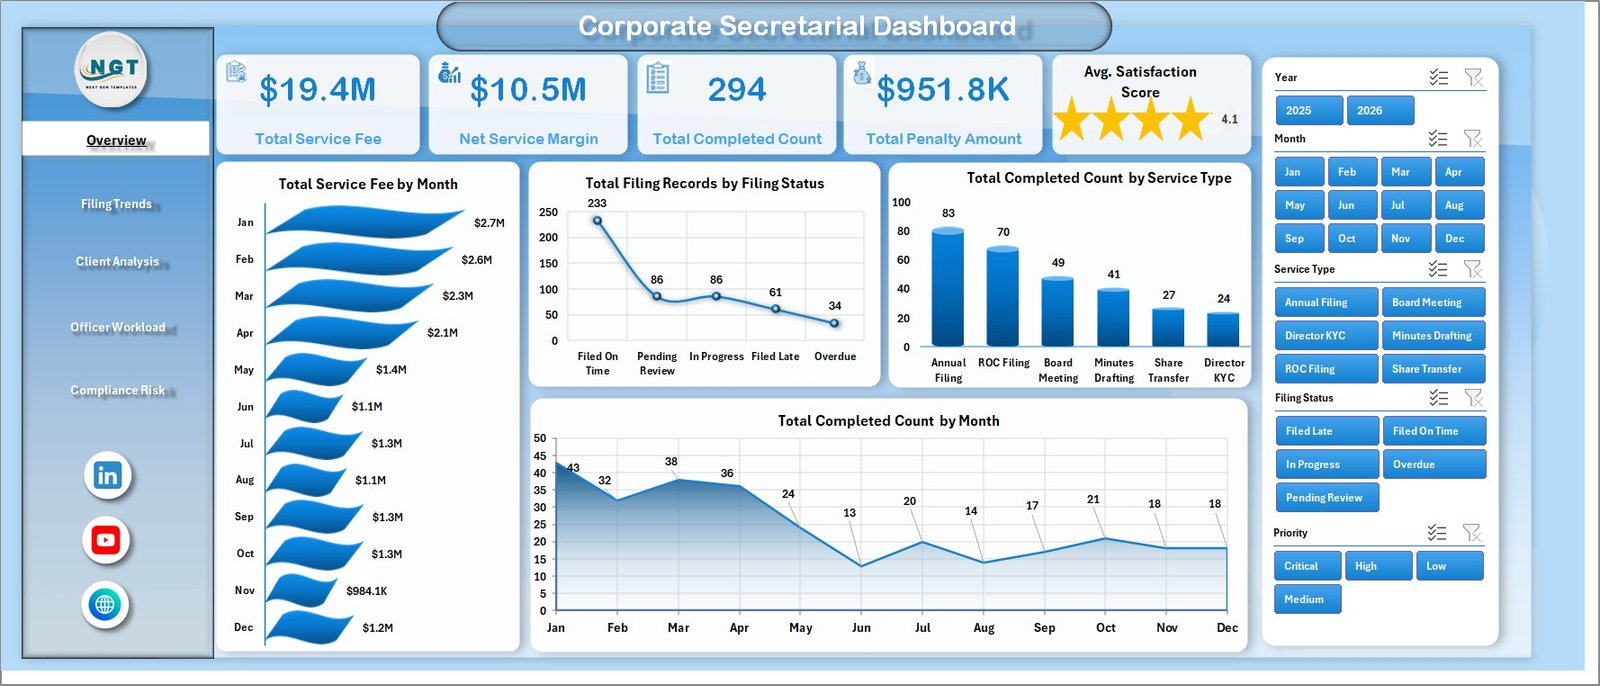
- 5 KPI cards show Total Service Fee, Net Service Margin, Total Completed Count, Total Penalty Amount, and Avg. Satisfaction Score.
- 5 dashboard pages cover Overview, Filing Trends, Client Analysis, Officer Workload, and Compliance Risk.
- 19 chart views analyze fees, filing records, completed count, review hours, late filing %, penalties, jurisdictions, entities, officers, priorities, and compliance categories.
- Multiple slicers help users filter the dashboard quickly without editing formulas or rebuilding charts.
- Data Sheet tab stores the source records in a structured format for easy updating.
- Support Sheet tab contains pivot tables that drive the dashboards and can be hidden after setup.
- Excel-native design means no monthly subscription, no login, and full workbook editability.
Dashboard Pages Explanation
1. Overview Page
The Overview Page works as the executive summary. At the top, cards show Total Service Fee, Net Service Margin, Total Completed Count, Total Penalty Amount, and Avg. Satisfaction Score so management can quickly understand the overall health of secretarial operations.
Total Service Fee by Month: This chart shows monthly service fee movement and helps identify high-demand periods. It is useful for revenue review, workload planning, and client service discussions.
Total Filing Records by Filing Status: This chart breaks down filings by status, helping teams see completed, pending, late, or review-stage records. It gives a quick view of backlog and process bottlenecks.
Total Completed Count by Service Type: This chart compares completed work across different secretarial service types. It helps leaders understand which services consume the most operating effort.
Total Completed Count by Month: This monthly trend shows how completion output changes over time. It helps teams spot slow months and compare delivery volume across reporting periods.
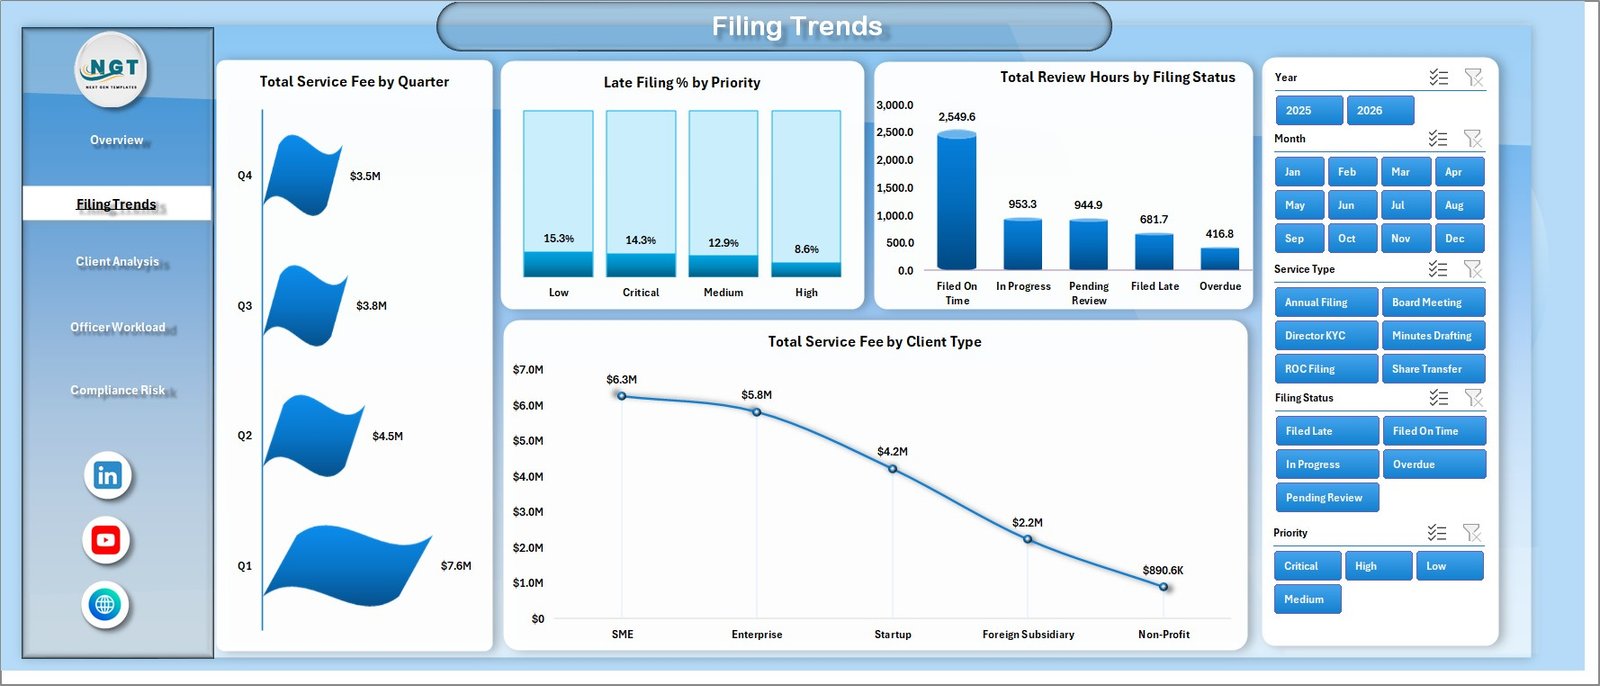
2. Filing Trends
The Filing Trends sheet focuses on time, priority, status, and client type. It includes Total Service Fee by Quarter, Late Filing % by Priority, Total Review Hours by Filing Status, and Total Service Fee by Client Type.
Total Service Fee by Quarter shows fee movement at quarter level, making it easier to discuss performance in board or management reviews. Late Filing % by Priority highlights where urgent or high-priority work may be creating compliance risk. Total Review Hours by Filing Status shows how much time is being spent in each status, while Total Service Fee by Client Type connects revenue to client segmentation.
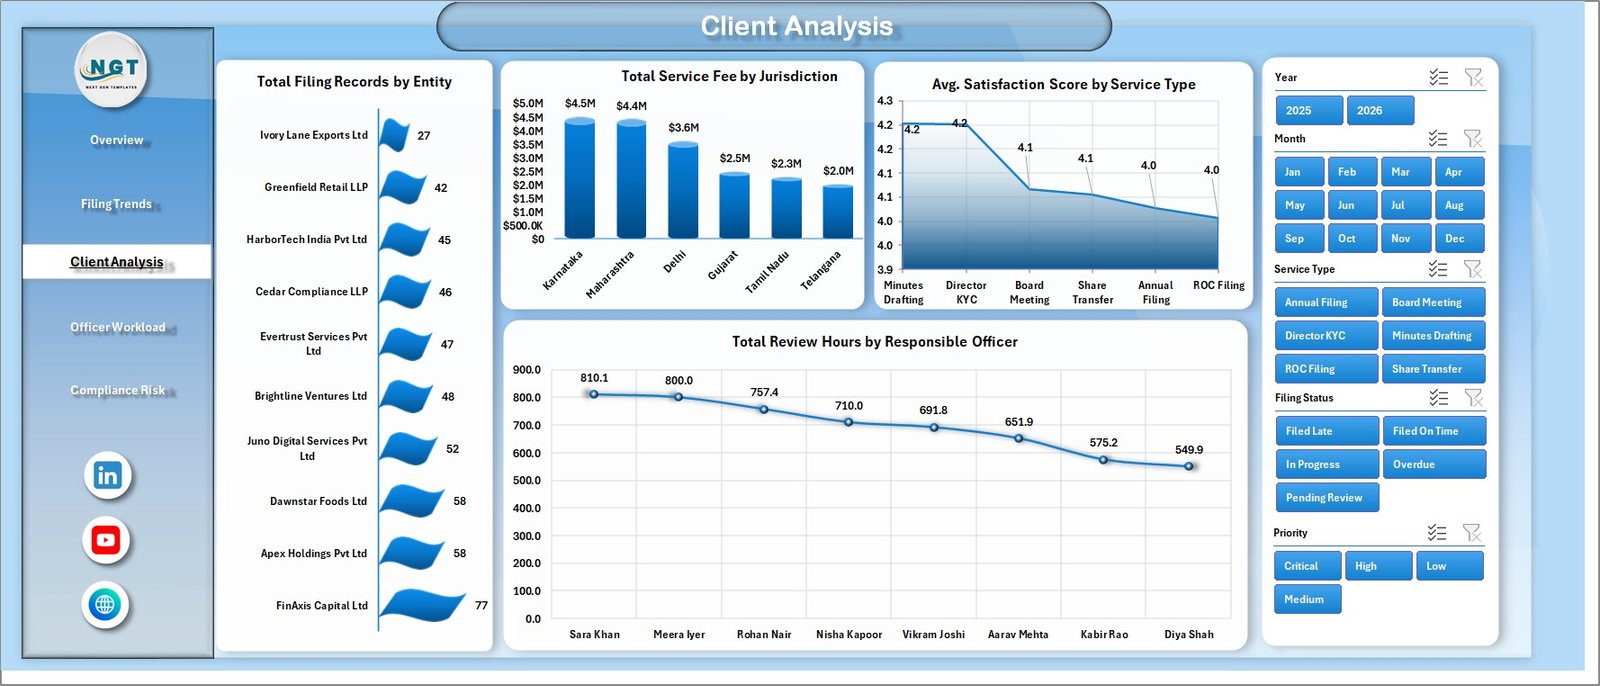
3. Client Analysis
The Client Analysis page helps users review entity, jurisdiction, service, and officer-level results. It includes Total Filing Records by Entity, Total Service Fee by Jurisdiction, Avg. Satisfaction Score by Service Type, and Total Review Hours by Responsible Officer.
This sheet is helpful when a team manages multiple companies, subsidiaries, regions, or client portfolios. It shows which entities have the most filing records, which jurisdictions contribute the highest service fee, which service types have stronger satisfaction, and which officers are carrying the highest review-hour workload.
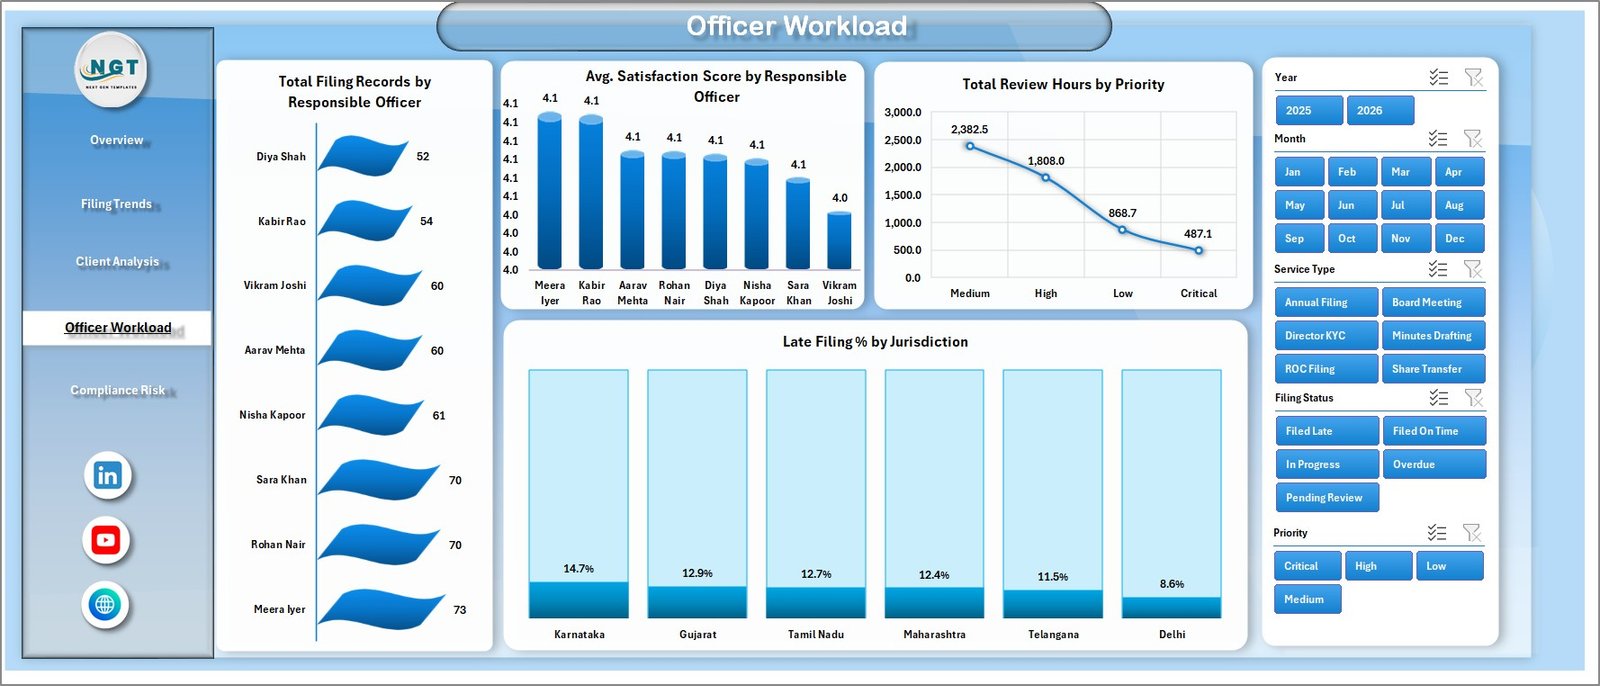
4. Officer Workload
The Officer Workload sheet is designed for capacity and accountability review. It includes Total Filing Records by Responsible Officer, Avg. Satisfaction Score by Responsible Officer, Total Review Hours by Priority, and Late Filing % by Jurisdiction.
These visuals help managers see whether work is balanced fairly, whether officer-level satisfaction differs, how review hours change by priority, and which jurisdictions have higher late filing rates. This is useful for weekly workload reviews and compliance service improvement.
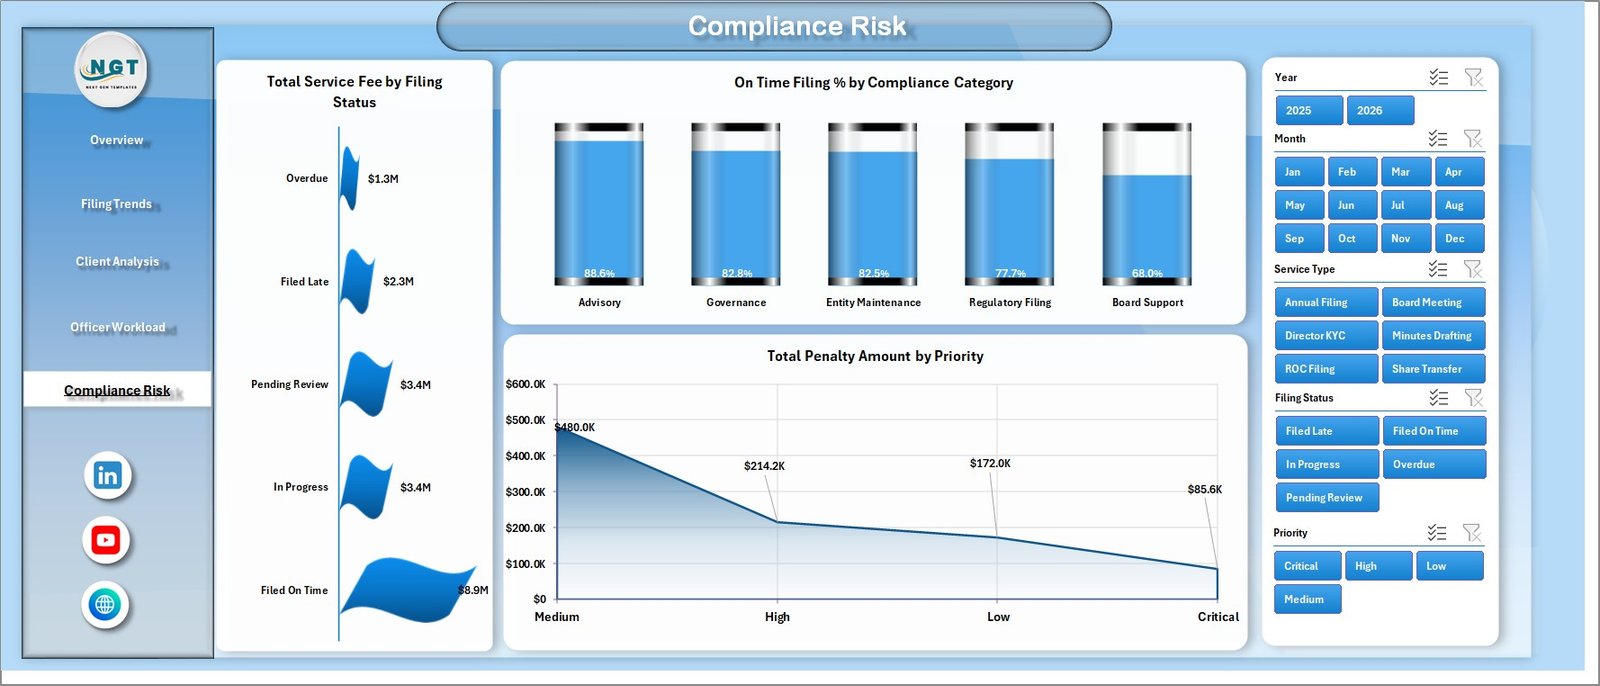
5. Compliance Risk
The Compliance Risk page focuses on risk exposure and penalty visibility. It includes Total Service Fee by Filing Status, On Time Filing % by Compliance Category, and Total Penalty Amount by Priority.
This page helps teams understand whether late or risky filings are concentrated in specific categories, statuses, or priorities. It is especially useful before audit meetings, statutory review sessions, or management discussions about penalty reduction.
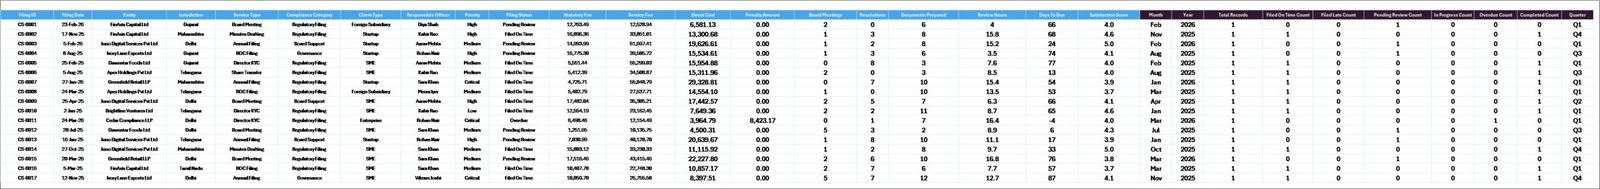
6. Data Sheet Tab
The Data Sheet stores the raw corporate secretarial records. Users should add data in the same structure so the dashboards, pivots, slicers, and charts continue to update correctly.
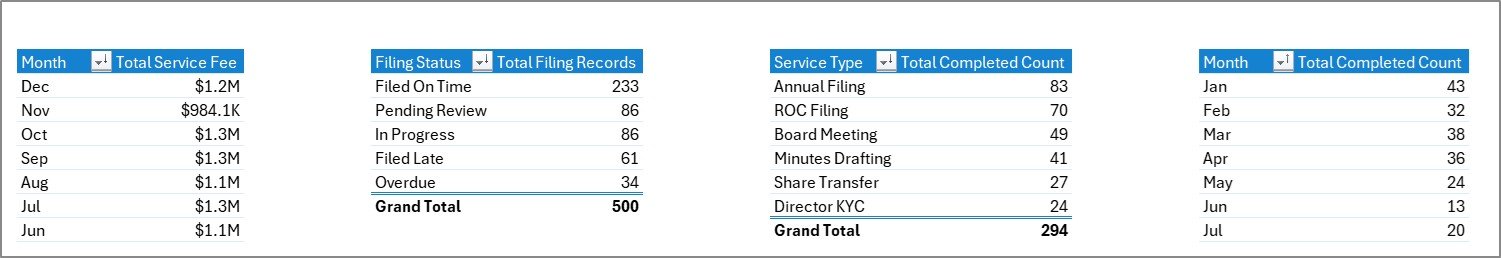
7. Support Sheet
The Support Sheet contains multiple pivot tables used to create the full dashboard dynamically. After updating the Data Sheet, go to the Data tab in the Excel Ribbon and click Refresh All. The pivot tables and dashboard charts will refresh together. You can keep this sheet hidden for normal use.
Corporate Secretarial Dashboard in Excel vs. Google Sheets vs. Paid CRM/SaaS – Feature Comparison
| Feature | Corporate Secretarial Dashboard in Excel | Google Sheets Alternative | Paid Compliance SaaS |
|---|---|---|---|
| Cost | $17.99 one-time | Template cost or manual build | $50-$500+ per month |
| Platform | Microsoft Excel | Google Sheets | Vendor cloud app |
| Setup time | Open workbook, update data, refresh | Copy file and configure sharing | Onboarding, setup, permissions |
| Real-time team collaboration | Possible with OneDrive or SharePoint | Native Google collaboration | Usually available by user seat |
| Mobile access | Excel mobile with layout limits | Google Sheets app | Usually available |
| Customizable fields | Fully editable workbook | Editable spreadsheet | Limited by vendor settings |
| Share with link | Possible through cloud storage | Yes | Often requires login |
| Year-1 cost at 5 users | $17.99 total | Template cost or build time | $3,000-$30,000+ |
| Penalty and late filing views | Included | Needs setup | Usually higher-tier feature |
Who Should Use This Template
This template is useful for company secretaries, corporate legal teams, compliance officers, governance teams, secretarial service providers, accounting firms handling statutory filing support, and managers who need a recurring view of filings, fees, penalties, workload, and satisfaction.
It is not designed for users who need live government portal integrations, automated statutory filing submission, e-signature approvals, workflow routing, or legal entity management software with role-based access. It is a reporting dashboard, not a filing portal.
Real-World Use Cases
Aisha, company secretary: She uses the Overview page before monthly governance meetings to explain service fee movement, completed filing count, penalties, and satisfaction.
Daniel, legal operations manager: He uses Officer Workload to compare review hours and late filing percentages before reallocating work between responsible officers.
Meera, compliance consultant: She uses Client Analysis to review filing records by entity and service fee by jurisdiction across multiple clients.
Advantages of Corporate Secretarial Dashboard in Excel
Fast reporting: The dashboard replaces manual chart building with ready-made pages and slicers.
Better visibility: Leaders can see fees, margins, workload, penalties, and risk from one workbook.
Lower cost: A one-time Excel template is easier to adopt than monthly compliance SaaS for many small and mid-sized teams.
Editable structure: Users can customize fields, formulas, charts, colors, and pivot tables if their process changes.
Opportunities for Improvement
The dashboard does not include automatic data sync, filing portal integration, reminder emails, document management, or approval workflows. Teams that need these features can use this workbook as a reporting layer after exporting or preparing their filing data.
Best Practices
- Keep the Data Sheet column structure consistent.
- Refresh all pivot tables after every data update.
- Validate filing status, priority, jurisdiction, and officer names before refreshing.
- Use slicers during review meetings to answer follow-up questions quickly.
- Keep a backup before editing formulas, pivot tables, or dashboard layouts.
Explore Relevant Templates
Corporate Secretarial Dashboard in Excel – purchase the Excel dashboard template on NextGenTemplates.
Corporate Secretarial KPI Dashboard in Excel – KPI-focused tracking for corporate secretarial teams.
Legal Research KPI Dashboard in Power BI – Power BI reporting for legal research performance.
Browse all MS Excel templates and Excel Dashboard templates.
Frequently Asked Questions
What does the Corporate Secretarial Dashboard in Excel track?
It tracks service fees, net service margin, completed filings, penalty amount, satisfaction score, filing status, service type, review hours, priority, client type, jurisdiction, entity, officer workload, and compliance category.
Do I need advanced Excel knowledge?
No. The normal workflow is to update the Data Sheet, click Refresh All, and use slicers. Advanced Excel skills are only needed if you want to customize the workbook.
Can I add my own filing records?
Yes. Add your records in the same Data Sheet format and refresh the workbook.
Can I hide the Support Sheet?
Yes. The Support Sheet contains pivot tables and can be hidden after setup, but it should remain in the workbook because it powers the charts.
Does this dashboard submit filings automatically?
No. It is an Excel reporting dashboard for analysis and review. It does not submit filings to regulators or government portals.
Can I customize charts and slicers?
Yes. The workbook is editable, so you can adjust charts, slicers, formatting, and pivot tables based on your reporting needs.
About the Author
Built by PK – Microsoft Certified Professional with 15+ years of Excel, Google Sheets, and Power BI experience. Founder of NextGenTemplates, reaching 300K+ subscribers across YouTube channels. Every template is hand-built and tested before release.
Conclusion
The Corporate Secretarial Dashboard in Excel is a practical way to turn filing records into clear management reporting. It gives teams a structured view of fees, completions, penalties, review workload, satisfaction, and compliance risk without introducing another monthly software subscription.
Download Corporate Secretarial Dashboard in Excel – $17.99 (Regular $24.99)
Visit our YouTube channel to learn step-by-step Excel dashboard tutorials.
Last updated: May 2026