The Digital Comic Startups Dashboard in Power BI gives founders, investors, media analysts, and entertainment consultants a ready-made way to review digital comic startup performance across valuation, funding, revenue, operating cost, net profit, genre, country, region, monetization model, platform type, and status. The report includes 5 Power BI pages, 5 executive KPI cards, 15+ chart views, and interactive slicers, so users can move from a high-level portfolio view to filtered insights without building every visual from scratch.
Digital comics, webtoons, mobile comic apps, creator-led publishing platforms, and licensing-driven entertainment startups often create data across several systems. When that data stays scattered in exports, investor notes, and monthly reports, it becomes difficult to answer simple questions: Which region is profitable? Which genre is growing? Which funding stage has better margin? This Power BI dashboard creates a cleaner reporting layer for those decisions.
Key Features of Digital Comic Startups Dashboard in Power BI
- 5 executive KPI cards: Total Valuation, Total Startups, Total Revenue, Total Operating Cost, and Net Profit.
- 5 report pages: Overview Page, Funding Trend, Genre Insights, Regional Analysis, and Status Tracking.
- Interactive slicers: Filter pages by dimensions such as region, genre, country, funding stage, platform type, monetization model, status, or month.
- Startup-specific visuals: Analyze valuation, funding, revenue, operating cost, profit margin, net profit, average rating, and status.
- Editable PBIX format: Open the file in Power BI Desktop, replace the sample data, adjust visuals, and publish through Power BI Service if needed.
For users who are new to Power BI, Microsoft provides a helpful introduction to getting started with Power BI Desktop.
Dashboard Pages Explanation
1. Overview Page
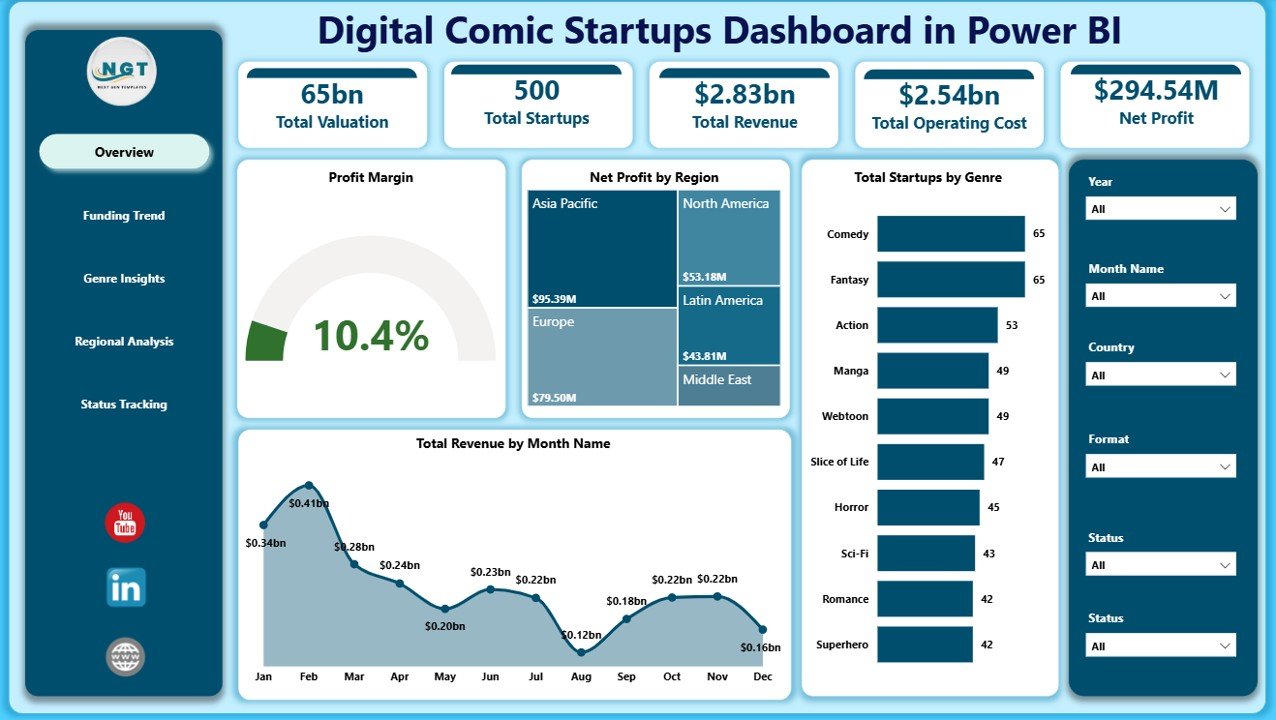
The Overview Page is the executive summary of the report. The top KPI cards show Total Valuation, Total Startups, Total Revenue, Total Operating Cost, and Net Profit, giving leadership a fast view of scale, business activity, and financial outcome.
Profit Margin: This visual shows how efficiently digital comic startups are converting revenue into profit. It helps founders and analysts see whether the business model is creating healthy margin or only increasing top-line revenue.
Net Profit by Region: This chart compares profitability across regions. It helps identify markets where comic startups are generating stronger returns and regions where operating cost may be reducing profit.
Total Startups by Genre: This visual shows startup count by comic genre. It helps users understand which content categories attract more startup activity and where competition may be heavier.
Total Revenue by Month Name: This chart tracks monthly revenue movement. It is useful for spotting seasonal patterns, growth months, and periods that need deeper review.
Digital Comic Startups Dashboard in Power BI
2. Funding Trend
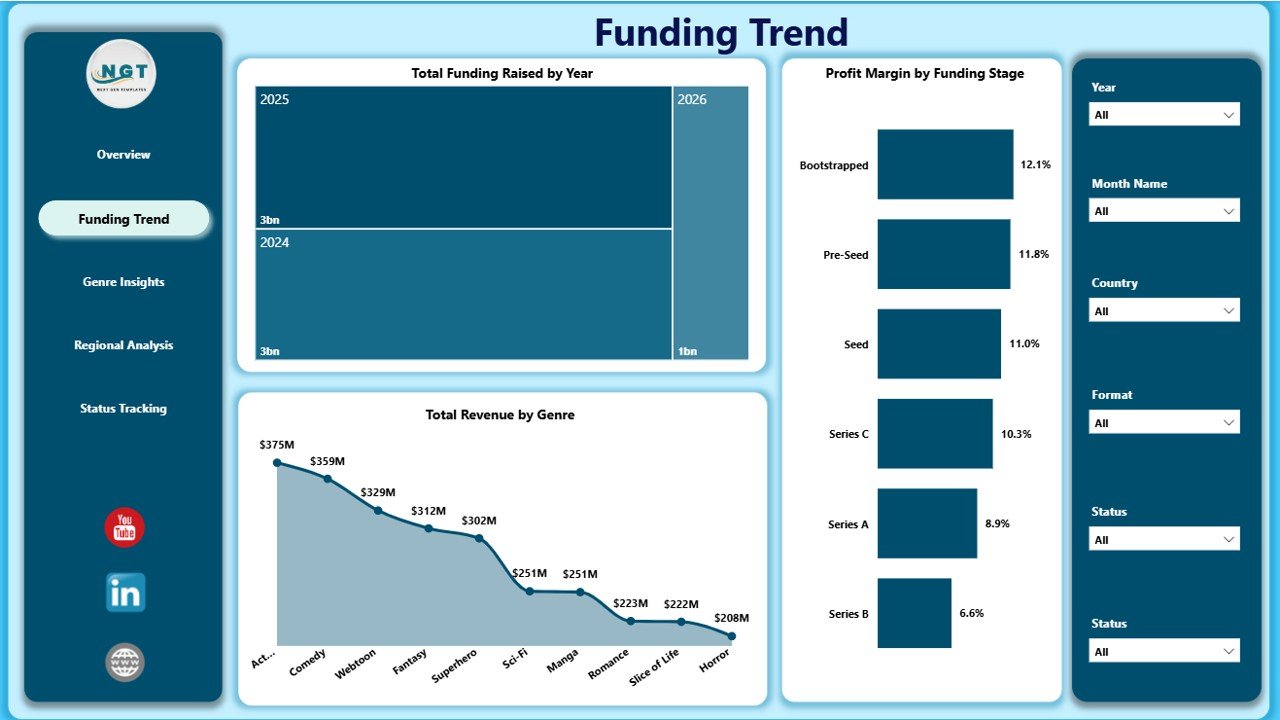
The Funding Trend page focuses on capital movement and funding-stage performance. It is useful for founder updates, venture analysis, startup accelerator reviews, and entertainment portfolio reporting.
Total Funding Raised by Year: This chart shows funding movement across years. It helps investors and analysts see whether funding momentum is rising, falling, or concentrated in a specific period.
Profit Margin by Funding Stage: This chart compares margin by startup maturity. It can show whether early-stage, growth-stage, or later-stage startups are operating more efficiently.
Total Revenue by Genre: This visual connects genre strategy with commercial outcome. It helps teams understand whether certain comic categories are producing stronger revenue than others.
Funding Trend
3. Genre Insights
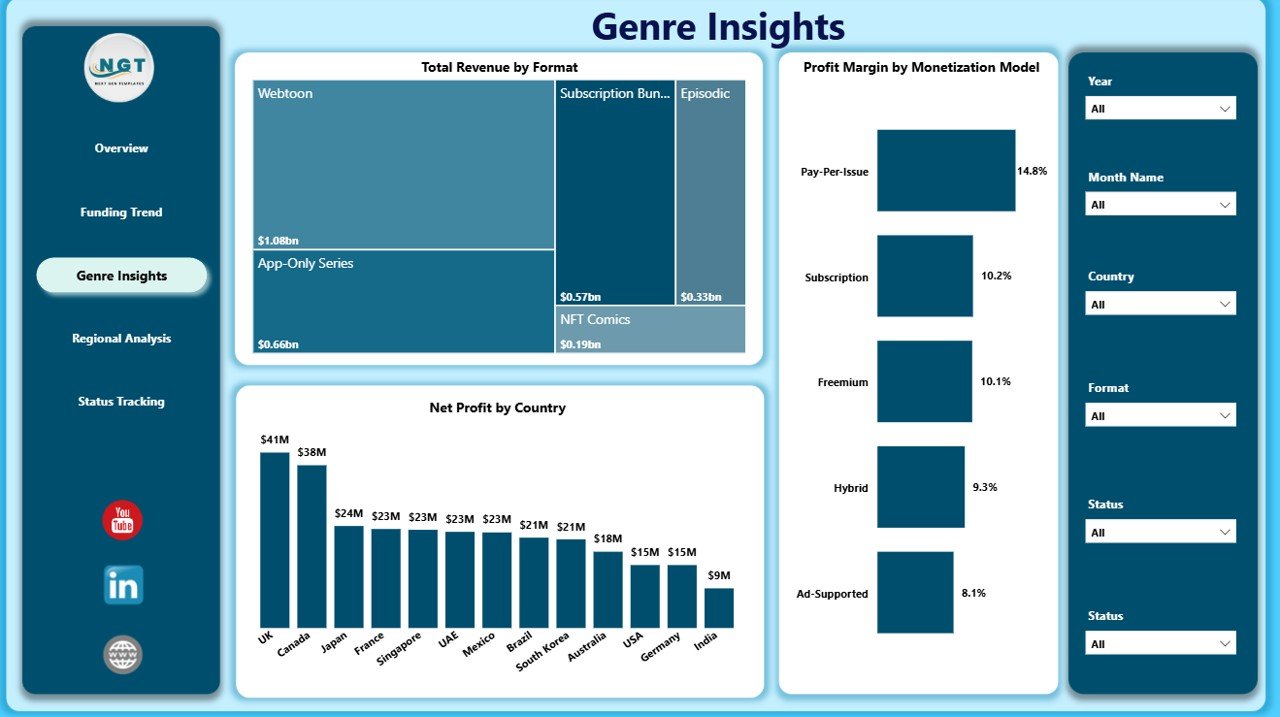
The Genre Insights page helps users study content performance, monetization strategy, and country-level profit. It is especially useful for teams comparing webcomic formats, mobile comic products, subscriptions, ad-supported models, and licensing-led revenue.
Total Revenue by Format: This chart compares revenue by content or delivery format. It helps reveal whether mobile-first, webcomic, episodic, graphic-novel, or other formats are contributing more revenue.
Profit Margin by Monetization Model: This visual compares business model efficiency. It helps users see whether subscription, ads, freemium, marketplace, licensing, or mixed monetization performs better.
Net Profit by Country: This chart shows country-level profit contribution. It helps founders and analysts identify high-return markets and countries that may need pricing, cost, or localization review.
Genre Insights
4. Regional Analysis
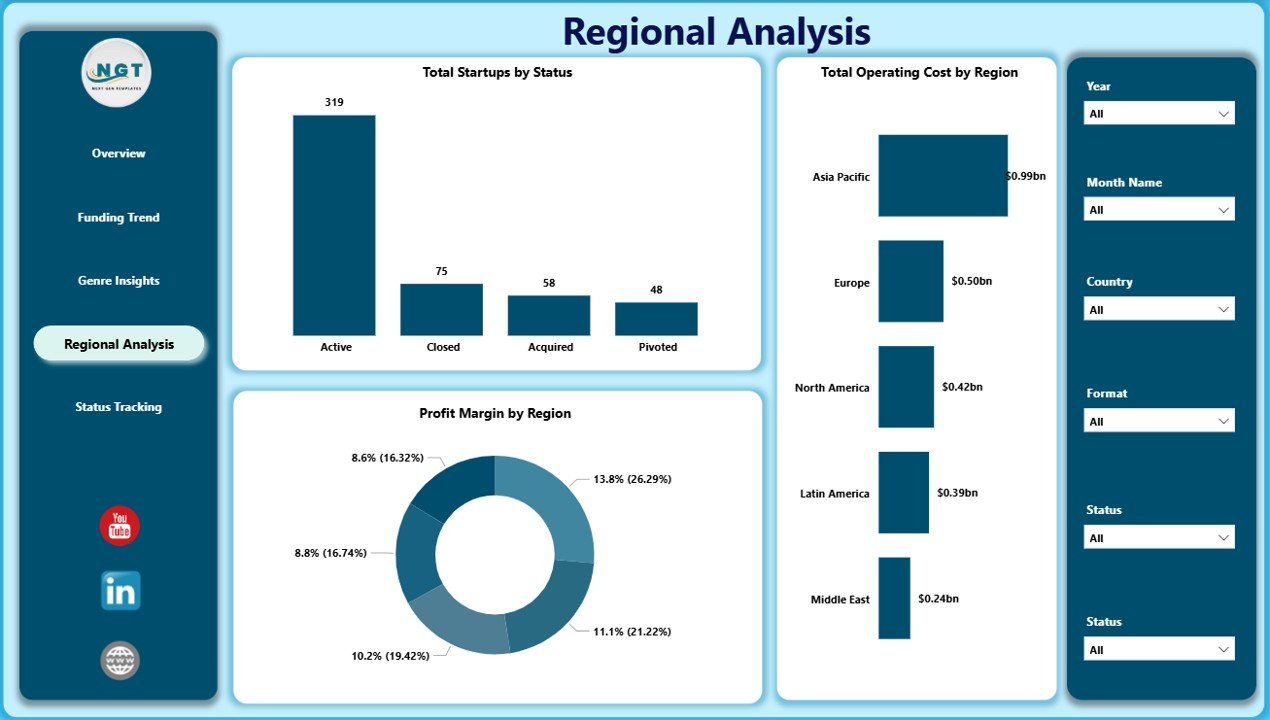
The Regional Analysis page looks at operating status, cost, and regional profitability. It helps teams compare business conditions across markets rather than relying only on total revenue.
Total Startups by Status: This chart summarizes the portfolio by status. It helps users see how many startups are active, scaling, paused, acquired, closed, or in another lifecycle category.
Total Operating Cost by Region: This visual highlights where cost is concentrated. It helps finance teams investigate high-cost regions and compare cost movement against revenue and profit.
Profit Margin by Region: This chart compares financial efficiency across regions. It helps identify markets where comic startups are operating profitably and regions where margin pressure is visible.
Regional Analysis
5. Status Tracking
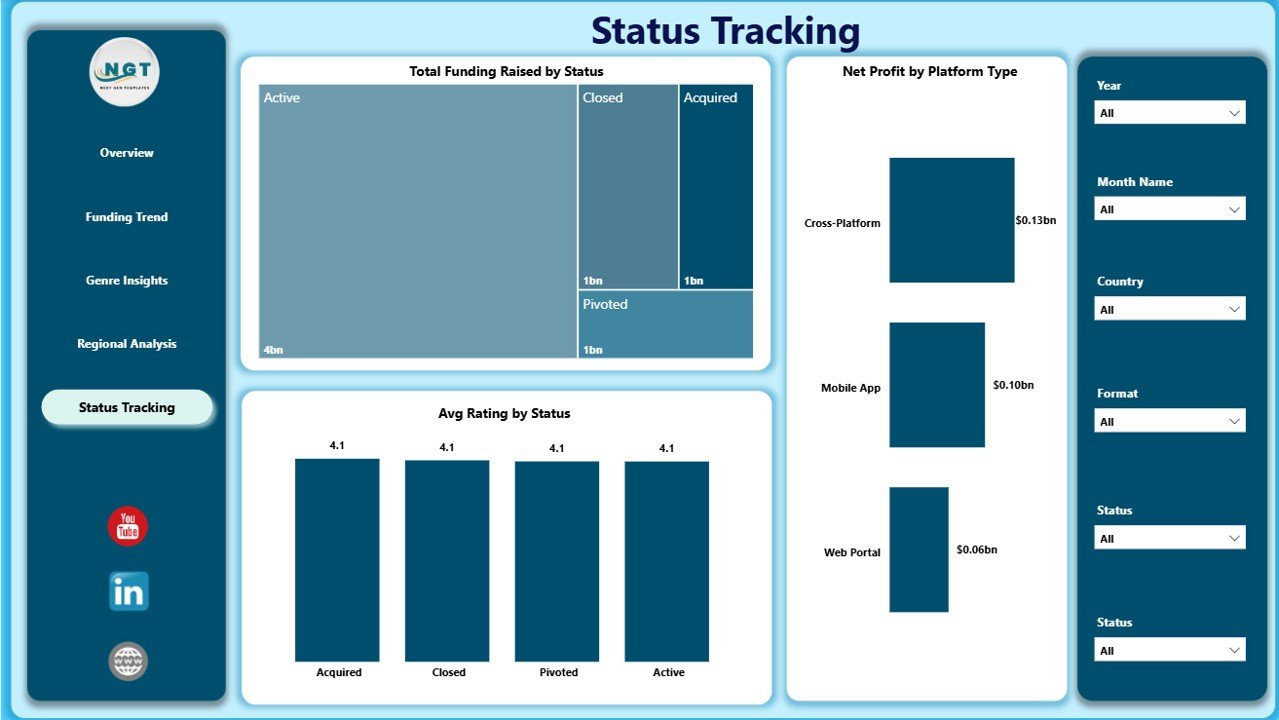
The Status Tracking page is designed for portfolio monitoring. It connects funding, platform type, and average rating with startup lifecycle status.
Total Funding Raised by Status: This chart shows how funding is distributed across operating states. It helps investors understand whether capital is concentrated in active, scaling, paused, or acquired startups.
Net Profit by Platform Type: This visual compares profitability across app, web, marketplace, hybrid, or other platform types. It helps product teams see which delivery model is producing better financial results.
Avg Rating by Status: This chart connects user satisfaction with startup status. It helps analysts see whether stable or scaling startups also have stronger average ratings.
Status Tracking
Digital Comic Startups Dashboard in Power BI vs. Tableau vs. Paid CRM/SaaS – Feature Comparison
| Feature | This Power BI Dashboard | Tableau or Qlik Alternative | Paid Analytics SaaS |
|---|---|---|---|
| Cost | $17.99 one-time | License or custom build cost | Monthly or annual subscription |
| Platform | Power BI Desktop / Power BI Service | BI platform setup required | Vendor-hosted cloud system |
| Setup time | Open PBIX, connect data, refresh | Build model and visuals | Implementation and onboarding |
| Real-time team collaboration | Available through Power BI Service if published | Available through cloud setup | Usually seat-based |
| Mobile access | Possible through Power BI mobile/service | Possible through vendor apps | Usually included |
| Customizable fields | Editable report and model | Editable with BI skills | Limited by vendor settings |
| Share with link | Possible through Power BI Service permissions | Possible with cloud setup | Login controlled |
| Year-1 cost at 5 users | $17.99 plus Microsoft licensing you already use | Usually much higher | Often hundreds or thousands |
| Comic startup reporting | Built in across 5 pages | Must be designed | Usually generic |
Who Should Use This Template
This template is useful for digital comic founders, webtoon startup teams, comic platform operators, media investors, entertainment analysts, startup accelerators, and publishing consultants. It works best when your team already has structured data from Excel, CSV, finance exports, portfolio trackers, or approved internal systems and wants a visual reporting layer in Power BI.
It is not a replacement for a CRM, live product analytics system, payment gateway, publishing workflow tool, or investor relations platform. Use it for reporting and analysis after your startup data is ready for Power BI.
Real-World Use Cases
Ana, digital comic founder: Ana uses the Overview Page before investor meetings to explain valuation, revenue, operating cost, net profit, and genre performance.
Rahul, venture analyst: Rahul compares funding raised by year, profit margin by funding stage, and startup status to prepare portfolio review notes.
Maya, publishing consultant: Maya uses Genre Insights and Regional Analysis to show clients which formats, monetization models, countries, and regions are producing stronger returns.
Advantages of Digital Comic Startups Dashboard in Power BI
- Faster setup: Report pages, KPI cards, charts, and slicers are already structured.
- Interactive analysis: Slicers help users answer follow-up questions during review meetings.
- Editable PBIX file: Users can adapt fields, visuals, colors, and measures to match their reporting model.
- Lower recurring cost: A one-time template can replace repeated manual dashboard creation for periodic reporting.
- Power BI ecosystem: Users can publish through Power BI Service if their Microsoft licensing and data policy allow sharing.
Opportunities for Improvement
This dashboard is an analytics template, not a complete operating system. It does not include live API sync, CRM workflows, payment processing, user behavior tracking, or automated investor reports. Teams that need real-time operational workflows should use this Power BI dashboard alongside their existing data systems.
Best Practices
- Standardize genre, region, country, funding stage, format, monetization model, platform type, and status names before loading data.
- Review revenue, operating cost, and net profit together so growth does not hide weak margin.
- Use slicers during review meetings to focus on one region, genre, country, or funding stage at a time.
- Validate KPI totals against your source file after every major refresh.
- Publish only through approved Power BI workspaces if the data includes sensitive financial or investor information.
Explore Relevant Templates
You may also like Digital Comic Startups Dashboard in Excel, Content Personalization Startups Dashboard in Power BI, and Cloud Hosting Services Dashboard in Power BI.
Browse more Power BI templates and Power BI Dashboard templates.
Frequently Asked Questions
What does this Power BI dashboard track?
It tracks valuation, startups, revenue, operating cost, net profit, profit margin, funding raised, funding stage, genre, format, monetization model, country, region, platform type, status, and average rating.
Do I need Power BI Desktop?
Yes. The PBIX file should be opened in Power BI Desktop. Sharing through Power BI Service may require Microsoft licensing depending on your setup.
Can I use my own data?
Yes. Replace the sample data or connect your own structured startup dataset, then refresh the report.
Can I customize the report?
Yes. You can edit visuals, report pages, fields, colors, measures, labels, and data connections in Power BI Desktop.
Is this a live startup analytics connector?
No. It is a reporting and analytics template. It does not include live connectors to comic apps, payment tools, publishing platforms, or CRM systems.
Can I share the dashboard with my team?
Yes. You can share the PBIX internally or publish it through Power BI Service according to your Microsoft licensing and data security policies.
About the Author
Built by PK – Microsoft Certified Professional with 15+ years of Excel, Google Sheets, and Power BI experience. Founder of NextGenTemplates, reaching 300K+ subscribers across YouTube channels. Every template is hand-built and tested before release.
Conclusion
The Digital Comic Startups Dashboard in Power BI gives digital comic and webtoon startup teams a structured way to review performance without starting from a blank PBIX file. Use it to monitor valuation, funding, revenue, operating cost, net profit, genre, region, country, monetization model, platform type, status, and rating in one interactive report.
Download here: Digital Comic Startups Dashboard in Power BI.
For step-by-step Excel, Power BI, dashboard, and reporting tutorials, visit youtube.com/@PKAnExcelExpert.
Last updated: June 2026