The Digital Comic Startups Dashboard in Excel helps founders, analysts, investors, and media teams track digital comic startup performance from one editable Excel workbook. The dashboard includes 5 headline KPI cards, 5 dashboard analysis pages, 18+ chart views, slicers, a structured Data sheet, and a hidden Support sheet that powers the pivot tables.
Digital comics, webtoons, creator-led publishing apps, and mobile-first comic platforms often generate data across revenue, active users, funding, country, genre, monetization model, and platform type. When that data stays scattered in different spreadsheets, it becomes hard to explain growth, margin, or investment momentum. This Excel dashboard gives you a simple reporting layer: update the Data sheet, click Refresh All, and review every page without rebuilding charts manually.
Key Features of Digital Comic Startups Dashboard in Excel
- 5 KPI cards: Total Startups, Total Revenue, Total Active Users, Total Funding Raised, and Avg. Rating.
- 5 dashboard pages: Overview, Funding Trend, Genre Insights, Regional Analysis, and Status Tracking.
- 18+ chart views: Analyze revenue, funding, users, profit, ratings, genre, format, monetization model, country, region, platform type, and status.
- Multiple slicers: Filter the dashboard quickly for investor updates, founder reviews, quarterly analysis, or market comparison.
- Pivot-driven structure: All dashboard pages are built from pivot tables, so a single Refresh All updates the full workbook.
- Fully editable Excel file: Customize categories, fields, chart titles, colors, slicers, and calculations as your comic startup data evolves.
If you are new to pivot-based dashboards, Microsoft has helpful references for creating PivotTables and using slicers to filter data.
Dashboard Pages Explanation
Page 1: Overview
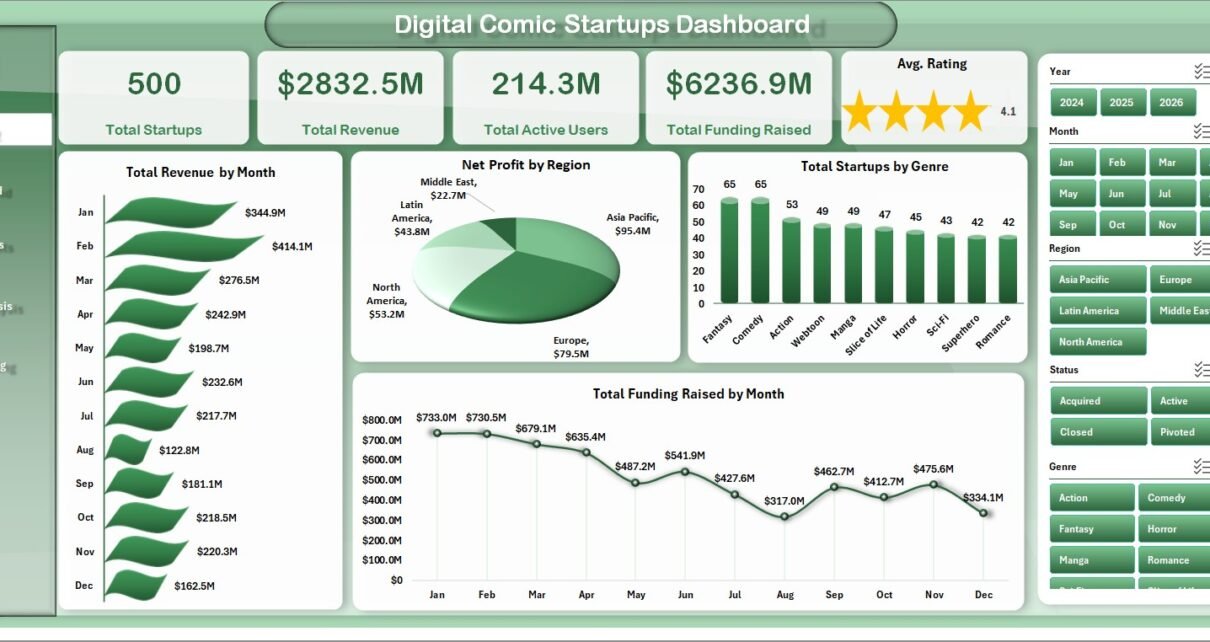
The Overview page is the executive summary of the dashboard. At the top, it displays Total Startups, Total Revenue, Total Active Users, Total Funding Raised, and Avg. Rating as KPI cards so you can read the overall portfolio position quickly.
Total Revenue by Month shows revenue movement over time and helps identify growth periods, seasonality, and weaker months. Net Profit by Region compares profitability across geographic regions, making it easier to see where comic platforms are creating stronger margins. Total Startups by Genre reveals which comic genres have the highest startup activity. Total Funding Raised by Month tracks capital momentum and shows whether funding is concentrated in specific reporting periods.
Digital Comic Startups Dashboard in Excel
Page 2: Funding Trend
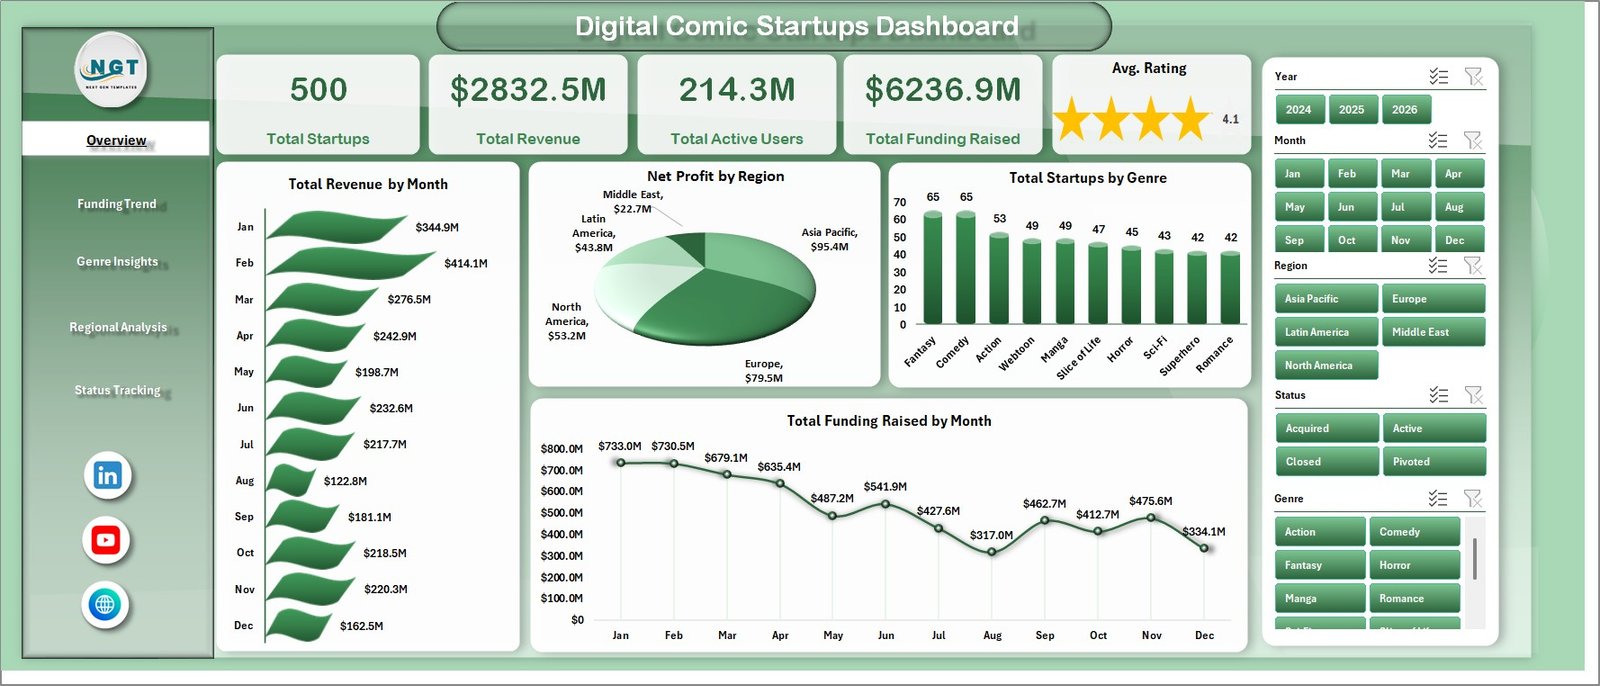
The Funding Trend page focuses on investment and maturity analysis. Profit Margin % by Funding Stage shows which stages are operating efficiently and which may still be in heavy growth mode. Total Funding Raised by Year gives an annual view of capital raised. Avg. Rating by Funding Stage connects product or audience quality signals with the funding lifecycle. Total Revenue by Genre shows which content categories are contributing the most commercial value.
Funding Trend
Page 3: Genre Insights
The Genre Insights page helps you understand audience and monetization performance by content category. Total Active Users by Genre identifies where audience attention is strongest. Total Revenue by Format compares business performance across formats such as mobile comics, webcomics, episodic releases, or graphic novel collections. Profit Margin % by Monetization Model helps compare subscription, advertising, freemium, marketplace, and licensing models. Total Revenue by Country shows geographic contribution at a country level.
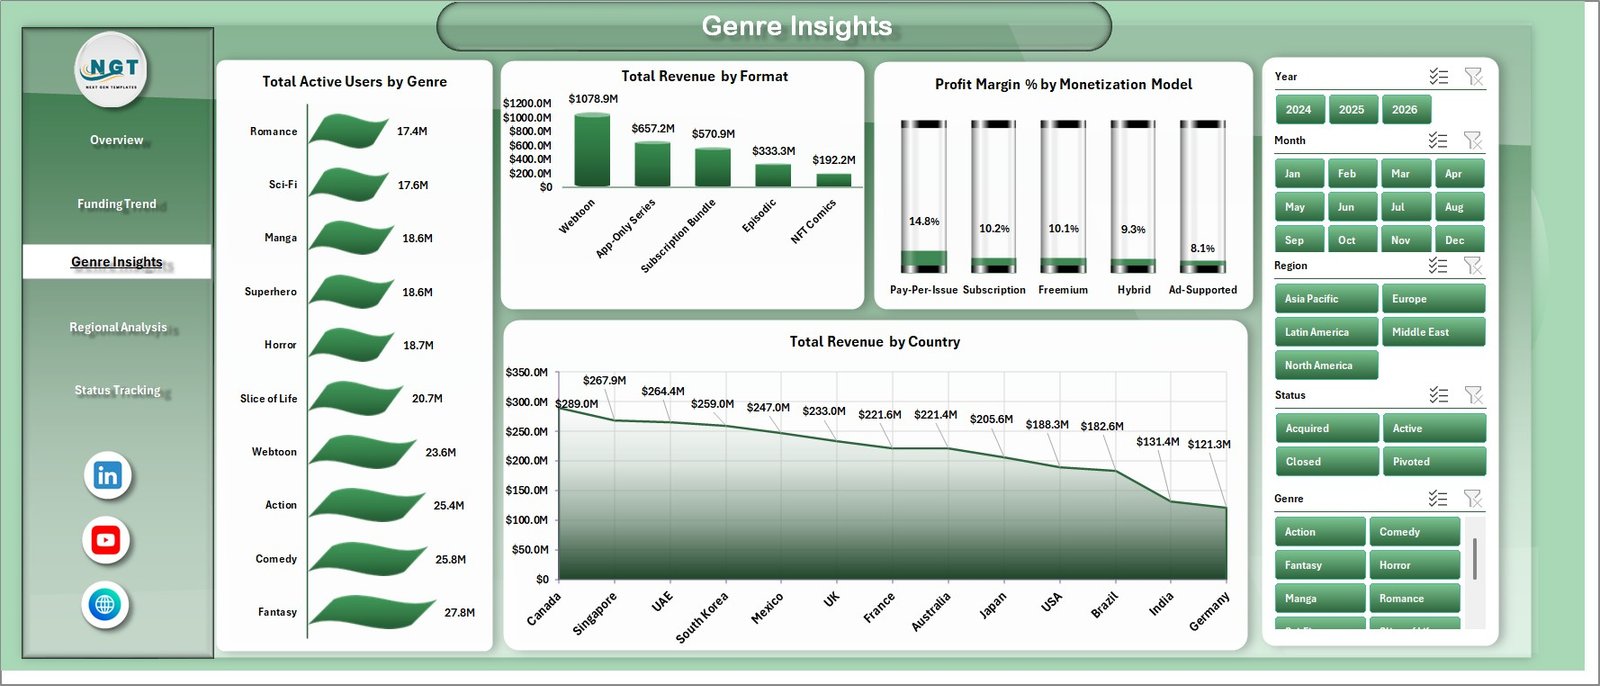
Genre Insights
Page 4: Regional Analysis
The Regional Analysis page compares startup performance by market and operational state. Total Active Users by Region shows the audience base across regions. Total Startups by Status summarizes how many startups are active, scaling, paused, acquired, or closed. Profit Margin % by Region highlights efficient and weaker markets. Net Profit by Country gives a more detailed location-based financial view.
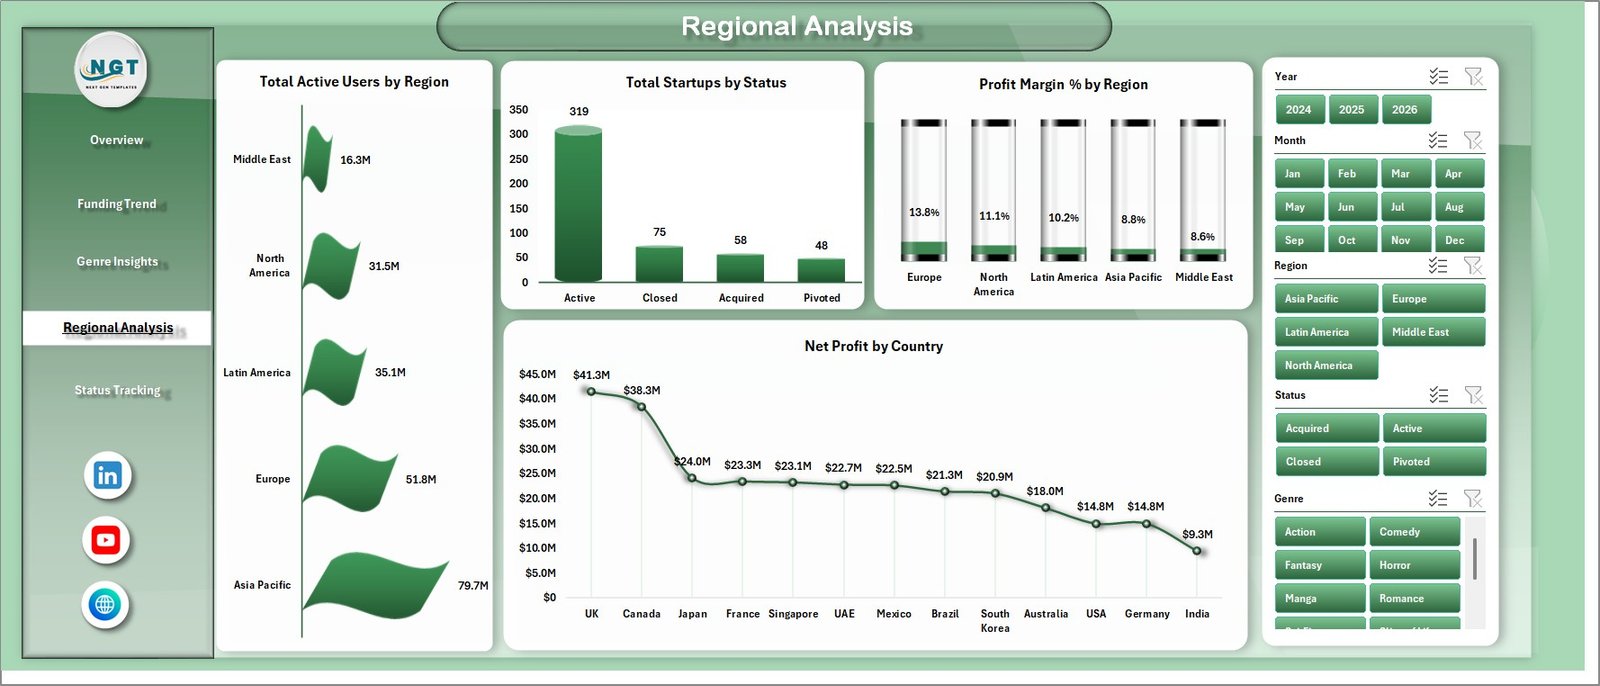
Regional Analysis
Page 5: Status Tracking
The Status Tracking page is useful for portfolio monitoring and founder review meetings. Net Profit by Platform Type compares financial performance across app, web, marketplace, and hybrid platforms. Total Funding Raised by Status shows how investment is distributed across lifecycle states. Avg. Rating by Status helps identify whether stable or scaling startups are also earning stronger user ratings.

Status Tracking
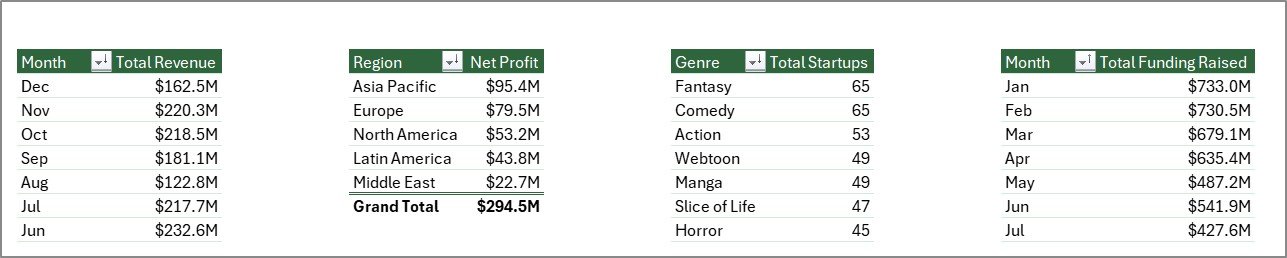
Data Sheet Tab
The Data sheet is the input table for the workbook. Add your startup records in the same column format as the sample data, including fields for month, revenue, profit, funding, users, rating, genre, country, region, format, platform type, funding stage, monetization model, and status. Keeping the same structure allows the pivots, slicers, and charts to refresh correctly.

Data Sheet tab
Support Sheet Tab
The Support sheet contains the pivot tables that create the entire dashboard dynamically. After updating the Data sheet, go to the Data tab in the Excel Ribbon and click Refresh All. All pivots and charts will refresh together. You can keep this sheet hidden when sharing the workbook with stakeholders.
Support sheet tab
Digital Comic Startups Dashboard in Excel vs. Google Sheets vs. Paid CRM/SaaS – Feature Comparison
| Feature | Digital Comic Startups Dashboard in Excel | Google Sheets Alternative | Paid Analytics SaaS |
|---|---|---|---|
| Cost | $17.99 one-time | Template cost or manual build | Monthly or annual subscription |
| Platform | Microsoft Excel | Google Sheets in browser | Vendor cloud system |
| Setup time | Paste data and refresh | Build formulas and charts | Onboarding and configuration |
| Real-time team collaboration | Via OneDrive or SharePoint | Native collaboration | Usually per paid user |
| Mobile access | Excel mobile app | Google Sheets app | Vendor app |
| Customizable fields | Fully editable | Editable | Limited by vendor settings |
| Share with link | Possible through cloud storage | Native | Login controlled |
| Year-1 cost at 5 users | $17.99 total | Template cost plus build time | Often hundreds or thousands |
| Comic startup reporting | Built in | Must be built | Usually generic |
Who Should Use This Template
This template is useful for digital comic founders, webtoon startup teams, creator-economy analysts, media investors, publishing consultants, comic app operators, and product managers who want a clear spreadsheet-based view of revenue, active users, funding, rating, region, genre, format, and monetization model performance.
It is not designed to replace live product analytics, payment processing, CRM, investor relations software, or publishing workflow systems. It works best as a reporting dashboard after your operational data has been exported, cleaned, or pasted into Excel.
Real-World Use Cases
Ana runs a digital comic platform. She uses the Overview page to review monthly revenue, user growth, funding, and ratings before deciding which genre categories deserve more marketing budget.
Rahul is a venture analyst covering media startups. He uses the Funding Trend and Regional Analysis pages to compare funding stage, yearly capital raised, and profit margins across regions before preparing an investment memo.
Maya is a publishing consultant. She updates one workbook per client, then uses Genre Insights to show which formats, countries, and monetization models are producing the strongest revenue and margin.
Advantages of Digital Comic Startups Dashboard in Excel
- Fast setup: You can replace the sample data and refresh the dashboard without building formulas from scratch.
- Low cost: A one-time Excel template can replace hours of manual dashboard building or recurring reporting software costs.
- Full control: The workbook is editable, so your team can change categories, charts, or fields as the business model changes.
- Offline reporting: Sensitive startup or funding data can stay in your Excel file instead of being uploaded to a SaaS platform.
- Investor-friendly views: Funding, revenue, users, margin, country, genre, and status views are useful for review decks and management meetings.
Opportunities for Improvement
The dashboard is built for periodic reporting, not real-time data sync. You will still need to export or prepare your data before adding it to the Data sheet. It does not include automated API connectors to app analytics, payment gateways, CRM tools, or publishing platforms. For very large datasets, a BI tool such as Power BI may perform better than Excel. Teams that need multi-user governance, role permissions, or live alerts should use this as a reporting layer rather than the full operating system.
Best Practices
- Keep the Data sheet column headers and field structure consistent.
- Use standardized names for genre, region, country, format, platform type, monetization model, funding stage, and status.
- Refresh all pivots after every data update using Data > Refresh All.
- Save a backup before changing pivot fields or adding new columns.
- Hide the Support sheet before sharing the workbook with investors or clients.
- Use slicers during review meetings to focus on one country, region, genre, or funding stage at a time.
Explore Relevant Templates
Explore the Excel Dashboard Templates category for more spreadsheet dashboards. Related templates include Content Personalization Startups Dashboard in Excel, Cloud Hosting Services Dashboard in Excel, Concert Promoters Dashboard in Power BI, and Event Success Tracking Dashboard in Google Sheets.
Frequently Asked Questions
What KPIs does the dashboard track?
It tracks Total Startups, Total Revenue, Total Active Users, Total Funding Raised, and Avg. Rating on the Overview page.
How do I update the dashboard?
Replace the sample rows in the Data sheet, keep the same format, and click Data > Refresh All in the Excel Ribbon.
Do I need macros or VBA?
No. The dashboard is built using Excel pivot tables, charts, and slicers. No macro setup is required.
Can I customize genres, countries, and startup status values?
Yes. You can replace sample categories with your own values in the Data sheet, then refresh the pivots and charts.
Can this be used for investor reporting?
Yes. It is useful for investor updates, portfolio reviews, founder dashboards, and market research summaries.
Is it a live analytics connector?
No. It is an Excel dashboard template. Use exported or prepared data, then refresh the workbook.
About the Author
Built by PK – Microsoft Certified Professional with 15+ years of Excel, Google Sheets, and Power BI experience. Founder of NextGenTemplates, reaching 300K+ subscribers across YouTube channels. Every template is hand-built and tested before release.
Conclusion
The Digital Comic Startups Dashboard in Excel is a practical way to turn startup, funding, user, revenue, and genre data into a clean visual report. It is ideal when you want flexible spreadsheet analytics without the cost or complexity of a full SaaS platform.
Click here to purchase the Digital Comic Startups Dashboard in Excel.
Subscribe to our YouTube channel for step-by-step Excel tutorials: Youtube.com/@PK-AnExcelExpert
Last updated: June 2026