Mergers and Acquisitions Legal Teams Dashboard in Excel is a ready-to-use reporting template for legal operations teams, in-house counsel, M&A attorneys, corporate development teams, and due diligence managers. M&A legal work can include hundreds of reviewed documents, multiple regulatory filings, high-value deal stages, outside counsel spend, risk scoring, approval gates, and closing deadlines. This Excel dashboard brings those moving parts into one workbook with 5 dashboard pages, 5 executive KPI cards, 18 chart views, slicers, a Data Sheet, and a Support Sheet.
The template is built for teams that already maintain M&A matter data in Excel exports, trackers, or structured spreadsheets and want a cleaner way to analyze deal value, legal spend, documents reviewed, issues identified, approval rate, risk score, and team performance. It is not a matter management system or virtual data room; it is an editable Excel analytics layer that helps legal leaders see patterns quickly.
Key Features of Mergers and Acquisitions Legal Teams Dashboard in Excel
- 5 dashboard pages: Overview Page, Deal Pipeline, Legal Spend, Risk Review, and Team Performance.
- 5 executive cards: Approval Rate %, Total Regulatory Filings, Total Documents, Total Issues Identified, and Avg. Risk Score.
- 18 chart views: Analyze deal value, legal spend, budget, filings, documents, issues, approval rate, risk score, close days, counsel performance, and client satisfaction.
- Interactive slicers: Filter the dashboard quickly during reviews without rebuilding formulas.
- Excel refresh workflow: Replace data in the Data Sheet, click Refresh All, and update all connected pivots and charts.
- Editable workbook: Customize fields, labels, colors, charts, pivot tables, and pages based on your reporting needs.
Dashboard Pages Explanation
1 – Overview Page
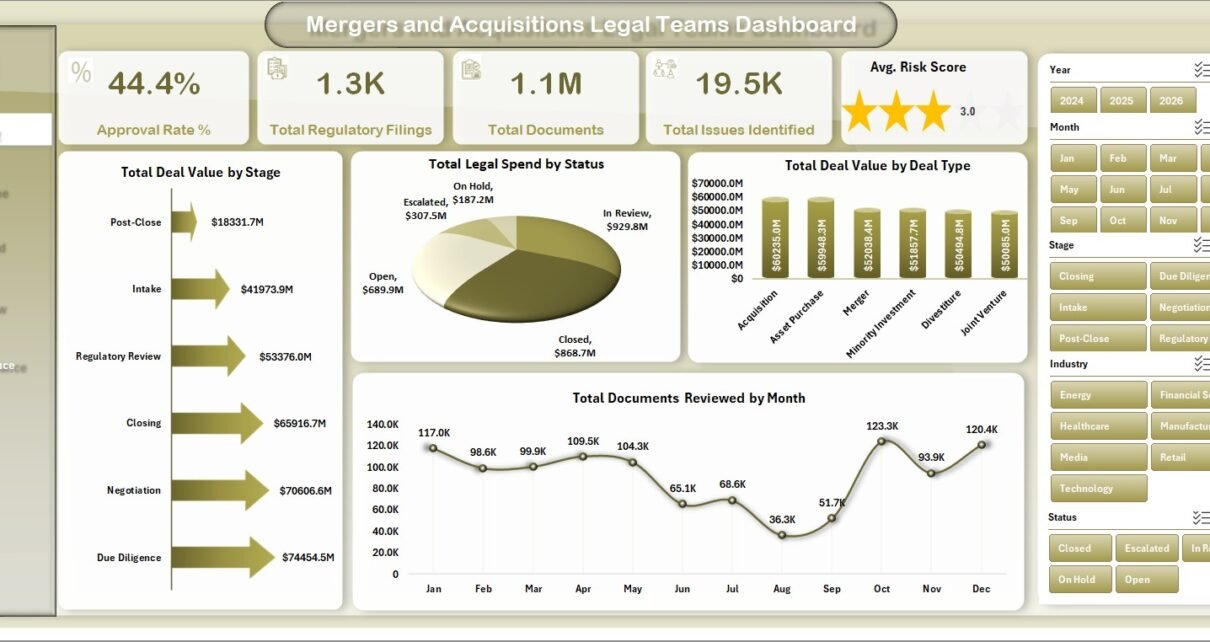
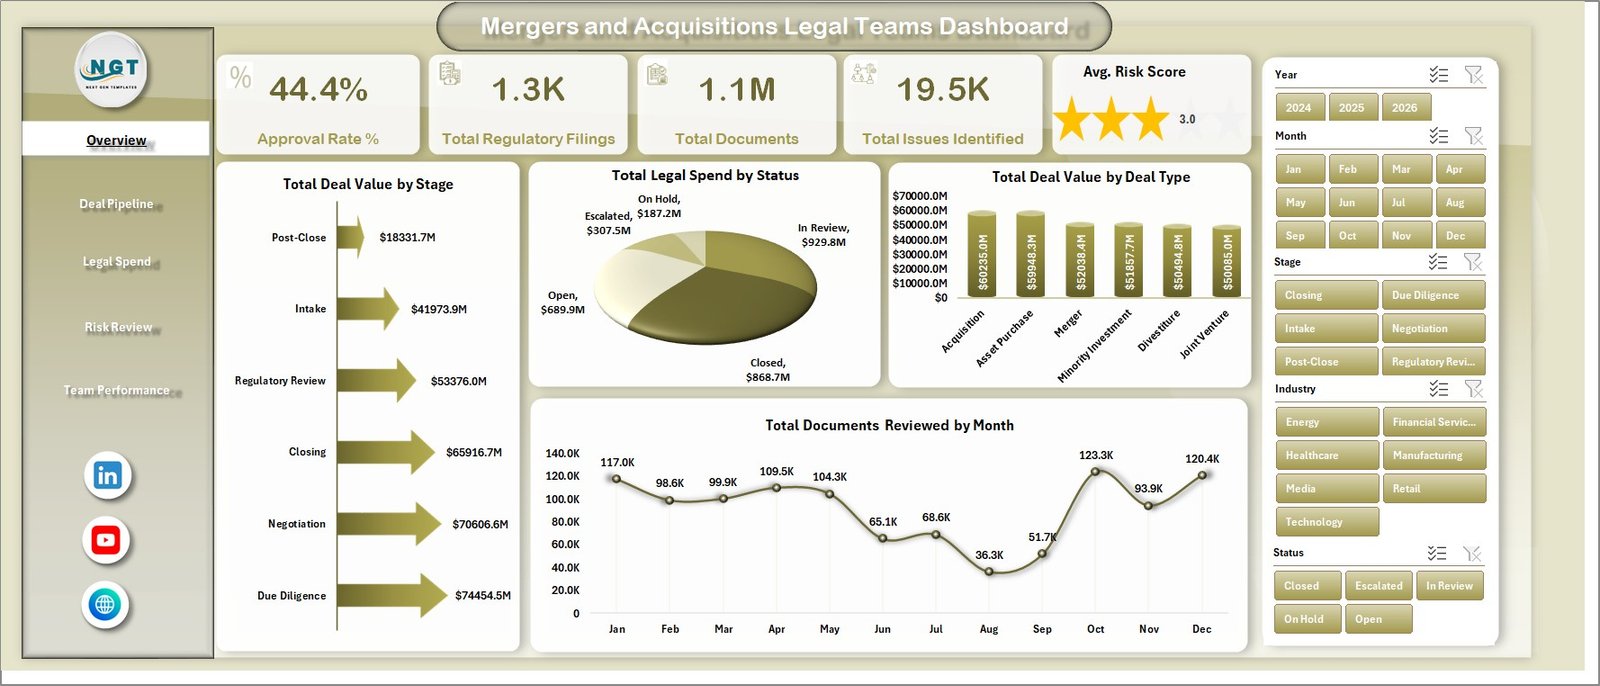
The Overview Page gives legal leaders a high-level snapshot of M&A legal activity. The top cards show Approval Rate %, Total Regulatory Filings, Total Documents, Total Issues Identified, and Avg. Risk Score. These cards help teams check whether approval performance, compliance workload, documentation volume, issue discovery, and risk exposure are moving in the right direction.
Total Deal Value by Stage: This chart shows where deal value sits across the pipeline. It helps leaders identify whether major exposure is concentrated in diligence, negotiation, approval, or closing.
Total Legal Spend by Status: This visual compares legal spend by matter status. It helps teams understand how much cost is tied to active, pending, delayed, or completed matters.
Total Deal Value by Deal Type: This chart compares transaction value across deal types such as mergers, acquisitions, divestitures, or joint ventures. It helps counsel see which transaction structures carry the largest financial weight.
Total Documents Reviewed by Month: This monthly view shows document review workload over time. It helps managers plan reviewer capacity during peak diligence periods.
2 – Deal Pipeline
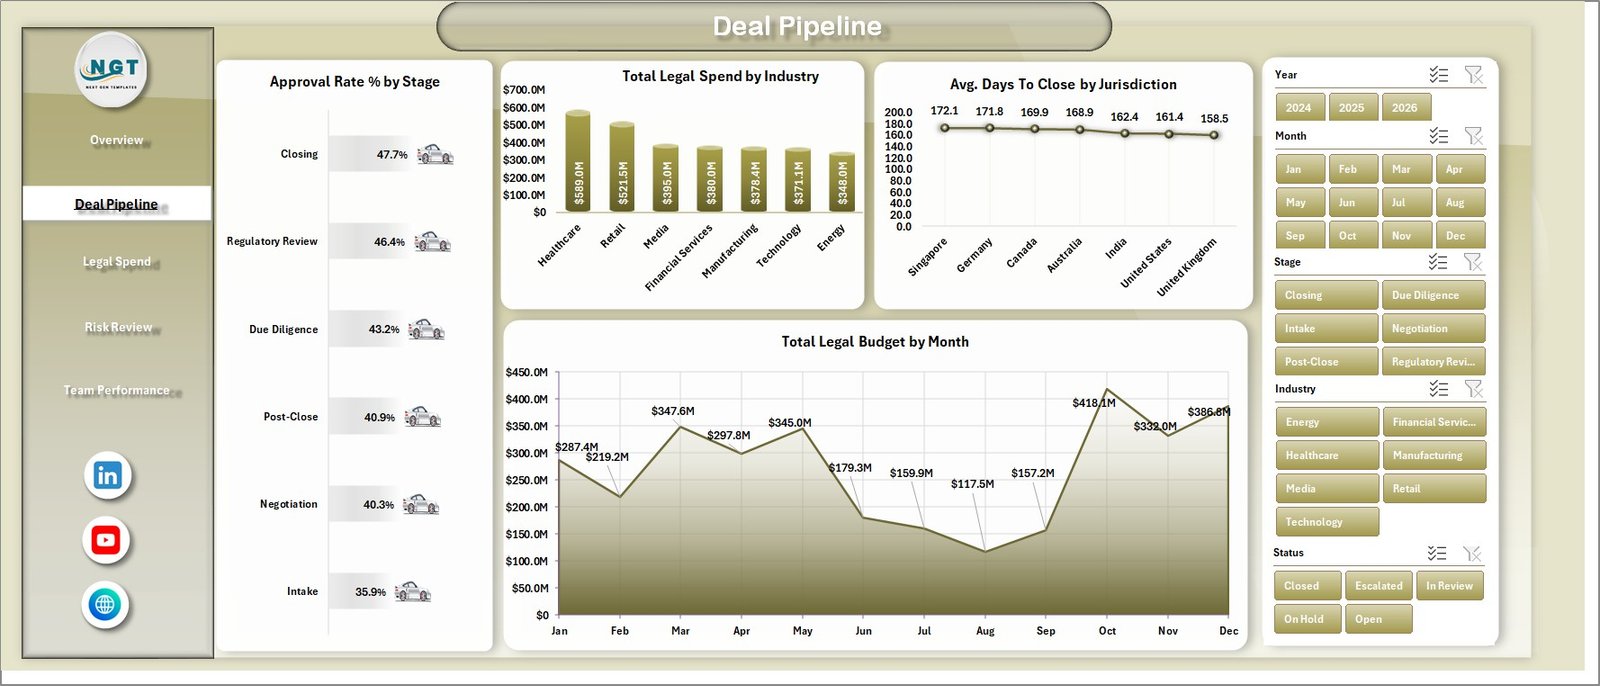
The Deal Pipeline sheet helps legal teams review the transaction pipeline by stage, industry, jurisdiction, and month. It is useful for pipeline review meetings, deal committee updates, and monthly legal operations reporting.
Approval Rate % by Stage: This chart compares approval performance across deal stages. It helps identify where reviews are moving smoothly and where bottlenecks may need escalation.
Total Legal Spend by Industry: This chart shows which industries create the highest legal spend. It helps explain sector-level complexity and supports budget planning.
Avg. Days To Close by Jurisdiction: This chart compares closing time by jurisdiction. It helps legal teams identify regions where regulatory, review, or negotiation cycles take longer.
Total Legal Budget by Month: This monthly budget view helps teams track planned legal budget over time. It supports accruals, forecasting, and leadership reporting.
3 – Legal Spend
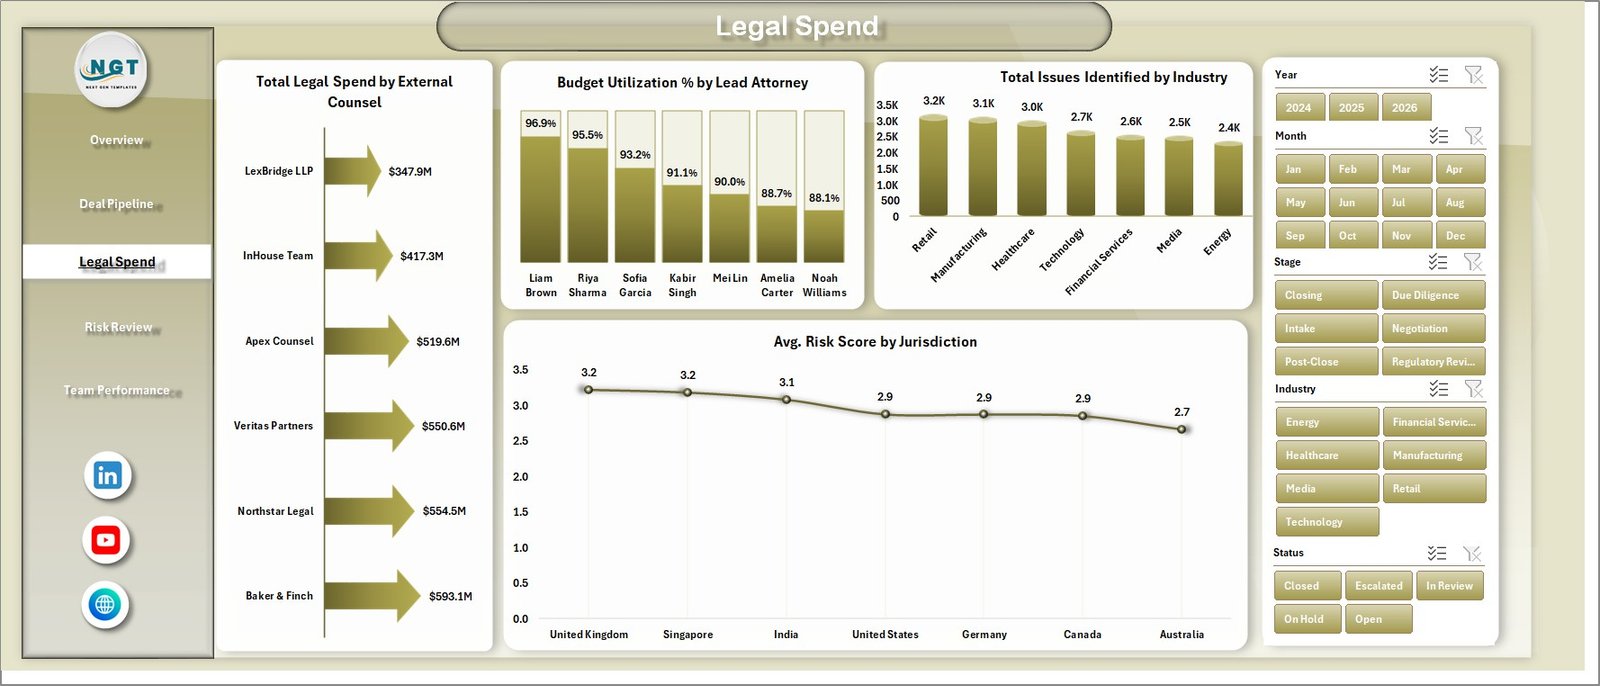
The Legal Spend page is designed for legal operations, finance partners, and matter owners who need to understand external counsel spend, attorney budget use, issue volume, and jurisdiction-level risk.
Total Legal Spend by External Counsel: This chart compares cost by outside counsel. It helps legal teams review vendor concentration, fee allocation, and counsel performance discussions.
Budget Utilization % by Lead Attorney: This visual shows how much of the assigned budget each lead attorney has used. It helps identify budget pressure before it becomes a year-end surprise.
Total Issues Identified by Industry: This chart shows which industries produce the most due diligence issues. It helps teams prepare better checklists and risk reviews for similar deals.
Avg. Risk Score by Jurisdiction: This visual compares average risk score across jurisdictions. It helps counsel focus attention on regions with higher legal or regulatory exposure.
4 – Risk Review
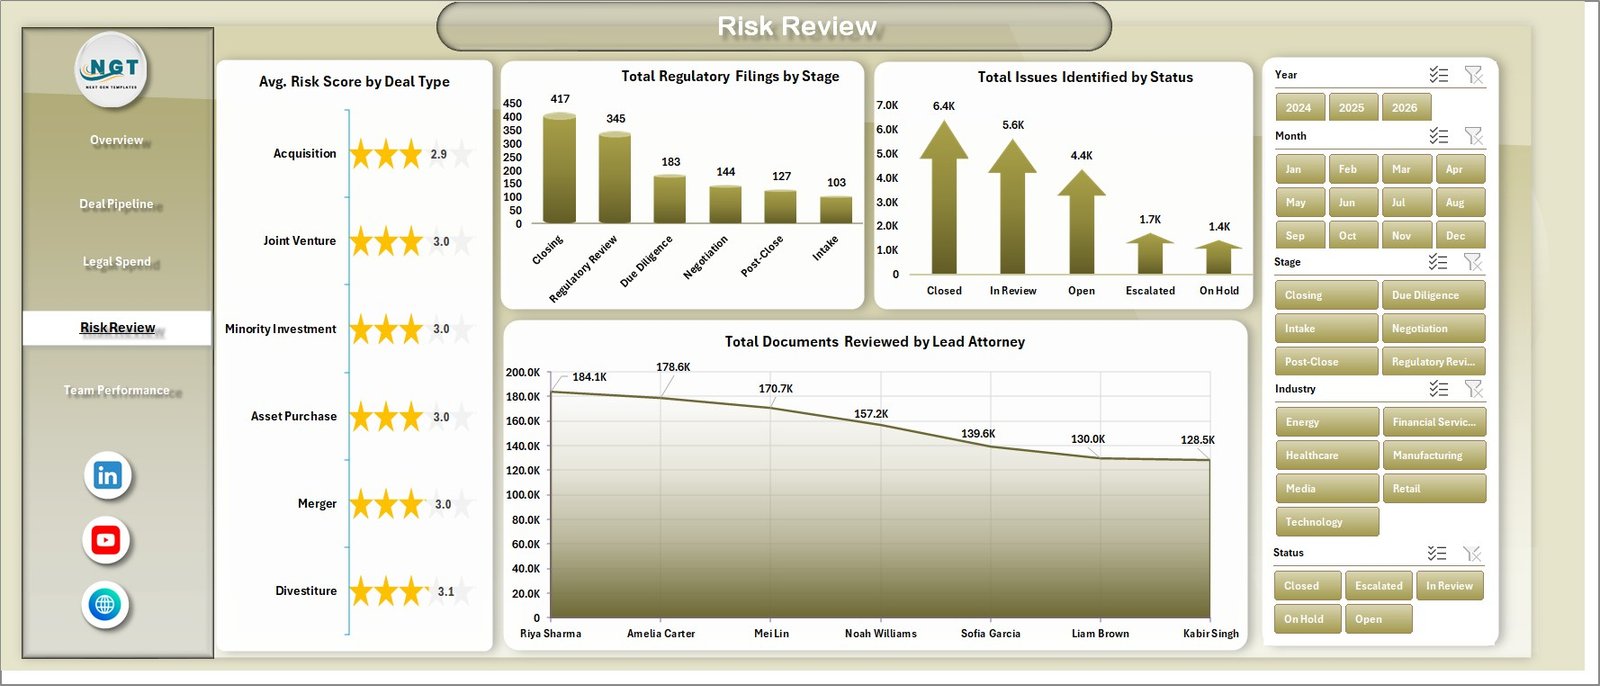
The Risk Review page connects deal type, regulatory filings, issue status, and lead attorney document workload. It is useful for due diligence leads and counsel who need to explain where legal risk is building.
Avg. Risk Score by Deal Type: This chart shows which deal types have higher average risk scores. It helps leaders understand whether specific transaction structures need more review time.
Total Regulatory Filings by Stage: This chart tracks regulatory filing volume across deal stages. It helps ensure compliance work is aligned with the deal pipeline.
Total Issues Identified by Status: This visual groups issues by status, such as open, resolved, escalated, or pending. It helps teams focus on unresolved diligence items.
Total Documents Reviewed by Lead Attorney: This chart compares document review volume by attorney. It helps managers understand workload balance and review ownership.
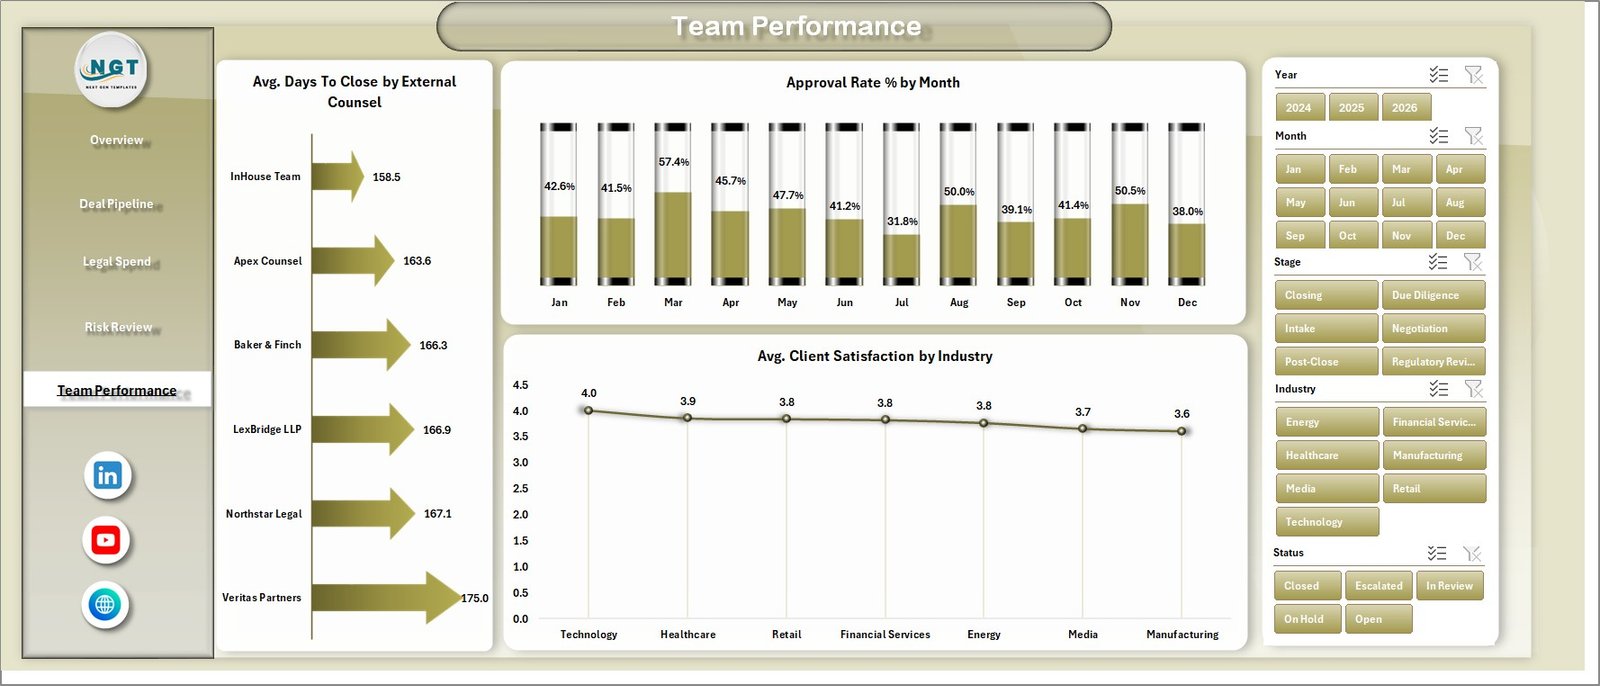
5 – Team Performance
The Team Performance sheet helps managers review counsel speed, monthly approval patterns, and satisfaction by industry. It is useful for vendor reviews, internal team check-ins, and post-deal performance analysis.
Avg. Days To Close by External Counsel: This chart compares close time by outside counsel. It helps teams evaluate responsiveness, matter throughput, and where timelines may need clearer ownership.
Approval Rate % by Month: This chart tracks approval performance over time. It helps legal teams see whether process improvements are creating smoother approvals.
Avg. Client Satisfaction by Industry: This chart compares satisfaction across industries. It helps connect service quality with deal complexity and sector expectations.
6 – Data Sheet Tab
The Data Sheet is where you add your own M&A legal records in the same format as the sample data. Keep the same column headers and structure so the connected pivots, charts, cards, and slicers continue working correctly.

7 – Support Sheet
The Support Sheet contains the pivot tables used to create the dashboard dynamically. After updating the Data Sheet, go to the Excel Data ribbon and click Refresh All. All pivots and charts refresh together. You can keep this sheet hidden when sharing the dashboard with everyday users.

Mergers and Acquisitions Legal Teams Dashboard in Excel vs. Google Sheets vs. Paid Legal SaaS – Feature Comparison
| Feature | This Excel dashboard | Google Sheets alternative | Paid legal SaaS |
|---|---|---|---|
| Cost | One-time template purchase | Low software cost plus build time | Recurring subscription |
| Platform | Microsoft Excel | Browser-based spreadsheet | Vendor cloud platform |
| Setup time | Replace data and refresh pivots | Import data and test formulas | Implementation and onboarding |
| Real-time team collaboration | Available through OneDrive or SharePoint | Native collaboration | Usually included by plan |
| Mobile access | Excel mobile or web for light review | Google Sheets mobile app | Vendor app or browser |
| Customizable fields | Editable sheets, pivots, charts, labels, and slicers | Editable with formula control | Depends on vendor permissions |
| Share with link | Possible through Microsoft 365 sharing | Native link sharing | Role-based sharing |
| Year-1 cost at 5 users | Template price plus Microsoft licensing if needed | Workspace cost plus setup time | Often hundreds or thousands |
| M&A legal analysis | Deal value, spend, budget, filings, documents, issues, risk, approvals, and performance | Must be built or adapted | Depends on module and report access |
For teams that need full legal workflow automation, a dedicated matter management platform may be the better long-term option. For teams that need quick reporting from structured deal data, this Excel dashboard is faster to deploy and easier to customize.
Who Should Use This Template
This template is useful for in-house legal teams, M&A counsel, legal operations managers, corporate development analysts, due diligence leaders, external counsel managers, private equity operations teams, and consultants who prepare recurring deal review reports.
It is especially helpful when your team already tracks deal records, budgets, documents, issues, and approvals in spreadsheets or exported data files. If your data is unstructured across email threads, scanned PDFs, or unorganized document folders, you will need to structure it first before the dashboard can produce reliable charts.
Real-World Use Cases
Anika, legal operations manager: uses the Legal Spend page to compare outside counsel spend and budget utilization before a monthly finance review.
Marcus, corporate development counsel: uses the Deal Pipeline page to explain which deal stages contain the highest deal value and where approval rates are lower.
Priya, due diligence lead: uses the Risk Review page to monitor documents reviewed, issue status, risk score, and regulatory filings before an investment committee meeting.
Advantages of Mergers and Acquisitions Legal Teams Dashboard in Excel
- Fast setup: Replace the sample rows, refresh the workbook, and start reviewing the dashboard.
- No recurring subscription: It is a downloadable Excel template, not a monthly SaaS product.
- Editable structure: Excel users can adjust labels, charts, pivots, slicers, and workbook formatting.
- Focused M&A legal metrics: The workbook is built around deal value, spend, filings, documents, issues, risk, approvals, and performance.
- Useful for leadership reporting: The Overview Page and analysis tabs are designed for quick interpretation during meetings.
Opportunities for Improvement
This workbook depends on clean and consistent input data. If attorneys and analysts use different naming conventions for stages, industries, jurisdictions, or statuses, the dashboard may split similar records into separate categories. Standard dropdowns and a controlled data-entry process will improve reporting quality.
The dashboard is also not a live workflow system. It does not automatically collect documents, approve matters, send reminders, or replace your legal operations platform. It works best as a reporting layer after your source data is ready.
Best Practices
- Keep the Data Sheet column headers unchanged unless you also update the supporting pivots.
- Use consistent names for deal stage, status, industry, jurisdiction, lead attorney, and external counsel.
- Refresh the workbook after every major data update.
- Review high-risk deals and unresolved issues before leadership meetings.
- Hide the Support Sheet before sharing the workbook with non-technical users.
- Use Microsoft guidance for safe workbook collaboration when sharing files through OneDrive or SharePoint. See Microsoft’s Excel co-authoring help.
Explore Relevant Templates
You can download the product draft here: Mergers and Acquisitions Legal Teams Dashboard in Excel.
Related templates include Mergers and Acquisitions Legal Teams Dashboard in Power BI, Legal Research Dashboard in Excel, and Compliance Audits Dashboard in Excel.
Frequently Asked Questions
What is included in the Mergers and Acquisitions Legal Teams Dashboard in Excel?
The workbook includes 5 dashboard pages, KPI cards, chart views, slicers, a Data Sheet, and a Support Sheet with pivot tables.
Can I use my own legal team data?
Yes. Replace the sample records in the Data Sheet with your own structured M&A legal data and click Refresh All.
Does the dashboard require macros?
No. The workbook is based on Excel tables, pivot tables, charts, and slicers.
Can I customize the dashboard pages?
Yes. You can edit page names, colors, chart labels, pivot fields, slicers, and source columns if you are comfortable with Excel.
Is this a replacement for a legal matter management system?
No. It is an Excel reporting dashboard, not a legal workflow, document management, or matter management platform.
Which version of Excel should I use?
Use a modern desktop version of Microsoft Excel for best pivot refresh and slicer performance.
About the Author
Built by PK – Microsoft Certified Professional with 15+ years of Excel, Google Sheets, and Power BI experience. Founder of NextGenTemplates, reaching 300K+ subscribers across YouTube channels. Every template is hand-built and tested before release.
Conclusion
Mergers and acquisitions legal work moves quickly, and leadership needs more than scattered trackers to understand spend, approval progress, risk, filing volume, and document review workload. The Mergers and Acquisitions Legal Teams Dashboard in Excel gives legal teams a practical way to turn structured deal data into clear reporting pages. Update the Data Sheet, refresh the workbook, and use the dashboard to review deal value, legal spend, risk, issues, filings, documents, and team performance with less manual reporting effort.
For more Excel tutorials and dashboard examples, visit PK An Excel Expert on YouTube.