OKR Management Dashboard in Excel is a ready-to-use reporting workbook for teams that manage objectives, key results, initiatives, budgets, risks, owners, and quarterly progress in Microsoft Excel. Instead of reviewing separate OKR trackers, budget logs, owner updates, and leadership slides, this template brings the main performance views into one structured dashboard.
The workbook includes 7 sheet tabs, 5 executive KPI cards, and 16 chart views across Overview, Progress, Teams, Risk, and Financials pages. It is built for practical OKR reviews: update the Data Sheet, refresh all pivots from the Excel Data tab, and use slicers to filter the dashboard quickly during leadership meetings.
Click here to purchase OKR Management Dashboard in Excel
OKR Management Dashboard in Excel
Key Features of OKR Management Dashboard in Excel
- 5 high-level KPI cards: Total OKRs, Total Budget, Budget Variance, Total Completed, and Avg. Alignment Score.
- 5 dashboard pages: Overview, Progress, Teams, Risk, and Financials give different angles on OKR execution.
- 16 analytical chart views: Track achieved value, target value, status, completion, budget, spend, risk, confidence, owners, teams, and departments.
- Interactive slicers: Filter the dashboard during reviews without editing formulas or manually sorting the data.
- Data Sheet tab: Replace the sample records with your own OKR data in the same format.
- Support Sheet tab: Pivot tables power the dashboard dynamically and can be kept hidden.
- No macros required: The workbook uses standard Excel dashboard features such as pivots, charts, and slicers.
Dashboard Pages Explanation
1. Overview Page
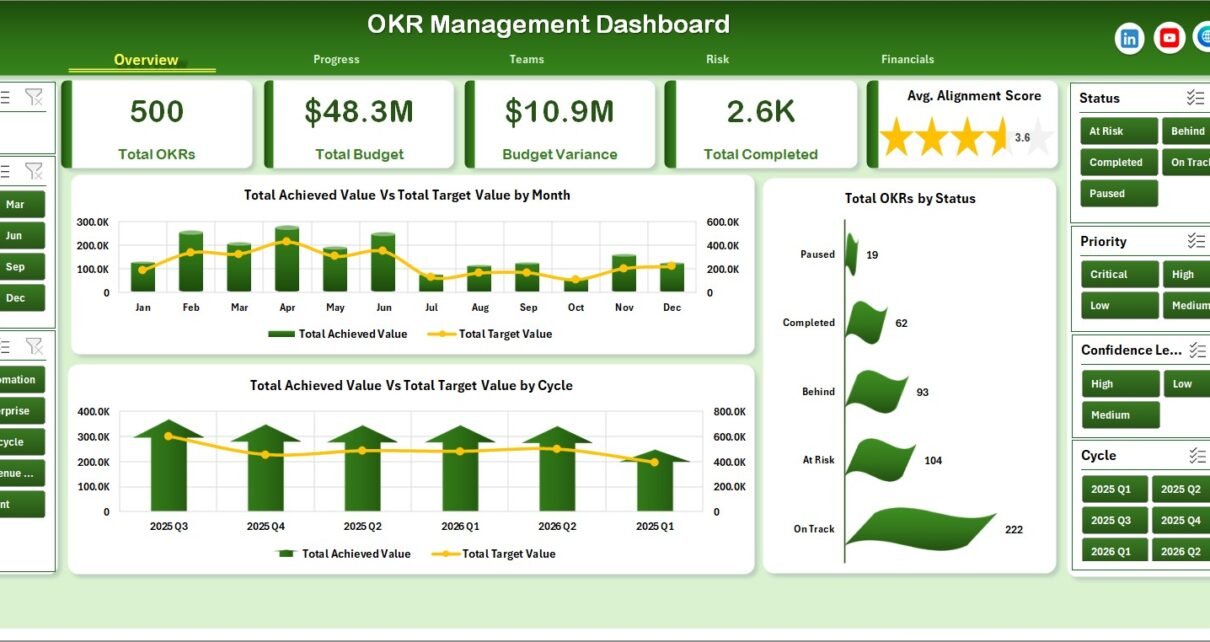
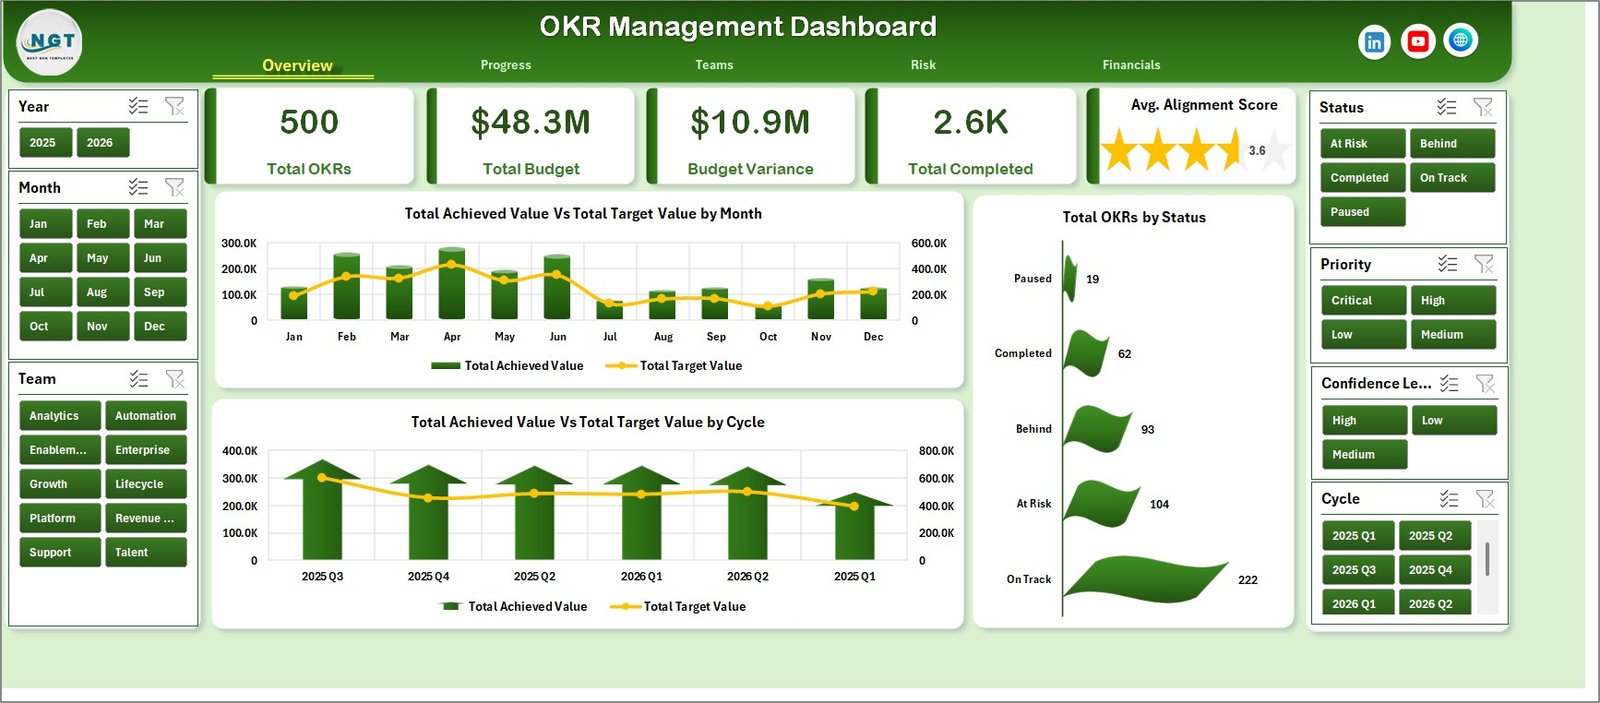
The Overview page is the executive summary for the OKR program. The top cards show Total OKRs, Total Budget, Budget Variance, Total Completed, and Avg. Alignment Score so leaders can understand the current portfolio position quickly.
Total Achieved Value and Total Target Value by Month: This chart compares monthly target value against achieved value. It helps teams see whether execution is keeping pace with the plan over time.
Total Achieved Value and Total Target Value by Cycle: This chart compares performance across OKR cycles. It is useful for quarterly or half-year reviews where leadership wants to compare progress between planning periods.
Total OKRs by Status: This chart shows how OKRs are distributed by status. It helps identify how many objectives are completed, active, delayed, at risk, or still pending.
Overview Page
2. Progress
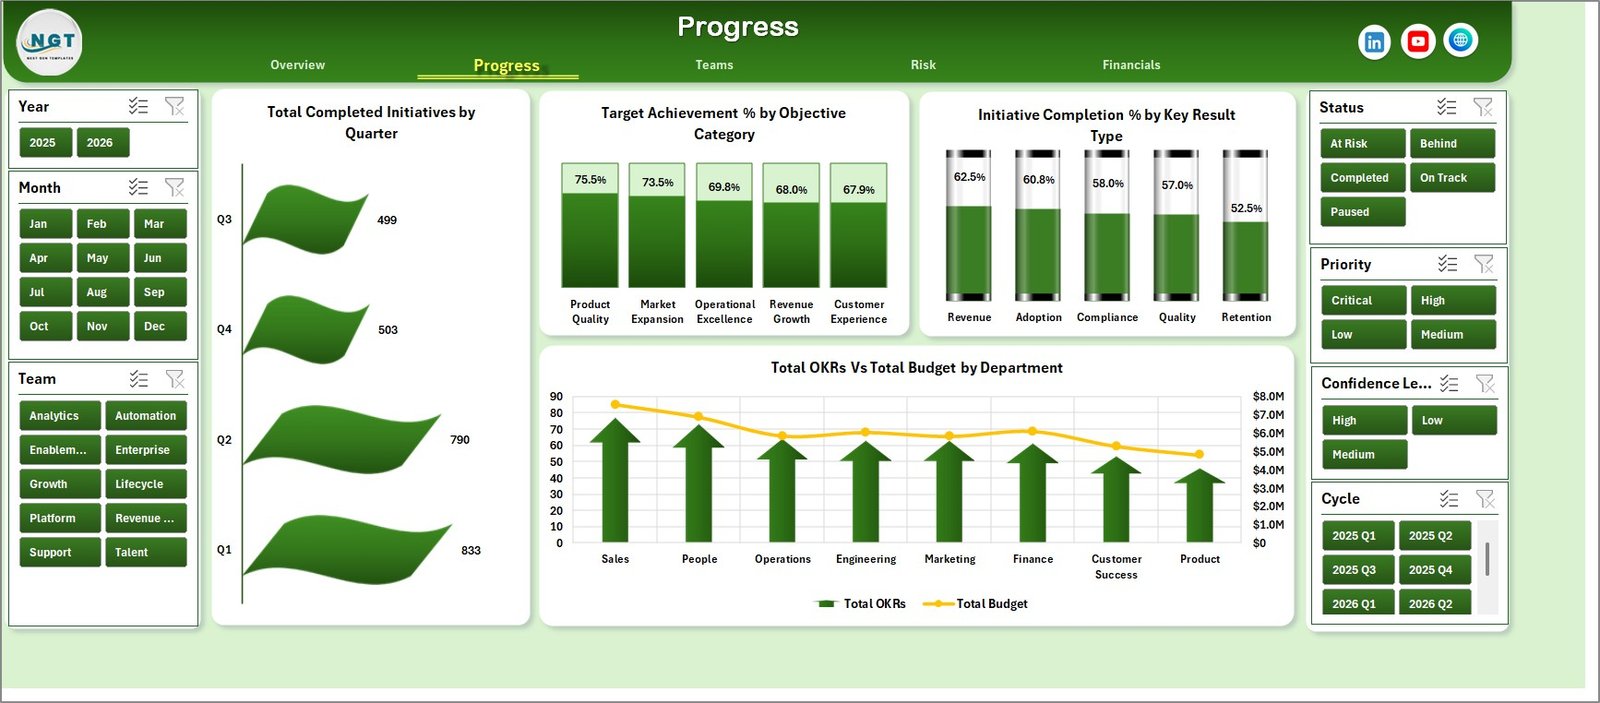
The Progress sheet focuses on initiative completion, target achievement, objective categories, key result types, departments, and budget distribution.
Total Completed Initiatives by Quarter: This chart shows completed initiative volume across quarters. It helps teams understand whether execution momentum is improving or slowing down.
Target Achievement % by Objective Category: This chart compares achievement percentage across objective categories. It helps leadership see which strategic themes are performing strongest.
Initiative Completion % by Key Result Type: This chart compares completion percentage by key result type. It helps teams understand which kinds of key results are easier or harder to complete.
Total OKRs and Total Budget by Department: This chart compares OKR volume and budget allocation by department. It helps management review whether resourcing aligns with strategic workload.
Progress
3. Teams
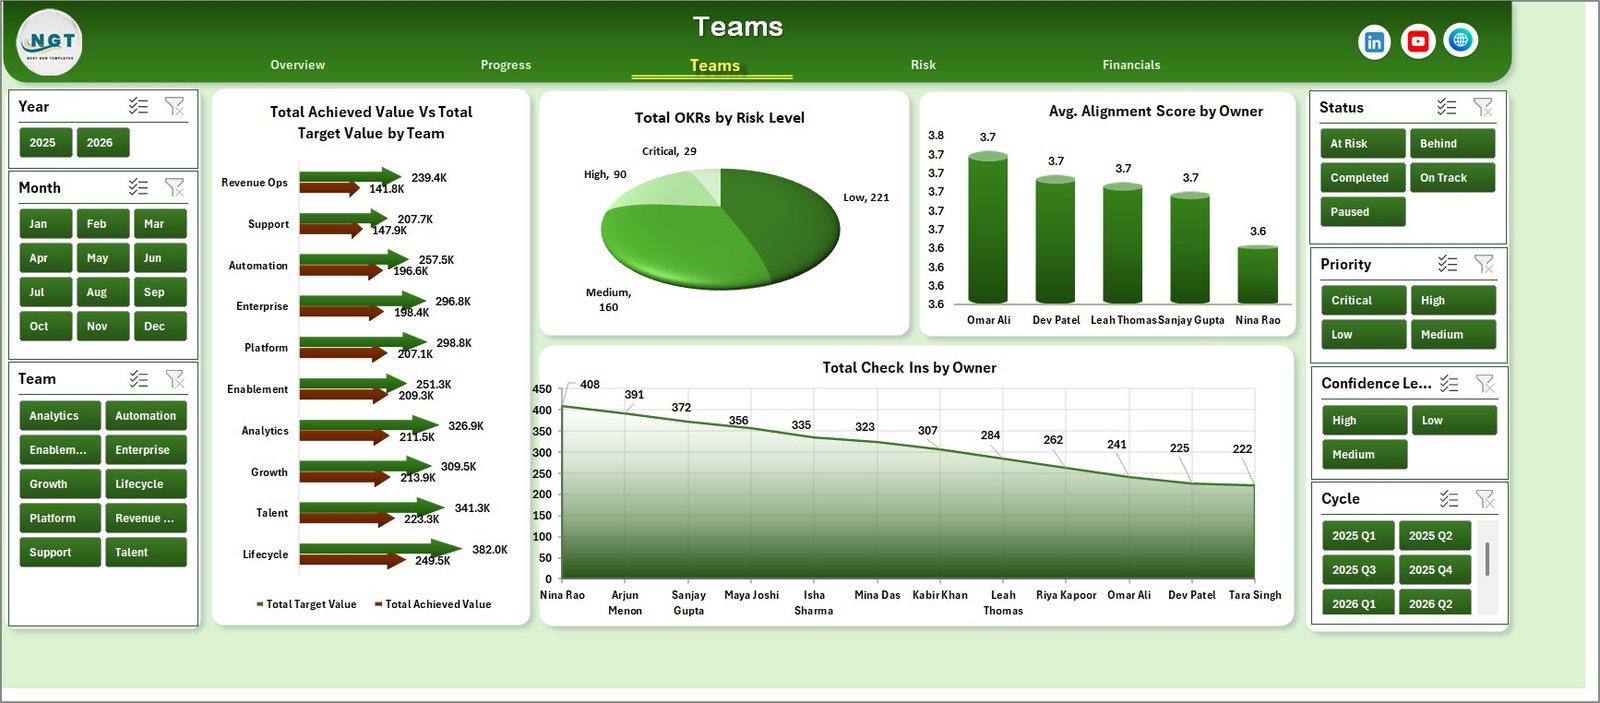
The Teams page helps compare OKR execution by team, owner, risk level, alignment score, and check-in activity.
Total Achieved Value and Total Target Value by Team: This chart compares each team’s achieved value against its target value. It helps leaders identify high-performing teams and teams that may need support.
Total OKRs by Risk Level: This chart groups OKRs by risk level. It helps management understand whether the portfolio is concentrated in low, medium, or high-risk work.
Avg. Alignment Score by Owner: This chart shows how aligned each owner’s OKRs are with broader strategy. It helps managers coach owners whose objectives may need clearer strategic connection.
Total Check Ins by Owner: This chart compares check-in activity by owner. It helps teams identify whether owners are keeping their OKR updates current.
Teams
4. Risk
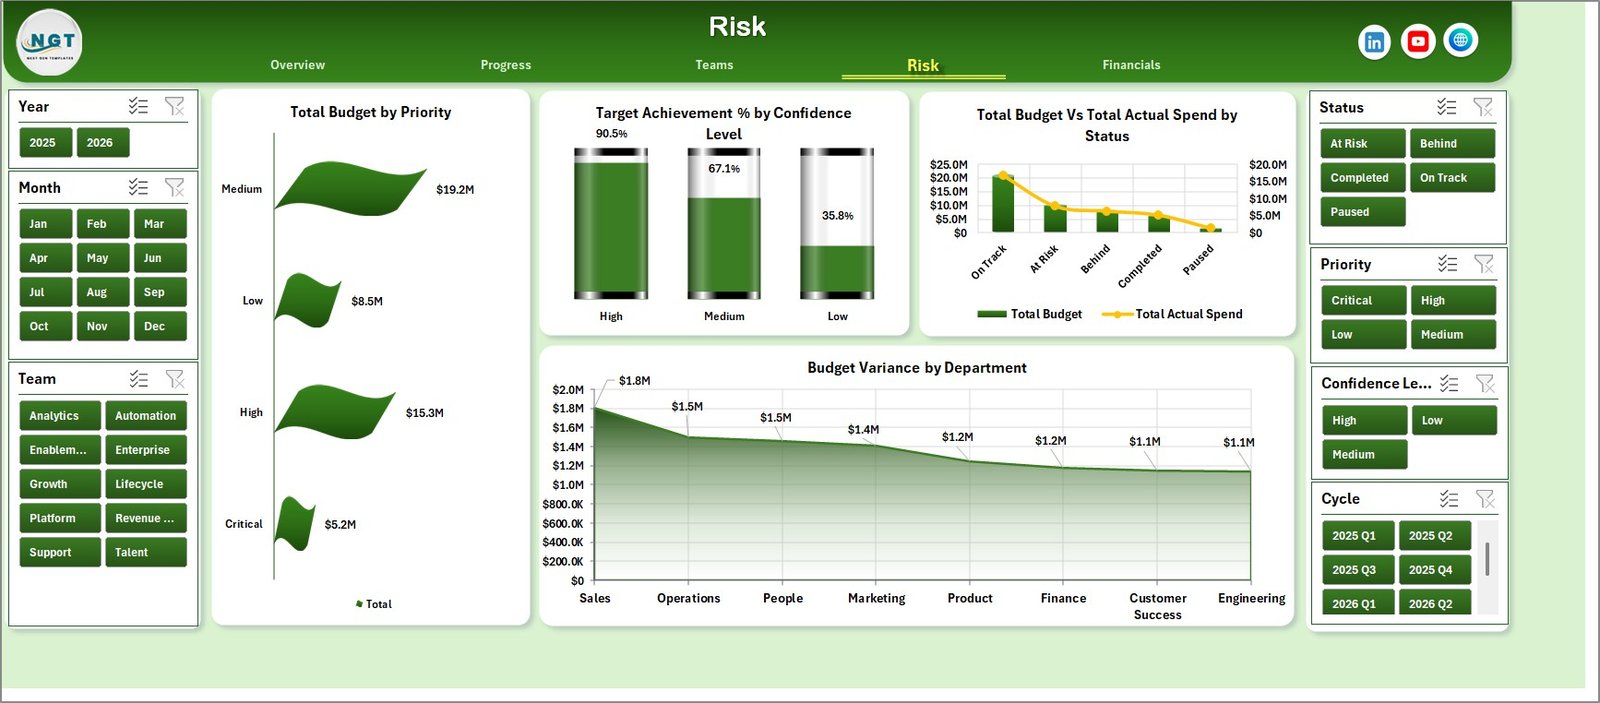
The Risk page combines priority, confidence, budget, actual spend, status, and department variance to support risk-based OKR review.
Total Budget by Priority: This chart shows budget allocation by priority level. It helps confirm whether high-priority work is receiving the appropriate financial focus.
Target Achievement % by Confidence Level: This chart compares target achievement by confidence level. It helps validate whether confidence ratings are realistic when compared with actual progress.
Total Budget and Total Actual Spend by Status: This chart compares planned budget with actual spend across OKR statuses. It helps teams see whether delayed or at-risk items are consuming too much budget.
Budget Variance by Department: This chart highlights where department spending is above or below plan. It is useful for budget review meetings and corrective action discussions.
Risk
5. Financials
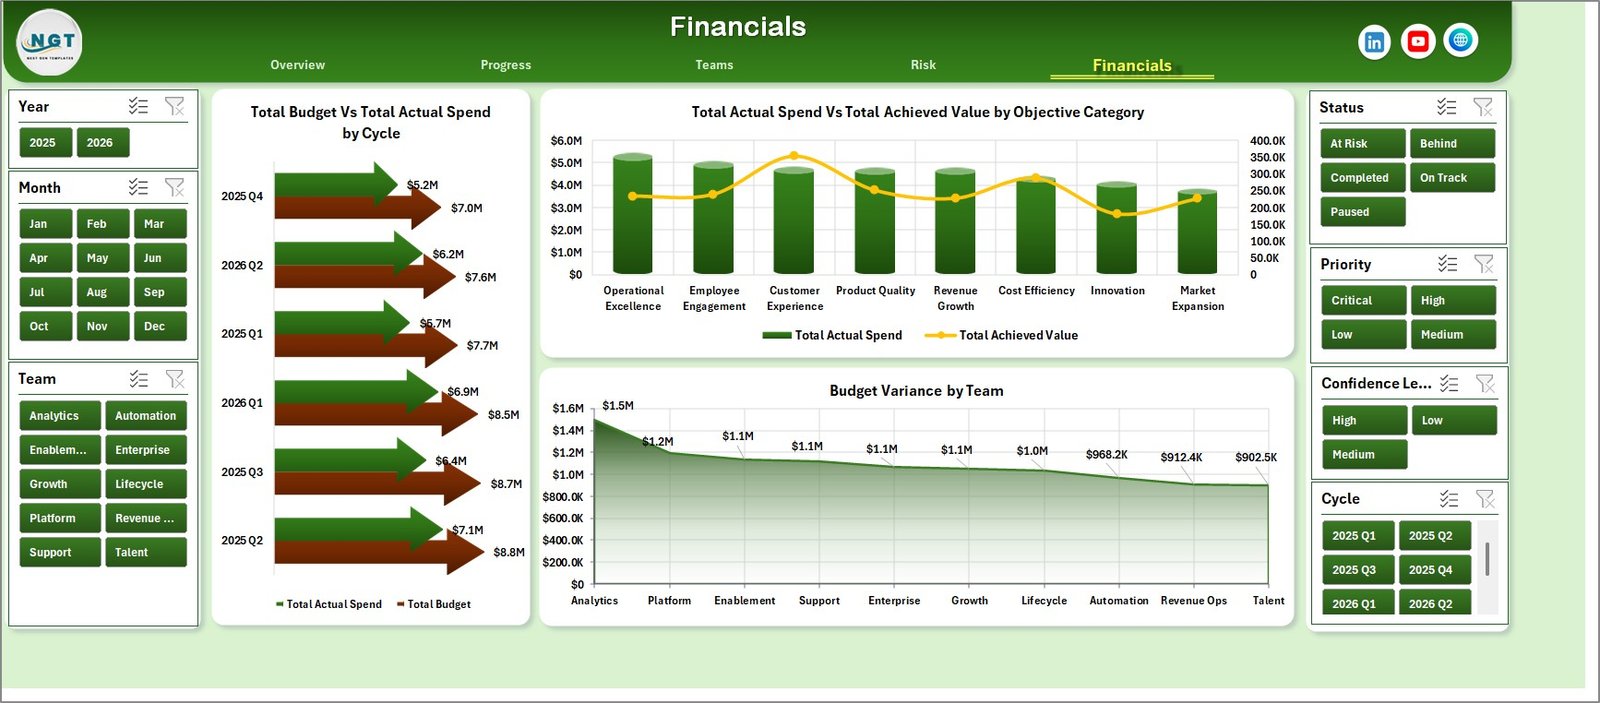
The Financials page gives a budget and spend view of the OKR portfolio across cycles, objective categories, and teams.
Total Budget and Total Actual Spend by Cycle: This chart compares planned budget and actual spend by cycle. It helps leaders monitor whether each OKR cycle is staying within planned investment.
Total Actual Spend and Total Achieved Value by Objective Category: This chart compares investment with results by objective category. It helps teams discuss whether spending is translating into measurable achievement.
Budget Variance by Team: This chart shows budget variance at the team level. It helps finance and operations teams identify where spending discipline or resource planning needs attention.
Financials
6. Data Sheet Tab
The Data Sheet tab is where you add or replace the OKR records. Keep the same column structure so the pivot tables, slicers, and charts can read the data correctly after refresh.

Data Sheet tab
7. Support Sheet
The Support Sheet contains the pivot tables used to create the entire dashboard dynamically. After updating the Data Sheet, go to the Excel Data tab and click Refresh All. All pivots and dashboard charts will refresh. You can keep this sheet hidden during normal use.

Support sheet tab
OKR Management Dashboard in Excel vs. Google Sheets vs. Paid CRM/SaaS – Feature Comparison
| Feature | OKR Management Dashboard in Excel | Google Sheets alternative | Paid OKR SaaS |
|---|---|---|---|
| Cost | $17.99 one-time | Free to build, but requires setup time | Monthly or annual subscription |
| Platform | Microsoft Excel | Browser-based spreadsheet | Cloud SaaS |
| Setup time | Replace data and refresh | Manual dashboard build | Vendor onboarding and configuration |
| Offline access | Yes | Limited | No |
| Custom fields | Fully editable workbook | Editable, but formulas must be built | Plan-dependent |
| Share with link | Via OneDrive or SharePoint | Built in | Built in |
| Year-1 cost at 5 users | $17.99 total | Build hours plus workspace cost | Often hundreds or thousands per year |
| Pivot refresh | Built in | Requires setup | Vendor controlled |
Who Should Use This Template
This template is useful for founders, strategy leaders, PMO teams, department heads, operations managers, consultants, and analysts who prepare recurring OKR updates in Excel. It works best for teams that already maintain OKR data in spreadsheets and need a cleaner reporting layer.
It is not intended to replace a full OKR software platform with automated reminders, permission workflows, HR integrations, or real-time comment threads. It is a practical Excel dashboard for reporting, review, and analysis.
Real-World Use Cases
Strategy lead: Prepares monthly leadership reviews using the Overview, Progress, Risk, and Financials pages instead of building new slides every month.
Department head: Filters the workbook by department and team to review completed initiatives, target achievement, budget variance, and owner check-ins.
Consultant: Uses the workbook as a client-ready OKR reporting template during quarterly business reviews and transformation program check-ins.
Advantages of OKR Management Dashboard in Excel
- It centralizes OKR progress, budget, spend, risk, confidence, and owner activity in one workbook.
- It uses familiar Excel features, so teams can edit fields, labels, colors, and formulas as needed.
- It supports offline reporting and a one-time purchase model.
- It gives managers a practical way to compare target value, achieved value, completion, alignment, and budget variance.
Opportunities for Improvement
- Add automated Power Query imports if your OKR data comes from multiple source files.
- Add monthly or quarterly targets for completion rate, budget variance, confidence, and alignment score.
- Add owner-level comments or action notes if your review process needs qualitative follow-up.
- Use SharePoint or OneDrive carefully if multiple people need controlled access to the workbook.
Best Practices
- Keep source data in the same column format every time you update the Data Sheet tab.
- Use consistent names for cycles, departments, teams, owners, statuses, priorities, and risk levels to avoid duplicate slicer values.
- Refresh all pivots after every data update.
- Review progress and budget together so you can see whether spending is creating measurable achievement.
- For help with pivot tables, see Microsoft’s official guide: Create a PivotTable to analyze worksheet data.
Explore Relevant Templates
Frequently Asked Questions
What is the OKR Management Dashboard in Excel?
It is an Excel dashboard template for tracking objectives, key results, initiatives, budget, spend, target value, achieved value, status, confidence, risk, alignment, teams, owners, and departments.
How many sheets are included?
The workbook includes Overview, Progress, Teams, Risk, Financials, Data Sheet, and Support Sheet tabs.
Can I add my own OKR data?
Yes. Replace the sample data in the Data Sheet tab while keeping the same format, then refresh all pivots.
Does this dashboard require macros?
No. It uses standard Excel features such as pivot tables, slicers, charts, and formulas.
Can I customize the dashboard?
Yes. Because it is an Excel workbook, you can edit charts, slicers, formulas, labels, colors, fields, and source records.
Does it replace OKR software?
No. It is a reporting workbook, not a full OKR workflow system with reminders, permissions, and collaboration features.
About the Author
Built by PK – Microsoft Certified Professional with 15+ years of Excel, Google Sheets, and Power BI experience. Founder of NextGenTemplates, reaching 300K+ subscribers across YouTube channels. Every template is hand-built and tested before release.
Conclusion
The OKR Management Dashboard in Excel gives teams a structured way to review objectives, key results, initiatives, budget, spend, risk, confidence, alignment, and owner activity in one familiar workbook. It is especially useful for organizations that want practical OKR reporting without adding a new SaaS platform.
Click here to purchase OKR Management Dashboard in Excel
Visit our YouTube channel to learn step-by-step Excel dashboard tutorials.