The Fertilizer Usage Data Entry System in Excel is a 4-sheet macro-enabled workbook that turns fertiliser record keeping into a 20-second job. Each application goes in through a 7-field form, lands in a 10-column table with its own Record ID and automatic timestamp, and rolls straight into 4 stat cards. The Setting sheet ships with 34 ready-made dropdown options across 4 lists, and the file arrives with 6 demonstration rows you delete before you start.
Most growers already know what they applied last week. The problem is finding it again six months later. A diary entry cannot be filtered by field, a photo of a bag cannot be added up, and a plain spreadsheet drifts the moment two people type the same crop name three different ways. This workbook fixes the boring part: a form with dropdowns so entries stay consistent, an ID so edits hit the right row, and four totals that keep themselves current.
One thing to be clear about up front, because it shapes everything below. This is a record of what you applied. It stores the field, crop, product name, quantity, date, cost and status that you type, and it adds them up. It does not recommend products, work out application rates, interpret a soil test, or assess crop, soil or water outcomes. Every figure on screen is a figure somebody entered by hand.
Key Features of the Fertilizer Usage Data Entry System in Excel
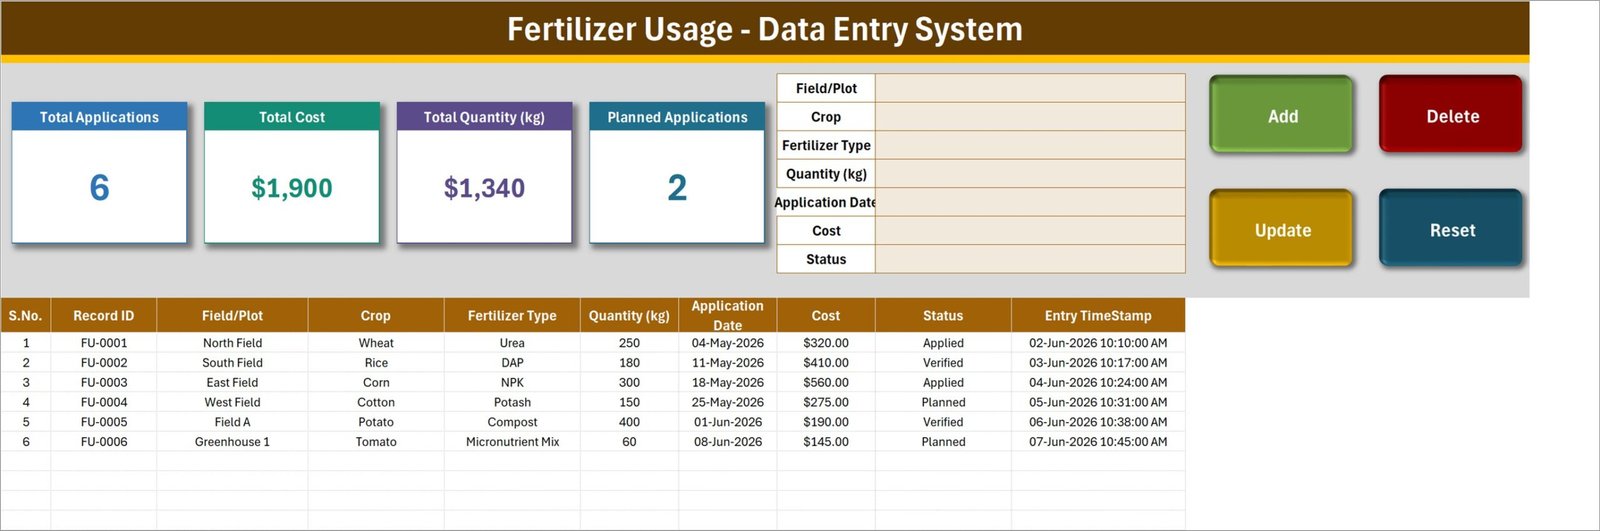
- A 7-field form for one application. Field/Plot, Crop, Fertilizer Type, Quantity (kg), Application Date, Cost and Status sit in one block at the top of the Data Entry sheet. Five of the seven are dropdowns, so most of an entry is picked rather than typed.
- Four working VBA buttons. Add writes a new record, Update saves changes back, Delete removes one after a confirmation that names the Record ID, and Reset clears the form. The macros ship inside the .xlsm and are live on first open.
- Every record carries an ID. Entries are stamped FU-0001, FU-0002 and upward. Double-click a row to load it into the form and the workbook remembers that ID, so Update writes back to the correct record even if the table has been sorted since. You never have to reselect the row.
- Four stat cards above the table. Total Applications, Total Cost, Total Quantity (kg) and Planned Applications. They are linked pictures of live cards on the Setting sheet, so they recalculate as records are added and can be restyled from one place.
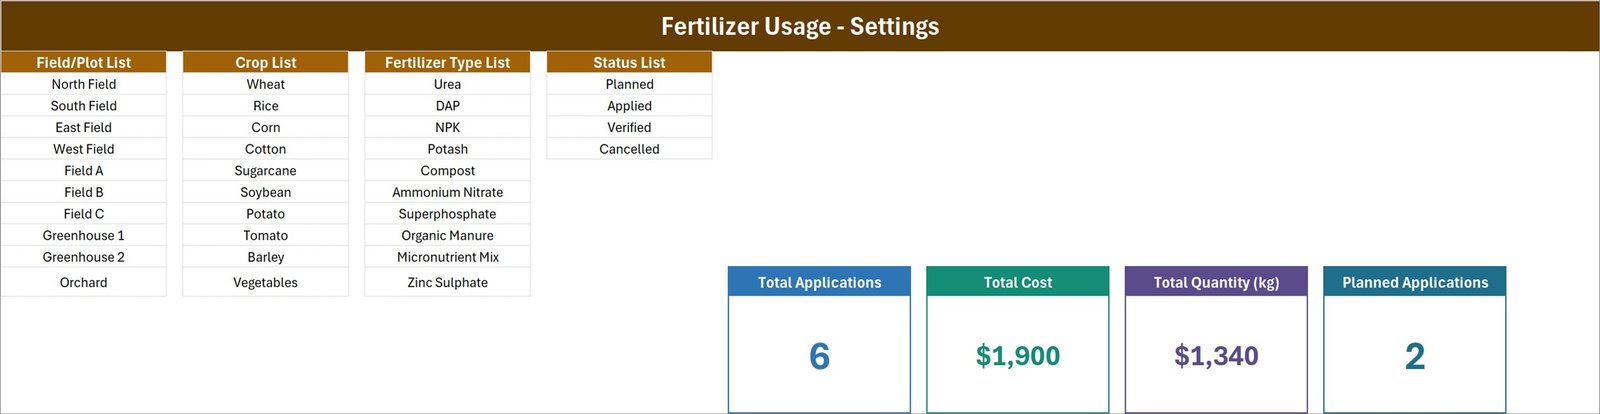
- 34 editable dropdown options. 10 fields and plots, 10 crops, 10 product types and 4 status values. Add or delete a row in a Setting-sheet list and the matching dropdown updates itself, with no named ranges to re-point.
- Two dates per record. Application Date is typed; Entry TimeStamp is written automatically when the record saves. That separation is what makes the log auditable later on.
- One offline file. A single .xlsm on your own machine. No account, no sync, no per-seat fee, and your records never leave your computer.
Sheets Explanation
The workbook holds four sheets. Three are shown below; the fourth is described in text.
Sheet 1: Data Entry
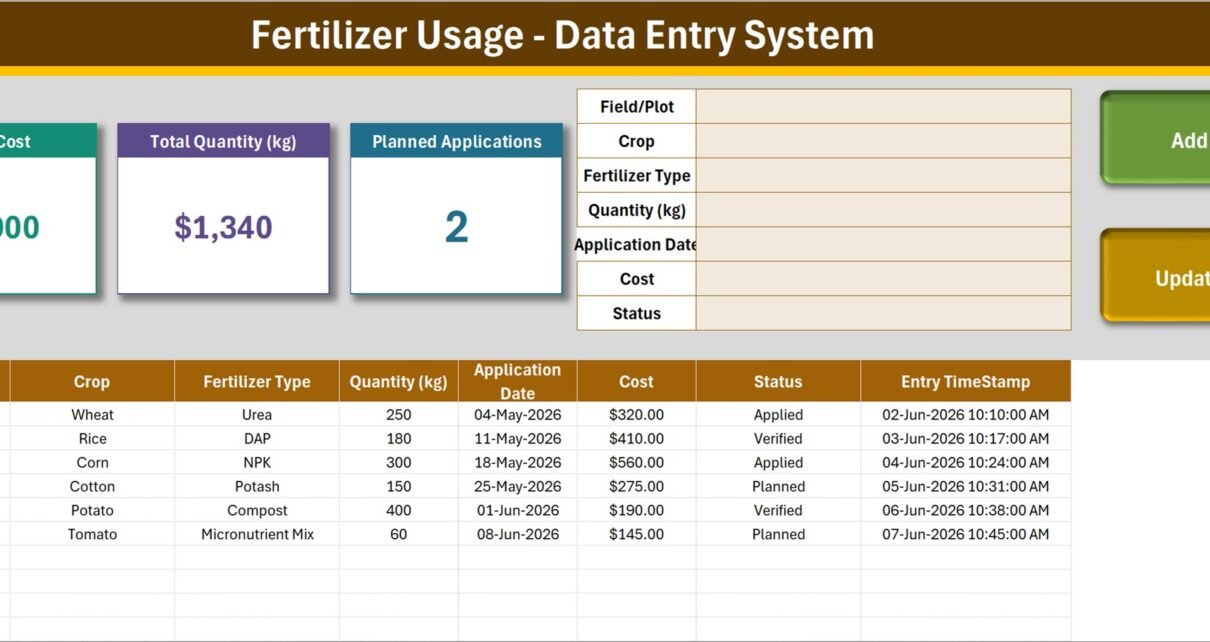
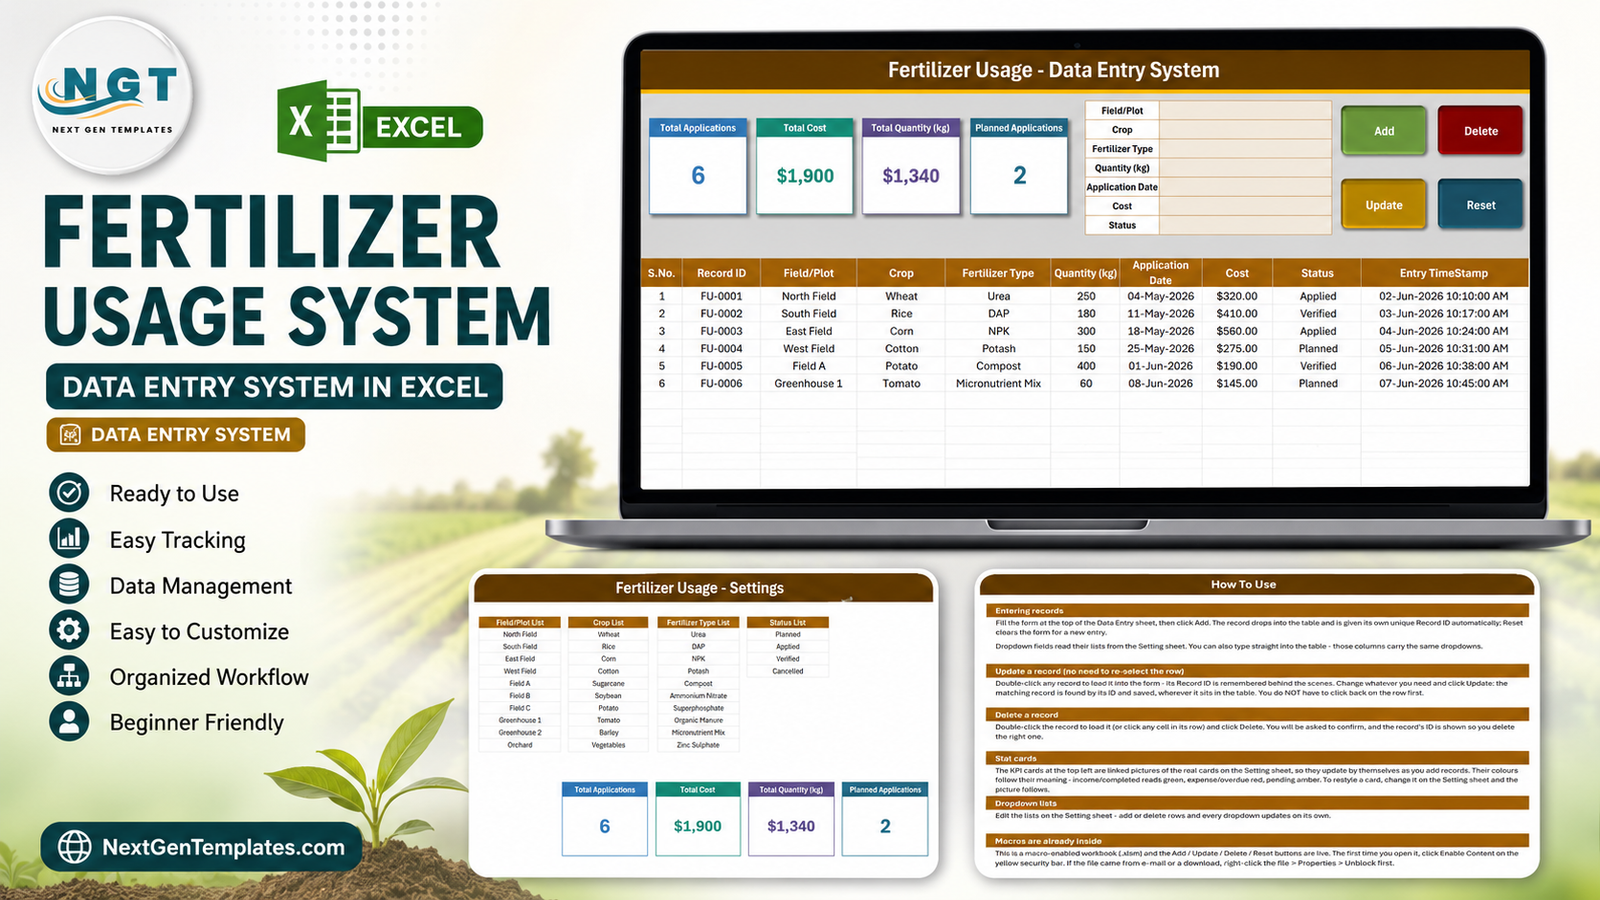
The screen you work on. Four stat cards run across the top left, the 7-field entry form sits beside them, and the Add, Delete, Update and Reset buttons sit on the right. Below that the record table carries 10 columns: S.No., Record ID, Field/Plot, Crop, Fertilizer Type, Quantity (kg), Application Date, Cost, Status and Entry TimeStamp. The six shipped rows, FU-0001 to FU-0006, are demonstration data only – invented field names, crops and figures so that the table and the cards have something to show. Delete them before your first real entry.
Sheet 2: Setting
Where the dropdowns come from. Four lists sit across the top: Field/Plot List and Crop List with 10 entries each, Fertilizer Type List with 10 product names, and Status List with Planned, Applied, Verified and Cancelled. The four stat cards on the right of this sheet are the originals – the Data Entry sheet shows linked pictures of them, so a colour or label change here flows through to the working screen. If you want the workbook to speak your farm’s language, this is the only sheet you need to edit. Excel’s own data validation documentation explains the mechanism underneath if you want to add a fifth list of your own.
Sheet 3: Instructions
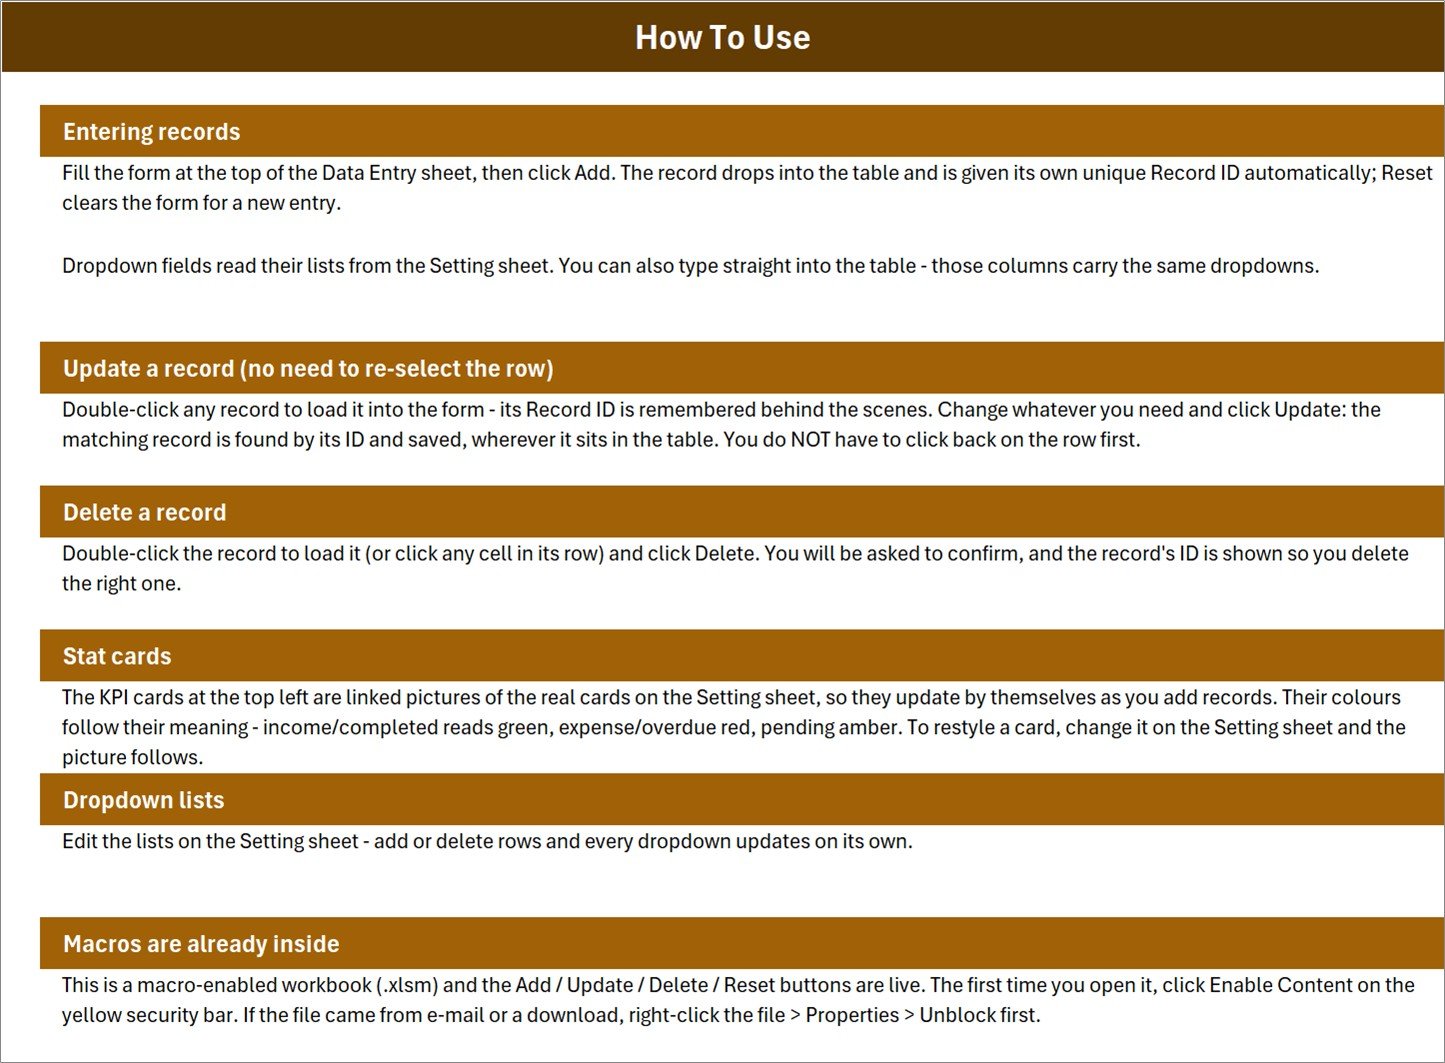
A single-page How To Use reference with six blocks: entering records, updating a record without reselecting the row, deleting a record, how the stat cards stay live, editing the dropdown lists, and enabling macros. The last block also covers the Unblock step – right-click the file, Properties, Unblock – which Windows requires for a macro file that arrived by download or e-mail. Microsoft’s guide to enabling macros in Microsoft 365 files is worth a read if your organisation locks macros down by policy.
Sheet 4: Get More Templates
A short in-workbook links page pointing back to the wider NextGenTemplates catalogue. It holds no data and can be deleted without affecting the form, the macros or the stat cards.
Fertilizer Usage Data Entry System in Excel vs. a Google Sheets Equivalent vs. Paid Farm SaaS – Feature Comparison
| Feature | Fertilizer Usage Data Entry System in Excel | Google Sheets equivalent | FarmBrite / Agrivi |
|---|---|---|---|
| Cost | $6.99 one-time | Free to build, hours to make | $25-150 / user / month |
| Platform | Microsoft Excel, desktop | Browser, Google account | Web plus vendor mobile app |
| Setup time | Under 10 minutes | 2-6 hours to build the form | Days, plus onboarding |
| Works with no internet | Yes | Offline mode only, limited | No |
| Real-time team collaboration | No – single file | Yes | Yes |
| Mobile entry in the field | No | Yes, via the Sheets app | Yes |
| Editable dropdown lists | Yes – 34 options across 4 lists | Yes, if you build them | Vendor-defined lists |
| Your data stays on your machine | Yes | No – Google servers | No – vendor servers |
| Year-1 cost at 5 users | $6.99 total | $0 plus your build time | $1,500-9,000 |
For a grower who needs a tidy, searchable record of what went on which field without paying a monthly per-seat fee, the Fertilizer Usage Data Entry System in Excel sits in the sweet spot.
Who Should Use This Template
Perfect for:
- Smallholders and family farms keeping their own record of applications by field and crop
- Farm managers moving off a paper notebook who want entries searchable and totalled
- Greenhouse, orchard and nursery operators watching cost per plot across a season
- Farm office staff and agronomy assistants entering records on behalf of field teams
- Anyone who prefers one Excel file they own to a subscription farm platform
Not a fit if:
- You want advice on what to apply or how much – this workbook makes no recommendation of any kind
- You need rate calculation, nutrient planning, soil test interpretation or crop safety assessment
- You need records that satisfy a regulatory, environmental or certification requirement – this is an internal log and is not designed for that
- Several people must enter records simultaneously – it is a single desktop file
- Entry happens on a phone in the field rather than at a desk
- You are on a Mac Excel build where VBA buttons are unavailable
Real-World Use Cases
Ravi manages 40 hectares split across seven plots. He used to write applications in a diary and by harvest could no longer say what each plot had received. Now every application is logged against a named field with its cost, so at year-end he can see what each plot cost him without adding up a notebook by hand.
Elena runs a two-greenhouse nursery with seasonal staff. Her team logs applications as Planned when scheduled and switches them to Applied once done. She glances at the Planned Applications card on a Monday morning and sees exactly what is still outstanding for the week – a two-second check that used to be a phone call.
Tom keeps the office records for a mixed arable farm. The field team calls in what they did and Tom types it into the form; the Entry TimeStamp records when it reached the books, separately from the day it happened. When the farm’s own agronomist visits, Tom filters the table by field and hands over an accurate history rather than a shoebox.
Advantages of the Fertilizer Usage Data Entry System in Excel
- It is cheaper than the time you already spend. At $6.99 once, the workbook costs less than an hour of anyone’s time, and it replaces the annual ritual of reconstructing a season from receipts.
- Dropdowns kill the data-quality problem. The single biggest failure of a hand-rolled log is the same field typed four ways. Picking from a list means the table can actually be filtered and summed later.
- Editing is safe. Because Update matches on Record ID rather than on the row you happen to have selected, a sorted or filtered table cannot cause you to overwrite the wrong record.
- Nothing to maintain. No login, no renewal, no vendor deciding to change the pricing tier. The file works the same in five years as it does today.
- Your records stay yours. The workbook lives on your machine. No third party holds a copy of what you applied and what it cost.
- Cost visibility comes free. Because Cost is a field rather than an afterthought, the Total Cost card gives you a running input spend without a second spreadsheet.
Opportunities for Improvement
An honest list, because knowing the edges is what makes a tool usable.
- The Total Quantity (kg) card is currency-formatted in the shipped file. 1,340 kg of product displays as “$1,340” on both the Data Entry and Setting sheets. The total itself is correct – it is the sum of the Quantity column – and only the number format is wrong. To fix it, go to the Setting sheet, select the value cell inside the Total Quantity card, and apply a plain Number format with a thousands separator; the linked picture on the Data Entry sheet updates with it. This is a formatting defect in the template, not a calculation error.
- There are no charts. The workbook gives you four totals and a clean table, not trend lines or breakdowns by field. If you want to see cost by crop over a season, build a PivotTable on the record table or step up to a dashboard template.
- Quantity is kilograms only. The column is labelled Quantity (kg), so litres, bags or tonnes need converting before entry, or a relabelled column of your own.
- Single user, single file. Two people cannot type into it at once, and there is no change history beyond the entry timestamp.
- No per-hectare or per-area normalisation. The workbook records a quantity against a field; it does not know how big that field is, so it cannot express anything per unit of area. Deliberately so – that starts to look like rate calculation, which is outside what this template does.
- Macros must be enabled. On a locked-down corporate machine the four buttons may be blocked by policy, which reduces the workbook to a manual table.
Best Practices
- Set up the Setting sheet before your first entry. Replacing the four lists with your real field names, crops, products and statuses takes five minutes and saves a cleanup later.
- Delete the six demo rows first. FU-0001 to FU-0006 are invented. Leaving them in quietly inflates all four stat cards.
- Use Status as a workflow, not a label. Planned when scheduled, Applied when done, Verified when someone has checked it, Cancelled when it did not happen. The Planned Applications card then means something.
- Enter the same day where you can. The Entry TimeStamp is only useful as an audit trail if the gap between doing and recording stays short.
- Keep product names exactly as they appear on the bag. Add them to the Fertilizer Type List once and pick from it every time, so a season’s records group cleanly.
- Back the file up. One local .xlsm is a single point of failure. Copy it to cloud storage or an external drive on a schedule.
- Do not use it as your compliance record. If a scheme or authority requires records from you, find out what format they want and treat this workbook as your own working copy.
Explore Relevant Templates
The nearest sibling is the Livestock Register Data Entry System in Excel, which applies the same form-and-cards layout to animal records. From the same agriculture batch, the Harvest Record Data Entry System in Excel logs what came off each field and the Poultry Egg Production Data Entry System in Excel covers daily collection. Run alongside this one, they give you input, output and livestock records in three matching workbooks.
When you want to analyse rather than log, the Agriculture and Farm Dashboard in Excel and the Farm Management KPI Dashboard in Excel chart a season’s numbers, and the same view is available as the Agriculture and Farm Dashboard in Power BI. Outside agriculture, the Petty Reimbursement Data Entry System in Excel uses the identical engine for expense claims, and the whole VBA Tool collection is built the same way.
Frequently Asked Questions
Does the Fertilizer Usage Data Entry System tell me what to apply or how much?
No. The Fertilizer Usage Data Entry System in Excel makes no recommendations at all. It records applications you have already decided on and carried out. Product names, quantities, dates and costs are values you type; the workbook only stores and totals them.
What exactly does the workbook track?
The Fertilizer Usage Data Entry System tracks seven fields per record – Field/Plot, Crop, Fertilizer Type, Quantity (kg), Application Date, Cost and Status – plus an automatic Record ID and Entry TimeStamp, and summarises them in four stat cards above the table.
Can I change the fields, crops and product names in the dropdowns?
Yes. All four lists sit on the Setting sheet of the Fertilizer Usage Data Entry System and ship with 34 options in total. Add or delete rows there and every dropdown on the Data Entry sheet updates automatically, with nothing else to re-point.
Are the six rows in the file real farm data?
No. Rows FU-0001 to FU-0006 are demonstration data, included only so the table and stat cards display something on first open. The field names, crops, quantities and costs are invented. Delete them before entering your own records.
Why does the Total Quantity card show a dollar sign?
That is a formatting defect in the shipped workbook – the Total Quantity (kg) card is currency-formatted, so 1,340 kg reads as “$1,340”. The sum is correct. Select the card’s value cell on the Setting sheet and apply a plain Number format to fix it.
Will this satisfy an inspector or a certification scheme?
No. The Fertilizer Usage Data Entry System is an internal record-keeping workbook and makes no compliance claims. It is not designed to meet any regulatory, environmental, labelling or certification requirement. Check what your own scheme asks for before relying on any spreadsheet.
How does this compare to FarmBrite or Agrivi?
Those are subscription farm-management platforms with mobile apps, multi-user access and much broader scope. The Fertilizer Usage Data Entry System in Excel does one job – a clean application log – for a single one-time payment, offline, with your data on your own machine.
How long does setup take?
Under 10 minutes for most buyers. Enabling macros is one click, replacing the four Setting-sheet lists takes a few minutes, and deleting the six demo rows takes seconds. After that the Fertilizer Usage Data Entry System is ready for live records.
About the Author
Built by PK – Microsoft Certified Professional with 15+ years of Excel, Google Sheets, and Power BI experience. Founder of NextGenTemplates, reaching 300K+ subscribers across YouTube channels. Every template is hand-built and tested before release.
Conclusion
The Fertilizer Usage Data Entry System in Excel does not try to be a farm platform. It does one narrow thing properly: it makes a fertiliser application log that is quick to fill in, consistent enough to filter, safe to edit, and totalled without you asking. Four sheets, seven fields, 34 dropdown options and four stat cards – and one number format worth fixing on day one.
If your applications currently live in a notebook, a phone note or a spreadsheet nobody trusts, this is the smallest step that makes them useful.
👉 Click here to Purchase the Fertilizer Usage Data Entry System in Excel
Instant download · One-time payment · No subscription
For step-by-step Excel and VBA video tutorials, visit Youtube.com/@PK-AnExcelExpert.
Last updated: August 2026