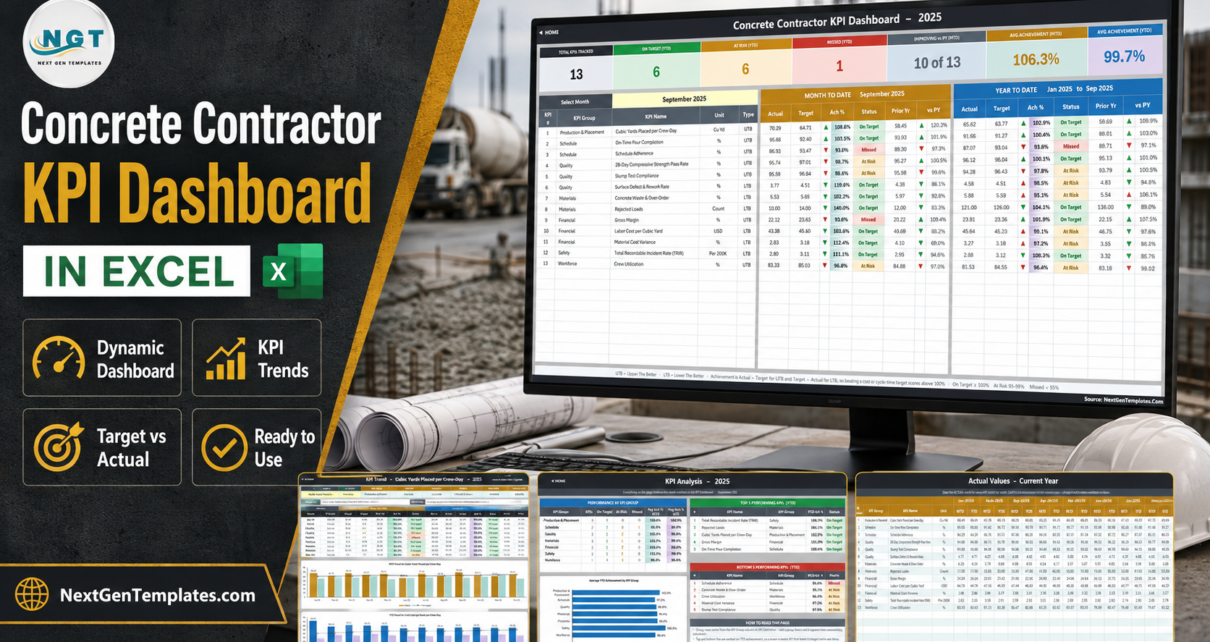
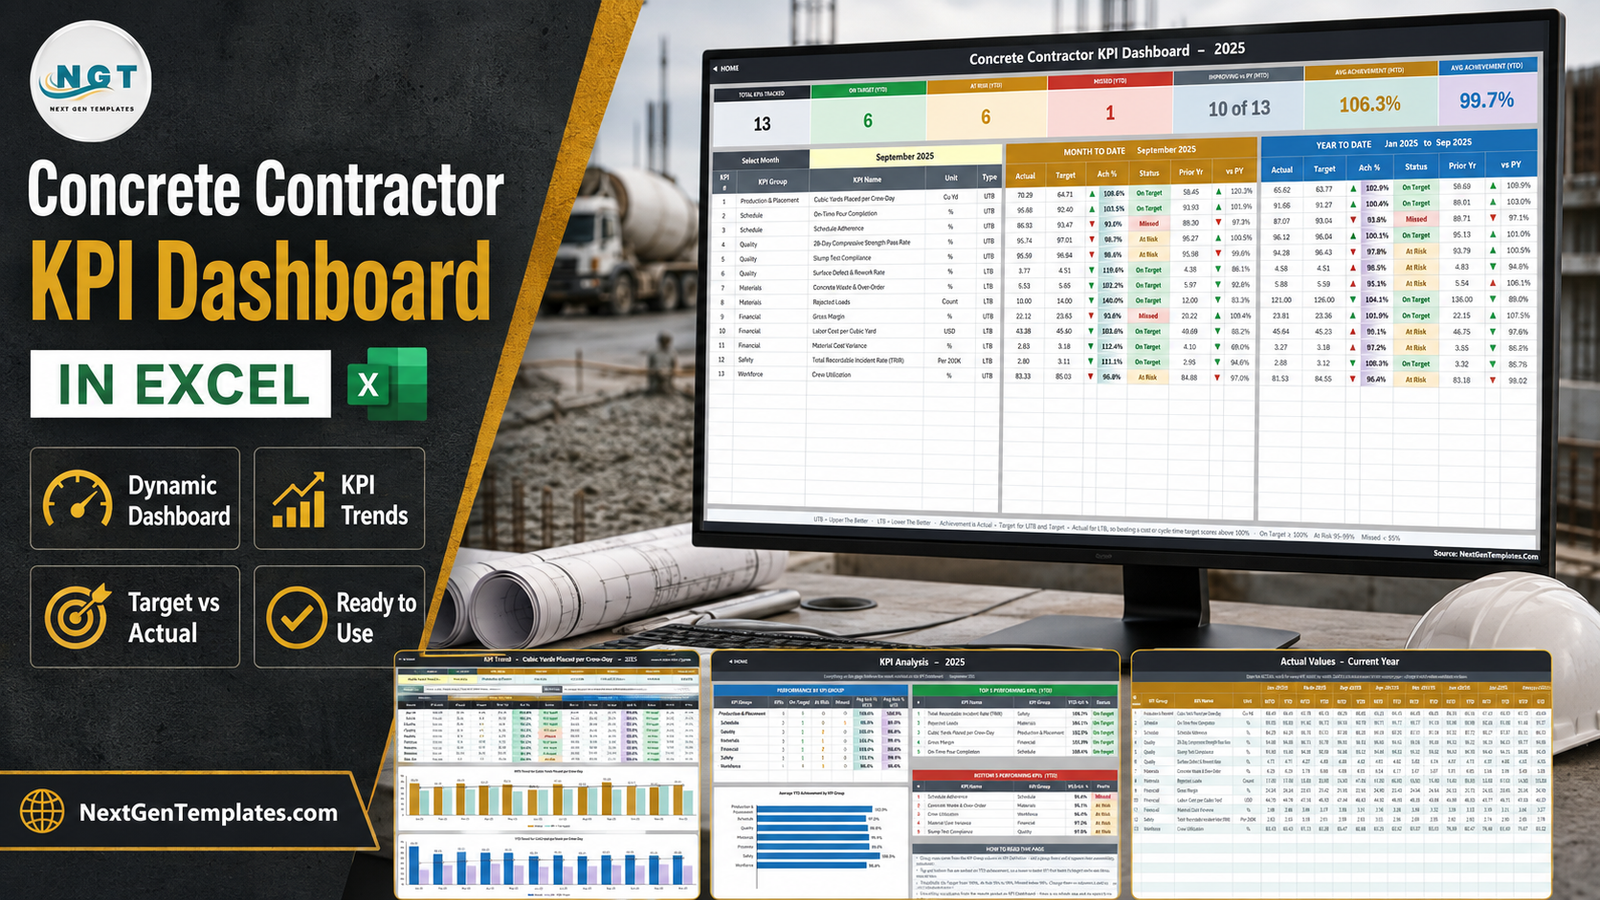
The Concrete Contractor KPI Dashboard in Excel tracks 13 concrete-specific KPIs across 7 KPI groups on 11 worksheets, with a single month dropdown that redraws seven summary cards and both a month-to-date and a year-to-date block. Every figure in it is a plain worksheet formula — VLOOKUP, MATCH, INDEX and COUNTIF — with no Power Query, no data model, no macro and no add-in. It opens in Excel 2013 and later, and in Excel for the web.
Concrete work is measured in things that pull against each other. Push cubic yards per crew-day and rework creeps up. Order tight to avoid waste and you risk a short pour. Most contractors already collect these numbers in a dozen places — batch tickets, break-test reports, timesheets, the job cost report — and nobody sees them on one page against target. That is the gap this workbook fills: a monthly KPI pack you type into and read, not a system you have to be onboarded onto.
Which Template This Actually Is
Three NextGenTemplates families carry near-identical names, so it is worth being blunt about which one this is. This is the KPI Dashboard line: a month-picker scorecard with traffic lights, a per-KPI trend page and a group roll-up page. It is not the Concrete Contractor KPI Scorecard in Excel, which is a lighter ten-KPI scorecard from the KPI Scorecard line, and it is not the analytical Construction Dashboard in Excel, which drives slicer-filtered charts off a record-level table. They are three different files. Buy the one that matches how you report.
Key Features of the Concrete Contractor KPI Dashboard in Excel
- 13 KPIs across 7 groups. Production & Placement, Schedule, Quality, Materials, Financial, Safety and Workforce — from Cubic Yards Placed per Crew-Day through 28-Day Compressive Strength Pass Rate and Concrete Waste & Over-Order to Gross Margin, Labor Cost per Cubic Yard and Total Recordable Incident Rate.
- Direction-aware achievement. Each KPI carries a UTB (upper the better) or LTB (lower the better) flag. Achievement is Actual ÷ Target for UTB and Target ÷ Actual for LTB, so beating a waste, rework, cost or incident-rate target scores above 100%. Seven of the 13 supplied KPIs are UTB; six are LTB.
- Traffic lights with editable bands. On Target from 100%, At Risk from 95% to 99%, Missed below 95%. The thresholds are written into the visible formulas in columns L and U of the KPI Dashboard sheet.
- Arrows that know what “good” means. The arrow shows the raw direction against the comparator; its colour shows whether that direction is good for that KPI. A falling labour cost therefore renders as a green down-arrow.
- 22 KPI rows wired, 13 filled. The remaining rows are live and empty, so a new KPI needs no formula work at all — type it on KPI Definition and it appears everywhere.
- Twelve months of sample data included for actual, target and prior year, so the workbook works the moment you open it.
Dashboard Pages Explanation
Home
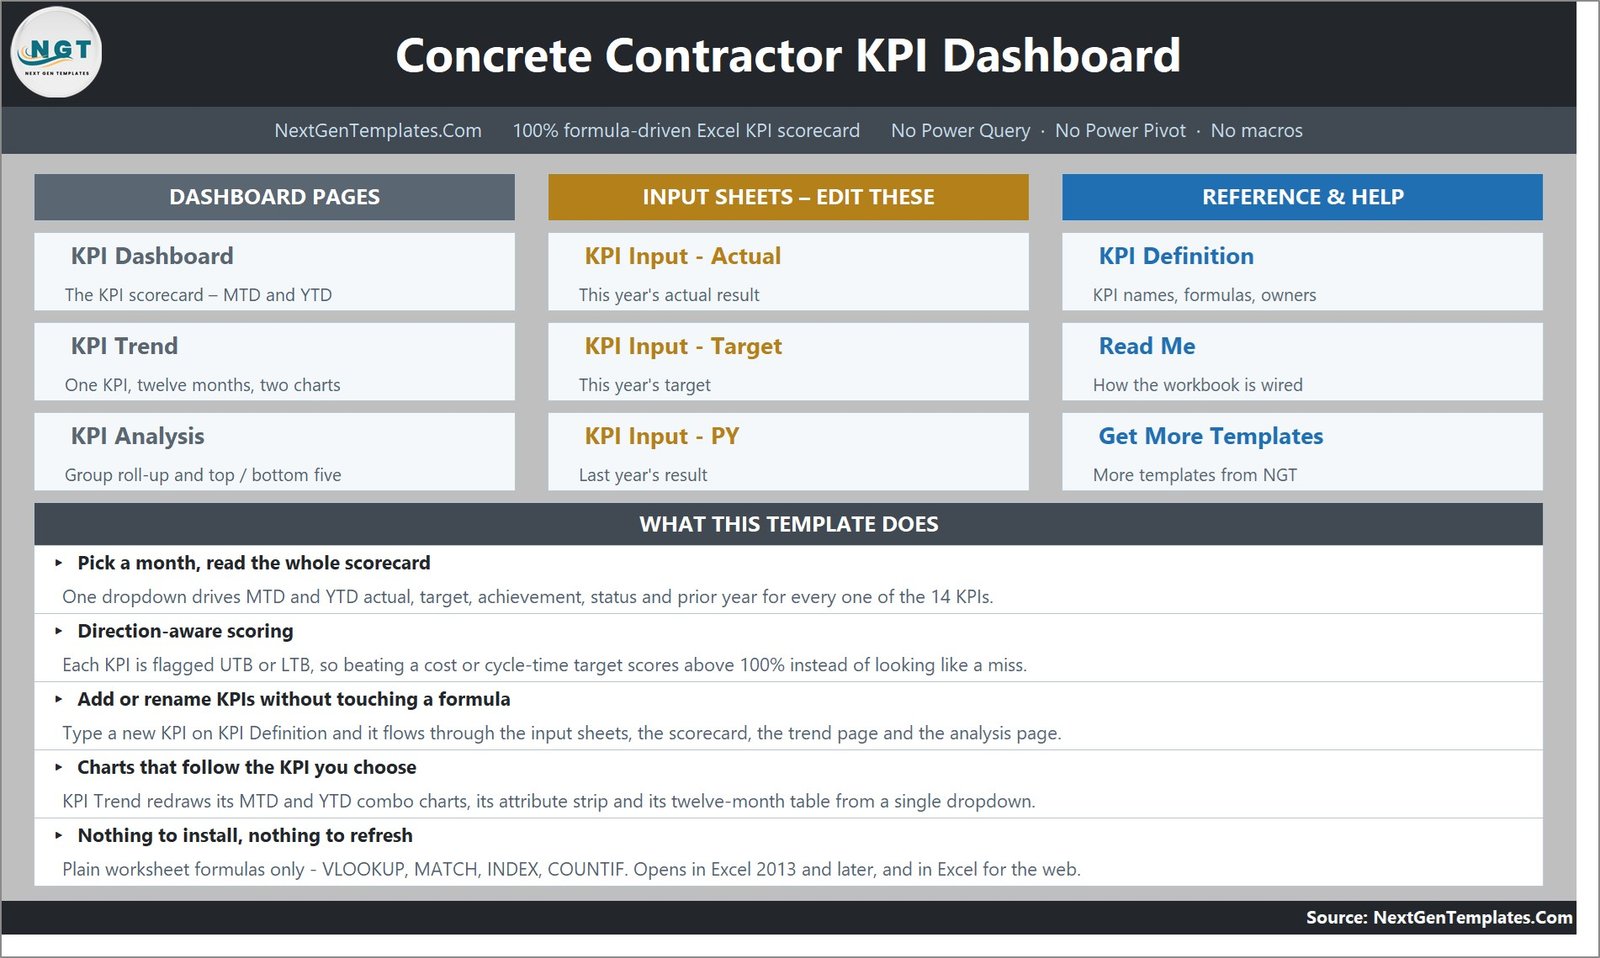
A navigation hub in three tiled columns — Dashboard Pages, Input Sheets and Reference & Help — over a “What This Template Does” panel covering the month picker, direction-aware scoring, adding KPIs without formulas, the linked charts, and the no-install promise.
KPI Dashboard
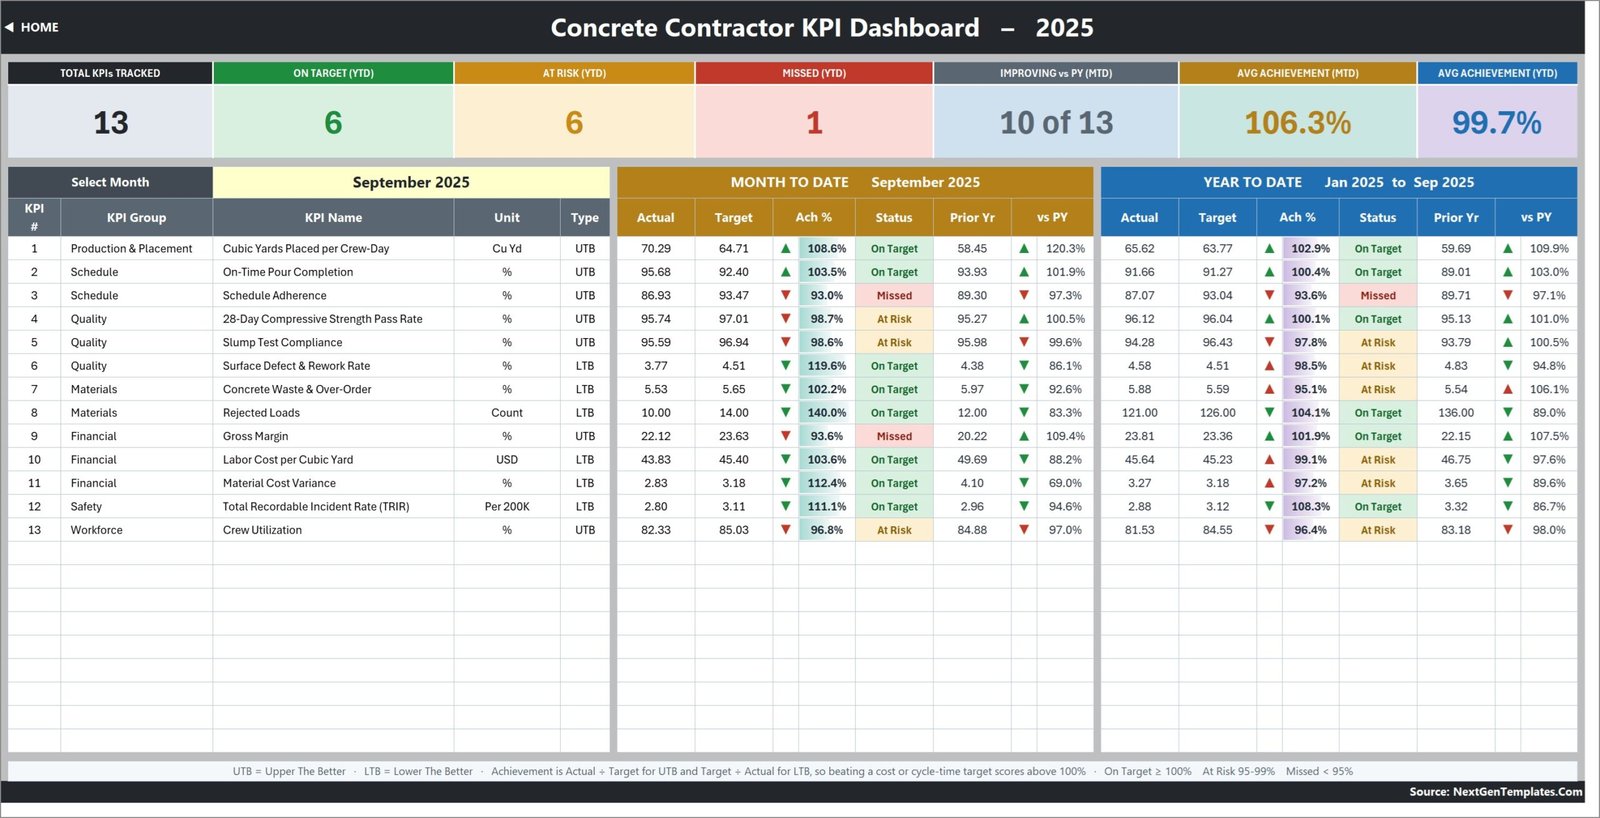
The scorecard itself. Seven summary cards read Total KPIs Tracked, On Target (YTD), At Risk (YTD), Missed (YTD), Improving vs PY (MTD), Avg Achievement (MTD) and Avg Achievement (YTD). Under them, each KPI gets one row carrying group, name, unit and type, then Actual, Target, Ach %, Status, Prior Yr and vs PY — once for the selected month and once for the year to date. In the September 2025 sample the cards read 13, 6 On Target, 6 At Risk, 1 Missed, 10 of 13 improving, 106.3% average MTD achievement and 99.7% YTD. Schedule Adherence is the single Missed row, at 93.6% year to date.
KPI Trend
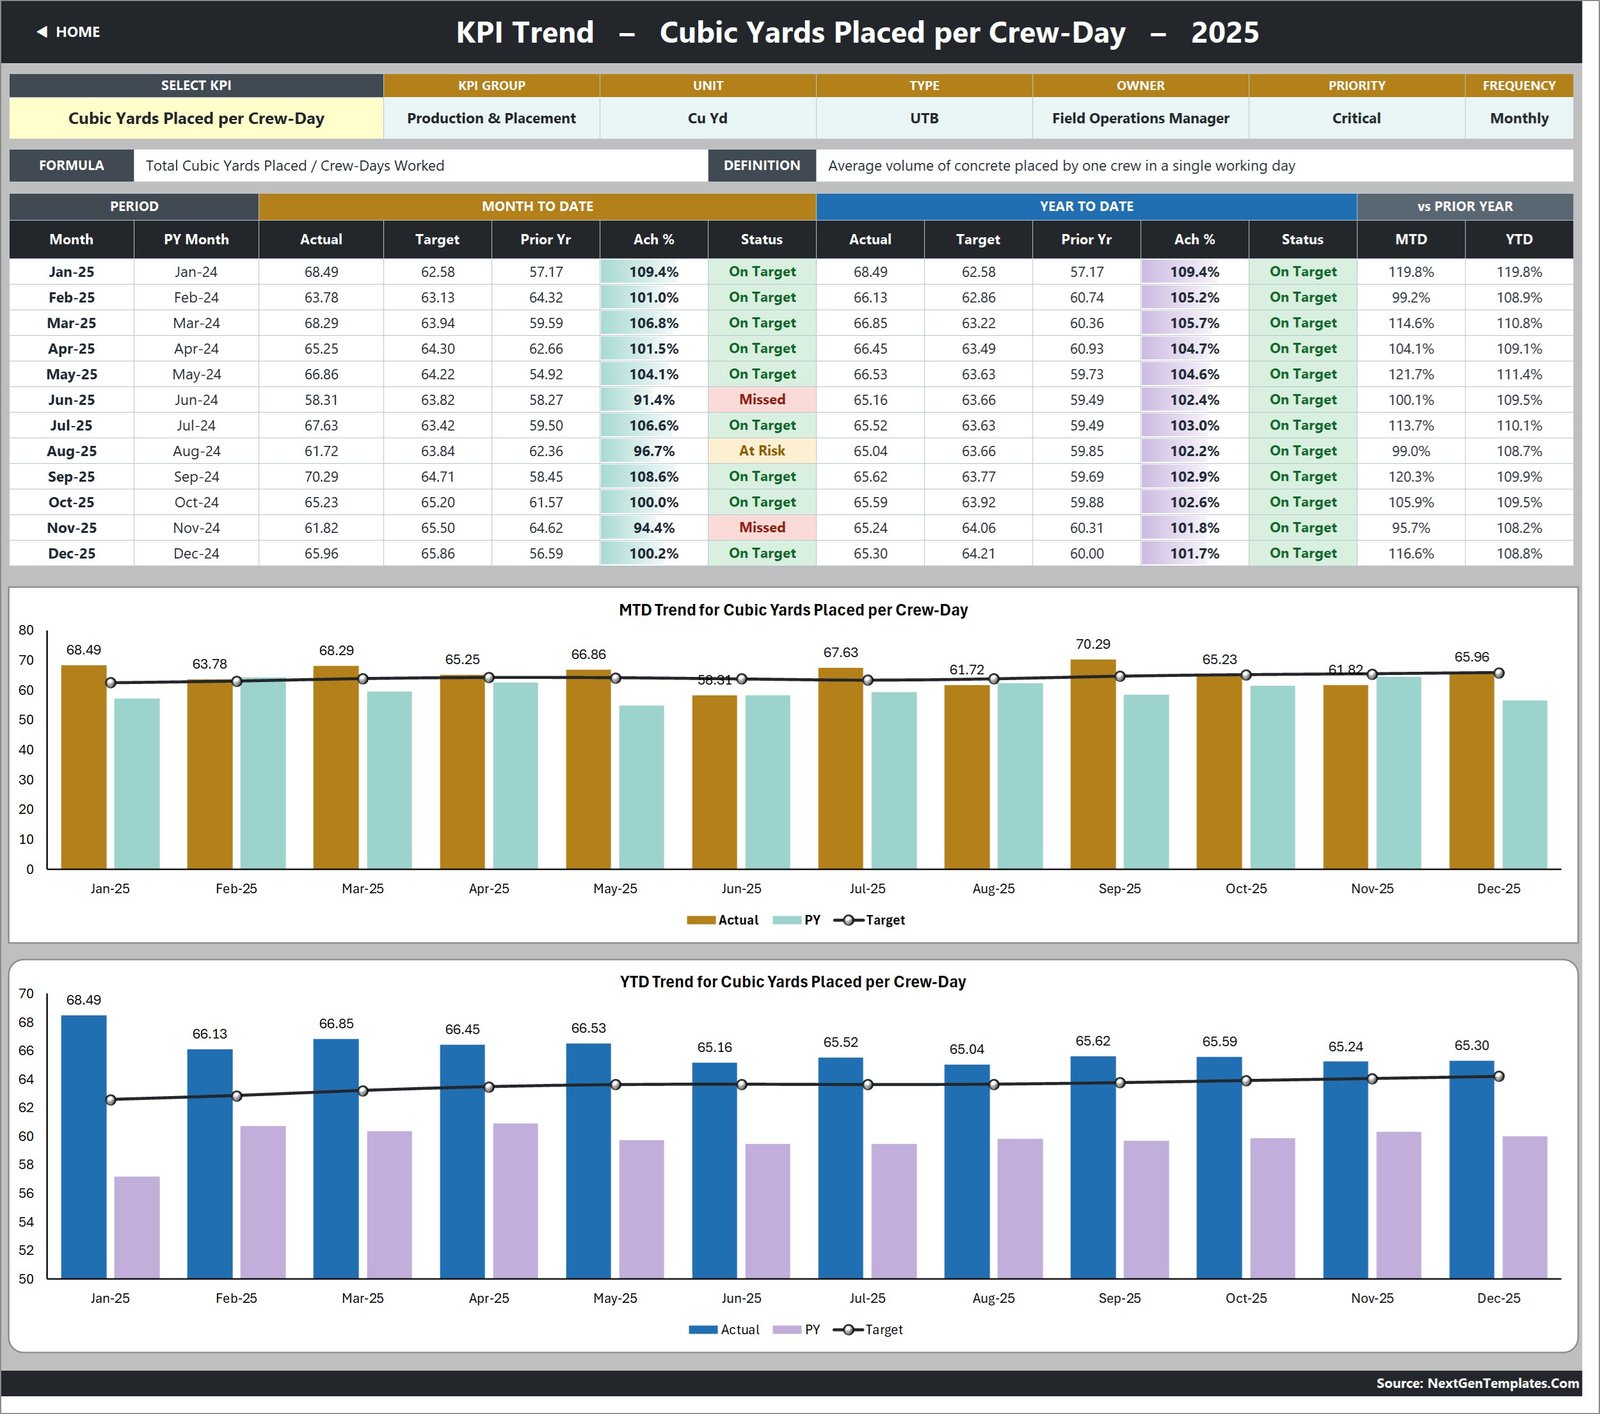
One KPI at a time, chosen from a dropdown in cell B4. The attribute strip shows group, unit, type, owner, priority and frequency; a bar underneath carries the KPI’s formula text and definition. Then a twelve-month table of MTD and YTD actual, target, prior year, achievement and status, and two combo charts — MTD Trend and YTD Trend — each plotting actual and prior-year columns against a target line.
KPI Analysis
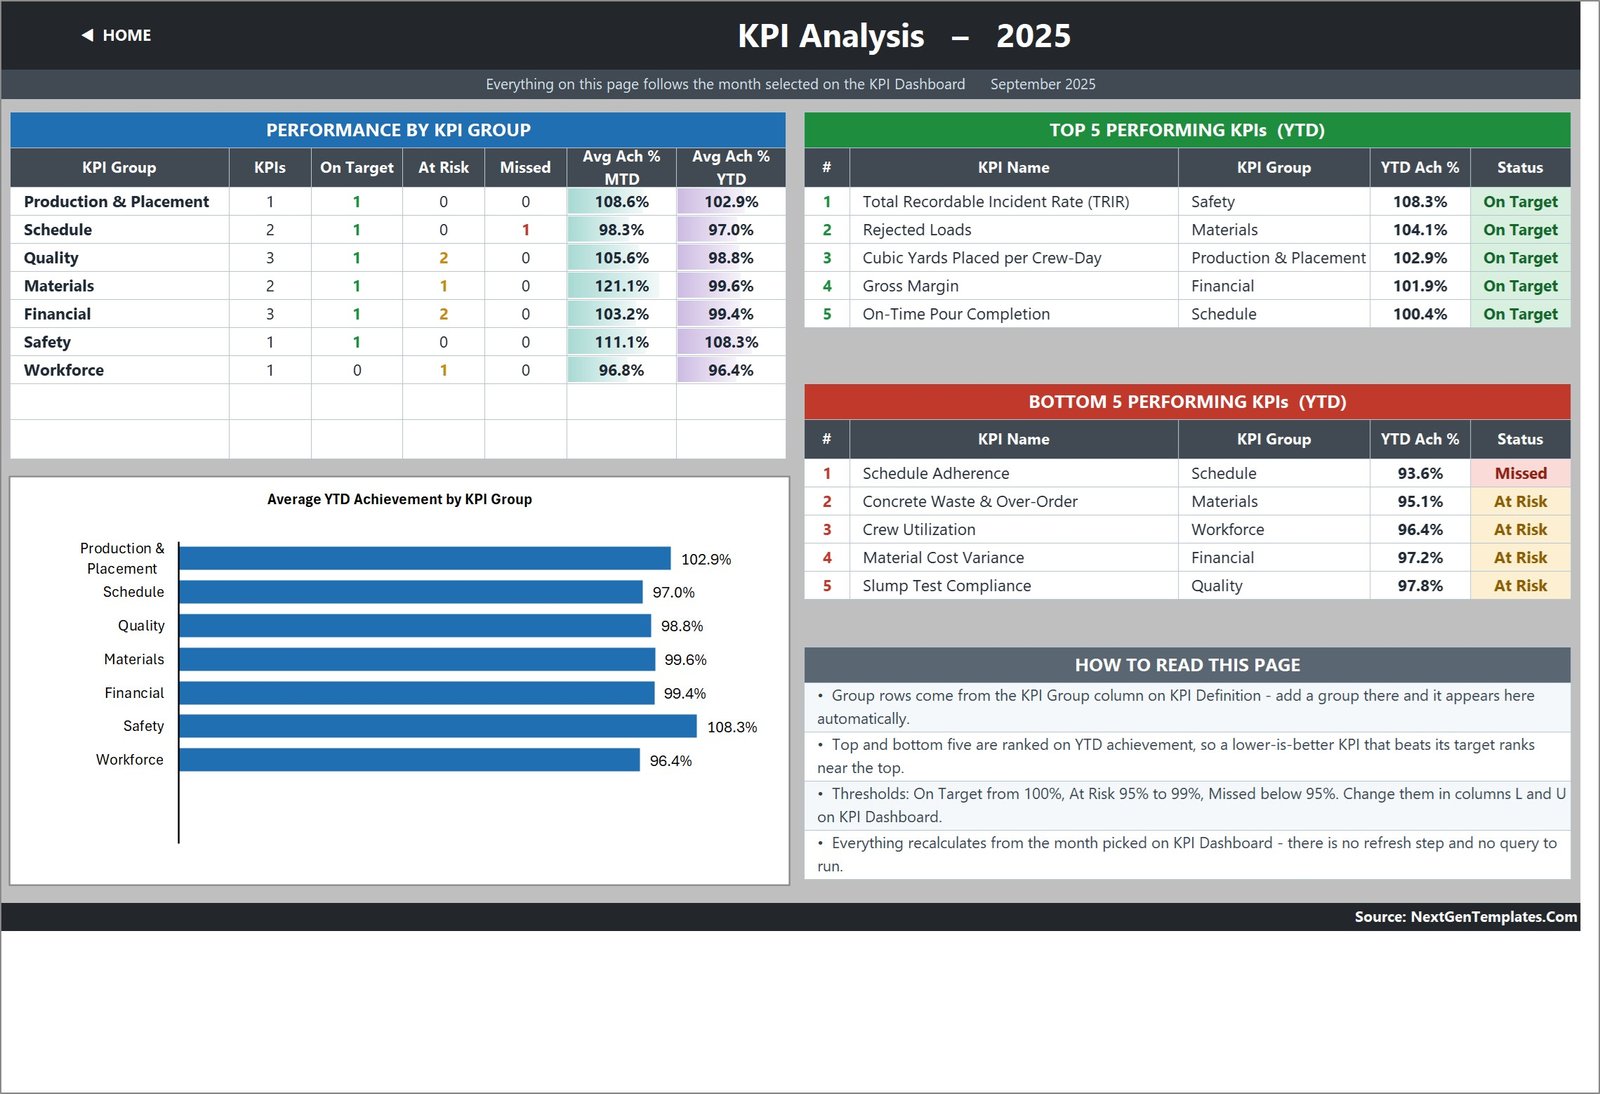
Achievement rolled up by KPI group: a row per group with its KPI count, On Target / At Risk / Missed counts and average MTD and YTD achievement, plus an Average YTD Achievement by KPI Group bar chart. To the right, Top 5 Performing KPIs (YTD) and Bottom 5 Performing KPIs (YTD). Because the ranking uses direction-aware achievement, TRIR sits at the top of the sample’s Top 5 at 108.3% — a low incident rate scoring as the win it is.
The input and reference sheets
Three input sheets — KPI Input – Actual, KPI Input – Target and KPI Input – PY — each hold an MTD and a YTD column for all twelve months, with rows driven by KPI Definition so they always line up. KPI Definition is the master list: number, group, name, unit, formula, definition, type, owner, priority and frequency. A hidden Support sheet holds the helper calculations, and a Read Me page documents how the whole thing is wired. A final Get More Templates sheet links back to the catalogue.
Concrete Contractor KPI Dashboard in Excel vs. a Google Sheets Equivalent vs. Paid Construction SaaS — Feature Comparison
| Feature | Concrete Contractor KPI Dashboard in Excel | Google Sheets equivalent | Procore / Buildertrend |
|---|---|---|---|
| Cost | $12.99 one-time ✅ | $9-15 one-time | $99-375 / user / month |
| Platform | Excel 2013+ and Excel for the web | Browser, Google account required | Browser plus mobile app |
| Setup time | Under 15 minutes ✅ | Copy the sheet, then paste data | Days to weeks, plus onboarding |
| Works offline | Yes — a local .xlsx ✅ | No, needs a connection to edit | Partial, sync required |
| Real-time collaboration | Via OneDrive / SharePoint co-authoring | Native, multi-user ✅ | Native, multi-user |
| Customisable KPIs | 22 rows wired, add one by typing ✅ | Yes, within the sheet’s limits | Restricted to the vendor’s field set |
| Direction-aware (UTB / LTB) scoring | Built in, per KPI ✅ | Usually manual | Varies by module |
| Macros or add-ins required | None ✅ | None | N/A, hosted |
| Year-1 cost at 5 users | $12.99 ✅ | About $15 | $5,940 – $22,500 |
For a concrete crew that wants a monthly KPI review pack without per-seat construction-management fees, the Concrete Contractor KPI Dashboard in Excel sits in the sweet spot.
Who Should Use This Template
Perfect for:
- Owners and operations managers at concrete and flatwork contractors running 2-30 crews on a monthly reporting cycle.
- Project managers who want pour schedule, cylinder pass rate, waste and margin on one page.
- Quality and safety leads already collecting slump, break-test and incident figures who want them scored against target.
- Estimators and finance controllers tracking labour cost per cubic yard and material cost variance month over month.
Not a fit if:
- You need safety or OSHA recordkeeping. TRIR here is one monthly figure you type in. The workbook holds no incident register, produces no OSHA 300 or 300A log and files nothing with any regulator.
- You want live job costing, scheduling or field data capture — nothing connects to an ERP, batch plant or timesheet app.
- You track by pour or by day. The grid is monthly, twelve columns per year.
- You expect the file to derive YTD for you (see the honest limitations below).
Real-World Use Cases
Miguel runs a 40-person flatwork contractor in Texas. First Monday of the month he pastes crew-day volumes, pour completions and rejected-load counts into the three input sheets, picks the month, and walks his foremen through whichever KPIs have gone amber — without buying platform seats for people who only need to read a report.
Priya is quality lead at a structural concrete subcontractor. She owns the 28-Day Compressive Strength Pass Rate and Slump Test Compliance rows. KPI Trend lets her show that pass rate has tracked near target all year, and the Bottom 5 table gives her the evidence to open a conversation about mix supply.
Daniel is finance controller across three ready-mix and placing branches. Labor Cost per Cubic Yard and Material Cost Variance are LTB in his copy, so a month where costs fall reads as above-100% achievement with a green down-arrow — which is exactly how he wants the board pack to read.
Advantages of the Concrete Contractor KPI Dashboard in Excel
- Nothing to install or refresh. Because it is worksheet formulas rather than a data model, it opens on a site laptop, in Excel for the web, or on a machine with a locked-down IT policy. Microsoft’s own VLOOKUP documentation covers everything you need to trace a figure back to source.
- You own the logic. Every threshold and every calculation is visible in a cell. Nothing is hidden in a query or a measure you cannot read.
- Cost. One payment against a per-user monthly subscription is the whole argument for a contractor whose reporting audience is five people, not fifty.
- Direction handling is not an afterthought. Half the KPIs a concrete business cares about are lower-is-better. Getting that wrong turns a good safety month into a red cell — this workbook gets it right by design.
Opportunities for Improvement
An honest list, because it matters more than another feature bullet.
- MTD and YTD are both typed. The workbook does not derive year-to-date from your monthly figures — both columns are input on the three data sheets. That is deliberate, so you keep control of whether a KPI accumulates or averages, but it is more typing than a derived model would need.
- The Frequency column is documentation, not a switch. Setting a KPI to Quarterly labels it; the grid stays monthly for every row.
- The Read Me page carries a leftover example from another industry build — it illustrates cumulative KPIs with aircraft deliveries rather than concrete volumes. The rule it explains is correct; only the example is off-trade.
- The Home page and Read Me both say “14 KPIs” while the file ships and calculates 13. Everything that counts — the summary cards, the analysis roll-up, the rankings — uses the real 13. The two labels are text, and you can correct them in a second.
- No consolidation across jobs or branches. One workbook is one reporting entity. Multiple branches means multiple copies.
Best Practices
- Set the UTB / LTB flag before you enter any data. It drives achievement, status and arrow colour, and it is the one field that silently changes every conclusion if it is wrong.
- Fill KPI Definition first — the input sheets read their rows from it, so renaming later is a single edit rather than a hunt.
- Decide per KPI whether YTD accumulates (counts and volumes, like Rejected Loads) or averages (rates, ratios and per-unit costs), and stay consistent. A compliance percentage that reaches 1,100% by December is the classic sign of an invented KPI pack.
- Move the 100 / 95 threshold bands in columns L and U once, at the start, to match your own governance — then leave them alone so month-on-month comparisons hold.
- Keep the Prior Year sheet populated. Half the value on the KPI Dashboard is the vs PY column, and it is blank without it.
- Save a fresh copy per reporting year rather than overwriting, so last year’s pack stays readable.
Explore Relevant Templates
- Concrete Contractor KPI Scorecard in Excel — the lighter ten-KPI scorecard, same trade, different family.
- Concrete Contractor KPI Scorecard in Google Sheets — that scorecard in the browser.
- Masonry Contractor KPI Dashboard in Excel — the same month-picker dashboard built for masonry.
- Roofing Contractor KPI Dashboard in Excel and Plumbing Business KPI Dashboard in Excel — other trades on the same engine.
- Construction Dashboard in Excel — the analytical, slicer-driven alternative.
Related Templates
More related walkthroughs on this blog: Concrete Contractor KPI Scorecard in Excel, HVAC Contractor KPI Dashboard in Excel and Drywall Contractor KPI Dashboard in Excel. Each is a separate template with its own layout and sample data.
Frequently Asked Questions
What KPIs does the Concrete Contractor KPI Dashboard in Excel track?
It ships 13: Cubic Yards Placed per Crew-Day, On-Time Pour Completion, Schedule Adherence, 28-Day Compressive Strength Pass Rate, Slump Test Compliance, Surface Defect & Rework Rate, Concrete Waste & Over-Order, Rejected Loads, Gross Margin, Labor Cost per Cubic Yard, Material Cost Variance, TRIR and Crew Utilization.
How long does setup take?
Under 15 minutes for most users. Set the reporting year in cell E3 on KPI Input – Actual, replace the sample MTD and YTD numbers on the three input sheets, and the Concrete Contractor KPI Dashboard in Excel recalculates. No query to refresh, no data model to load, no macro to enable.
Can I add or rename KPIs?
Yes. The Concrete Contractor KPI Dashboard in Excel is wired for 22 KPI rows with 13 filled. Type a new KPI on KPI Definition and it flows to the three input sheets, the scorecard, the trend page and the analysis page without a single formula edit.
Does it score lower-is-better metrics correctly?
Yes. Flag a KPI as LTB and achievement becomes Target ÷ Actual, so beating a waste, rework, cost or incident-rate target scores above 100% and shows a green arrow. Six of the 13 KPIs supplied with the Concrete Contractor KPI Dashboard in Excel are LTB.
Is this an OSHA or safety compliance system?
No. Total Recordable Incident Rate is one monthly KPI you type in. The Concrete Contractor KPI Dashboard in Excel keeps no incident register, generates no OSHA 300 or 300A log and submits nothing to any authority. Use it for management reporting alongside your compliance system, never instead of it.
How does this compare to Procore or Buildertrend?
Those are full construction-management platforms at roughly $99-375 per user per month. The Concrete Contractor KPI Dashboard in Excel is a $12.99 one-time monthly reporting layer — it will not schedule work, cost jobs live or capture field data, but it gives you a board-ready KPI pack you own outright.
What is in the download?
A single ZIP holding the Concrete Contractor KPI Dashboard .xlsx workbook plus the Excel KPI Dashboard user manual PDF. The workbook opens in Excel 2013 and later and in Excel for the web.
About the Author
Built by PK — Microsoft Certified Professional with 15+ years of Excel, Google Sheets and Power BI experience. Founder of NextGenTemplates, reaching 300K+ subscribers across YouTube channels. Every template is hand-built and tested before release.
Conclusion
If your concrete business already collects the numbers and just needs them scored, ranked and put on one page every month, this is a fifteen-minute job rather than a software project. The direction-aware scoring is the part that earns its keep: it stops a falling cost or a falling incident rate from being punished as a miss, which is where most home-built KPI sheets quietly go wrong.
👉 Click here to Purchase the Concrete Contractor KPI Dashboard in Excel
Instant download · One-time payment · No subscription · Lifetime access
For step-by-step Excel tutorials, visit Youtube.com/@PK-AnExcelExpert.
Last updated: September 2026