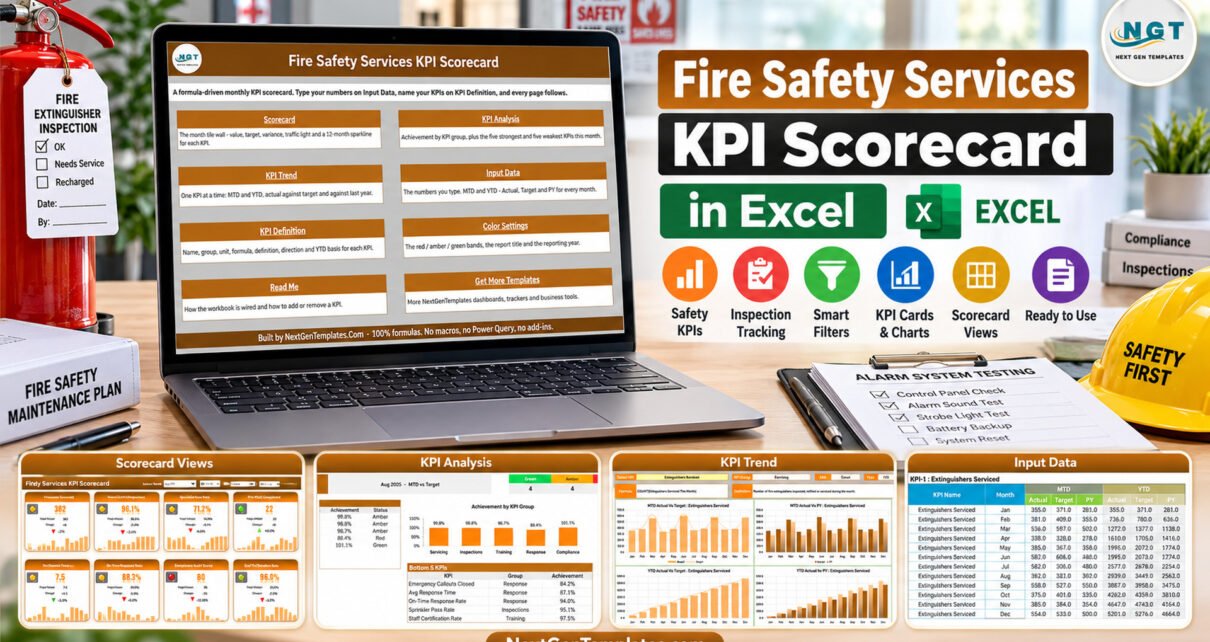
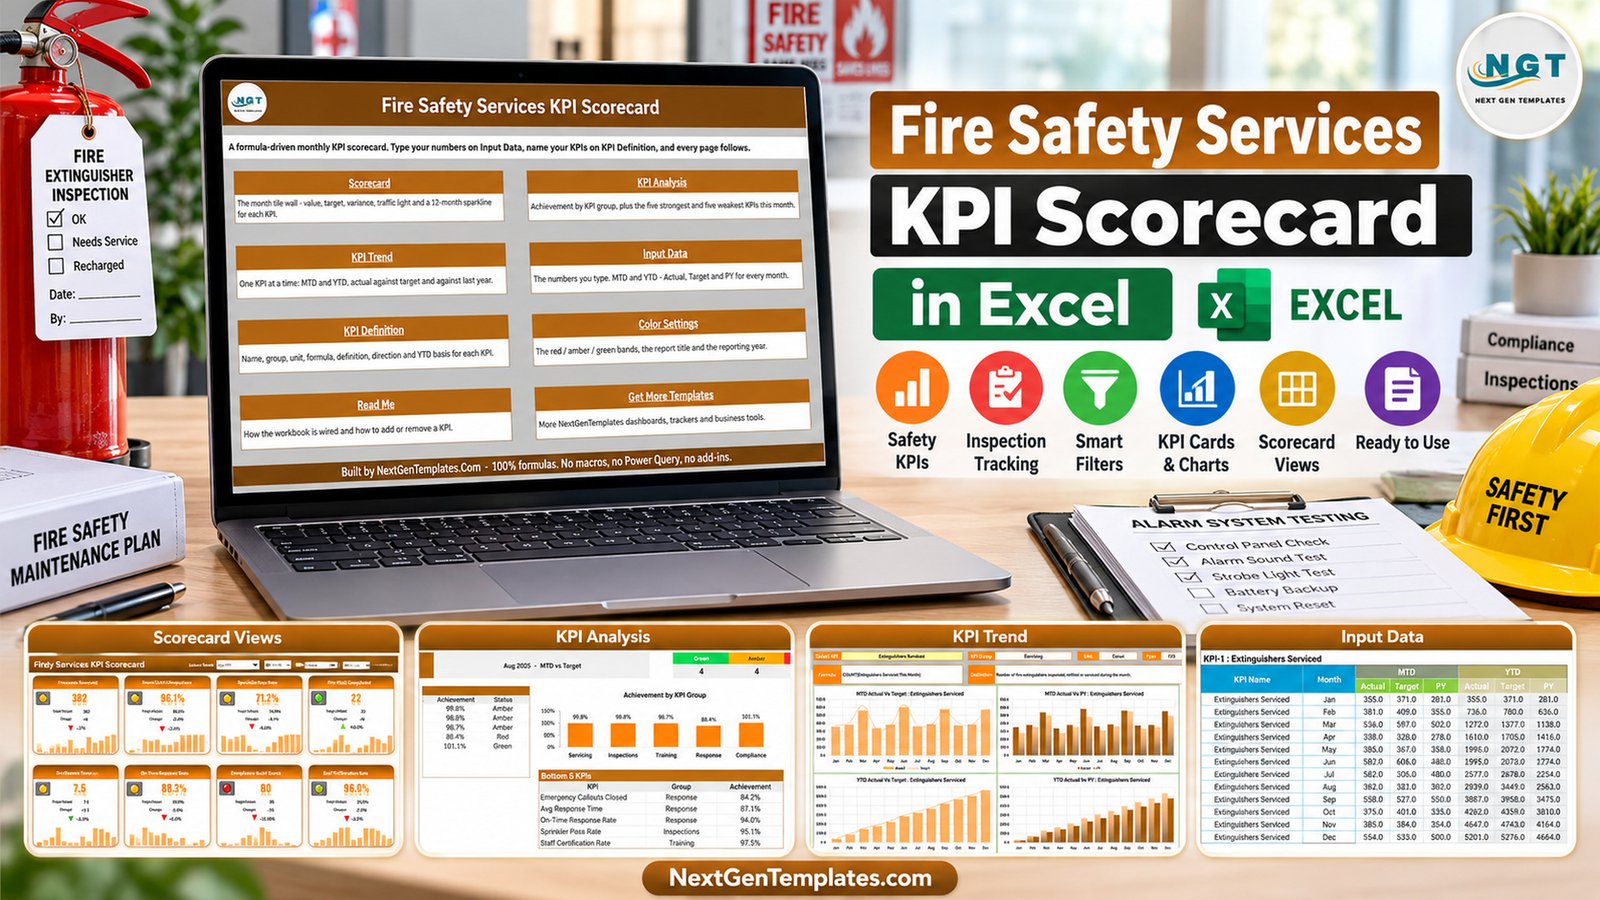
The Fire Safety Services KPI Scorecard in Excel helps teams compare monthly actuals with targets and prior-year values across 10 KPI cards. Its connected analysis and trend pages make a compact management review easier to prepare.
On PK-AnExcelExpert, this guide explains the real workbook, setup flow, and limits.
What This Fire Safety Services KPI Scorecard in Excel Includes
- Monthly scorecard for 10 visible KPIs with actual, target, prior-year, variance, status lights, arrows, and 12-month sparklines.
- MTD and YTD selectors plus Target and Prior Year comparison choices.
- KPI Analysis by group with achievement chart and top-five and bottom-five tables.
- KPI Trend page with four charts for actual versus target and prior year.
- Input Data table for monthly MTD and YTD actual, target, and prior-year values.
- KPI Definition and Color Settings pages for names, groups, units, direction, YTD basis, thresholds, report title, and year.
How to Use the fire safety KPI Excel template
- Open the template and read the included guidance.
- Replace fictional sample values on Input Data.
- Review KPI definitions, units, direction, formulas, and YTD basis.
- Select a reporting month, MTD or YTD, and the comparison basis.
- Review scorecard lights, KPI groups, and trend charts.
- Validate every result against source records before decisions.
Practical KPI Uses
The fire protection service scorecard supports extinguisher servicing, SLA compliance, alarm inspections, sprinkler pass rates, drills, response measures, callout closure, audit scores, and staff certification. The 10 supplied metrics are examples and can be adapted carefully. This is a reporting workbook, not a source inspection, compliance, safety, finance, or project-management system.
The fire inspection KPI dashboard Excel does not collect operational records, certify compliance, perform inspections, predict outcomes, or replace professional judgment. Users supply finished monthly figures and remain responsible for definitions, targets, calculations, and validation.
Why Choose This Scorecard
One structured input area drives the scorecard, analysis, and trend pages. Traffic-light thresholds distinguish upper-the-better and lower-the-better measures. The workbook uses formulas, conditional formatting, camera pictures, and sparklines with no macros, Power Query, or add-ins; the Read Me states compatibility with Excel 2016 onward.
What You Receive
One ZIP containing the editable XLSX workbook and Excel KPI Scorecard user manual.
Important Limitations
Demonstration figures are fictional. Do not treat sample values as benchmarks. The file does not import data automatically, calculate every organization’s correct YTD logic, or guarantee regulatory outcomes. Keep an untouched backup and test changes.
Browse all templates, Excel templates, and NextGenTemplates. See Microsoft Excel support.
Frequently Asked Questions
How many KPIs are displayed?
The supplied scorecard shows 10 KPIs at a time.
Can I edit KPI names?
Yes. Keep names unique and update matching input blocks.
Are macros required?
No. The workbook states that it uses formulas and no macros.
Does it import data?
No. Users enter finished monthly figures.
Can thresholds be changed?
Yes. Review Color Settings and test the results.
Is the sample data authoritative?
No. All sample figures are fictional.
Related Templates
Explore the linked Excel and shop collections for more KPI tools.
Prepared by PK, Founder of NextGenTemplates.
Monthly Review Workflow
Agree on ownership and definitions before entering data. At month end, reconcile actual, target, and prior-year figures with approved sources, then enter finished MTD and YTD values. Review red and amber results with context rather than treating color as a conclusion. Document changes to definitions, targets, and thresholds so later reviewers understand the comparison. Compare group achievement with individual trends, investigate unusual movements, and confirm lower-the-better measures use the correct direction. Save a dated review copy and retain supporting evidence according to organizational policy.
Quality Checks Before Sharing
Confirm the reporting month, MTD or YTD mode, comparison basis, KPI range, year, and title. Spot-check cards against Input Data, verify a trend chart, and ensure every KPI name is unique. Review units, rounding, blank cells, and prior-year comparisons before presenting the monthly result to stakeholders.
Get the KPI Scorecard
Review the screenshots and download the template from the product page.