In today's fast-paced business environment, organizations must deal with constant changes in processes, systems, and workflows. A Change Request Management
In today’s innovation-driven economy, Science & Technology Parks play a crucial role in supporting startups, research institutions, and technology-driven enterprises.
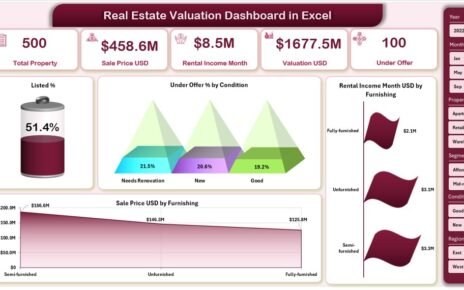
Real estate decisions depend heavily on accurate valuation, clear insights, and timely analysis. However, many real estate professionals still rely