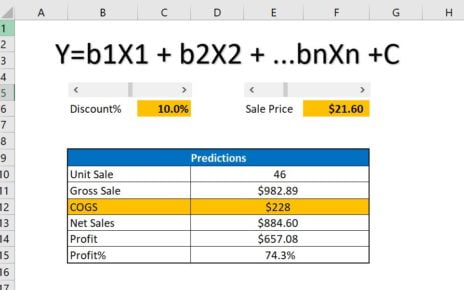
In this article, we have explained how to predict a value using multiple regression Analysis in Microsoft Excel. What is
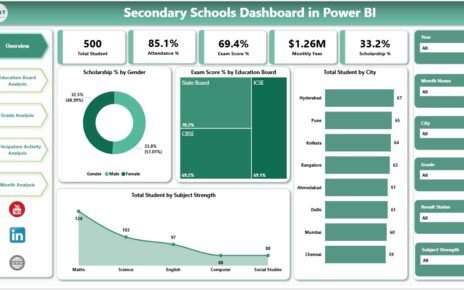
Managing a secondary school today involves much more than academics alone. Schools must track student performance, attendance, scholarships, participation activities,
Managing a Sovereign Wealth Fund (SWF) involves balancing complex financial data, analyzing investment performance, and ensuring long-term returns for future