Home>Blogs>Charts and Visualization>Sales funnel infographic chart in Excel>Sales Funnel infographic Chart -9
Sales Funnel infographic Chart -9
17
Feb 2024
0Comments Off on Sales Funnel infographic Chart -9
PK
Meet PK, the founder of PK-AnExcelExpert.com! With over 15 years of experience in Data Visualization, Excel Automation, and dashboard creation. PK is a Microsoft Certified Professional who has a passion for all things in Excel. PK loves to explore new and innovative ways to use Excel and is always eager to share his knowledge with others. With an eye for detail and a commitment to excellence, PK has become a go-to expert in the world of Excel. Whether you're looking to create stunning visualizations or streamline your workflow with automation, PK has the skills and expertise to help you succeed. Join the many satisfied clients who have benefited from PK's services and see how he can take your Excel skills to the next level!
https://www.pk-anexcelexpert.com
Related Articles
Legal KPI Dashboard in Excel
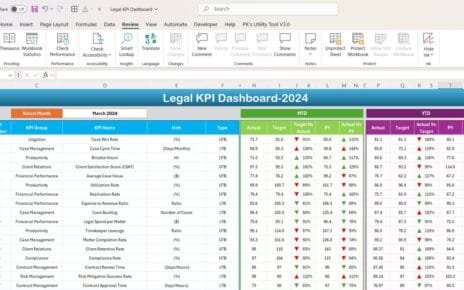
This article will guide you through the process of creating a Legal KPI Dashboard, including essential KPIs to include, how
Procurement Evaluation Checklist in Excel
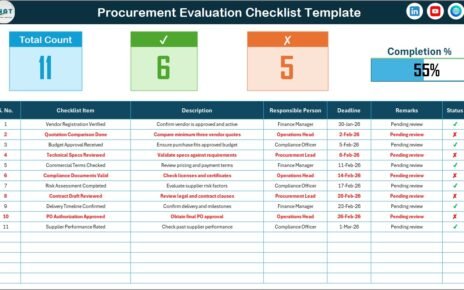
Procurement plays a critical role in every organization. Whether a company purchases raw materials, software licenses, services, or equipment, procurement
Freelance Business KPI Scorecard in Excel
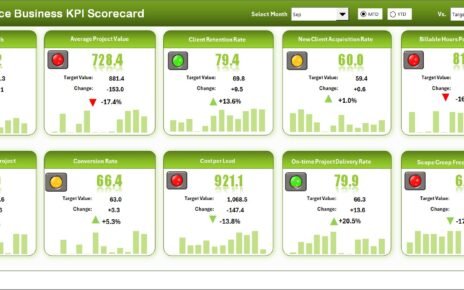
Running a successful freelance business requires more than just completing projects. It demands performance tracking, data-driven decisions, and continuous improvement.


