In the fast-paced world of the cannabis industry, staying ahead means keeping a close eye on performance metrics. The Cannabis
Efficiently managing pest control activities is crucial for maintaining the safety and integrity of both residential and commercial properties. The
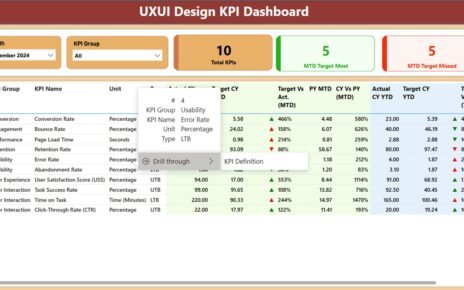
In today’s fast-paced digital world, user experience (UX) and user interface (UI) design play a crucial role in determining the