Energy Trading KPI Dashboard 6
20
Jan 2025
0Comments Off on Energy Trading KPI Dashboard 6
PK
Meet PK, the founder of PK-AnExcelExpert.com! With over 15 years of experience in Data Visualization, Excel Automation, and dashboard creation. PK is a Microsoft Certified Professional who has a passion for all things in Excel. PK loves to explore new and innovative ways to use Excel and is always eager to share his knowledge with others. With an eye for detail and a commitment to excellence, PK has become a go-to expert in the world of Excel. Whether you're looking to create stunning visualizations or streamline your workflow with automation, PK has the skills and expertise to help you succeed. Join the many satisfied clients who have benefited from PK's services and see how he can take your Excel skills to the next level!
https://www.pk-anexcelexpert.com
Related Articles
Productivity Tracker KPI Dashboard in Excel
In today's fast-paced work environment, tracking productivity is crucial for optimizing performance, making informed decisions, and improving efficiency. A Productivity
Multiple KPIs Visualization in Excel
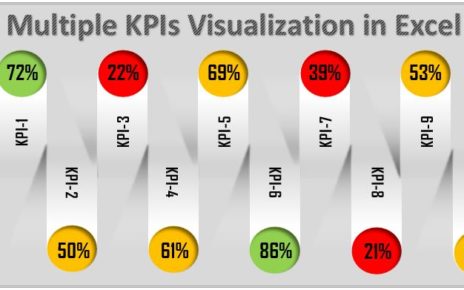
We have created an attractive visualization to display multiple KPI performance in Excel. We have used Excel auto shapes to
Colleges & Universities KPI Dashboard in Excel
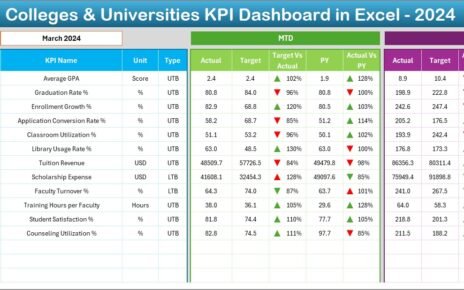
Tracking performance in colleges and universities becomes easier when you use a structured and well-designed KPI dashboard. Every educational institution


