Home>Blogs>Charts and Visualization>Conditional Formatting in a Lollipop Chart in Excel>CF in LP Chart-3
CF in LP Chart-3
23
Feb 2019
204Comments Off on CF in LP Chart-3
PK
Meet PK, the founder of PK-AnExcelExpert.com! With over 15 years of experience in Data Visualization, Excel Automation, and dashboard creation. PK is a Microsoft Certified Professional who has a passion for all things in Excel. PK loves to explore new and innovative ways to use Excel and is always eager to share his knowledge with others. With an eye for detail and a commitment to excellence, PK has become a go-to expert in the world of Excel. Whether you're looking to create stunning visualizations or streamline your workflow with automation, PK has the skills and expertise to help you succeed. Join the many satisfied clients who have benefited from PK's services and see how he can take your Excel skills to the next level!
https://www.pk-anexcelexpert.com
Related Articles
Convenience Stores KPI Dashboard in Power BI
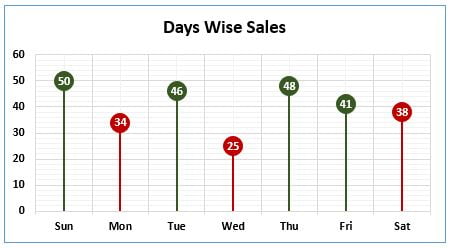
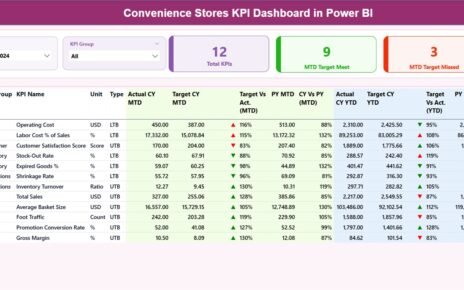
Running a convenience store business requires fast decisions, accurate insights, and complete visibility into daily operations. However, when sales, margins,
Operations Customer Experience Calendar in Excel
Managing customer experience in operations requires timely execution, proper scheduling, and complete visibility over planned activities. One small mistake or
Mobile App Development KPI Dashboard in Power BI
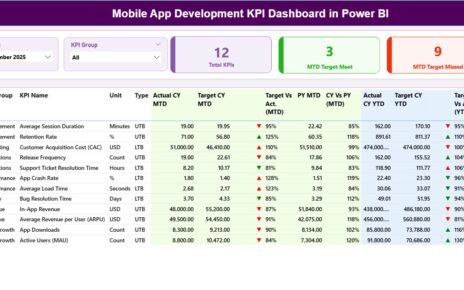
Mobile app development moves fast. New features launch every week. User feedback changes daily. Competition grows every month. Therefore, you


