In today’s fast-paced global economy, managing risks in the supply chain and logistics ecosystem is no longer optional. It is a business necessity. Every company that deals with procurement, transportation, or inventory management needs clear, measurable insights to monitor performance, mitigate disruptions, and drive resilience. This is where a Supply Chain and Logistics Risk Management KPI Dashboard in Excel becomes a game-changer.
This comprehensive article explores everything you need to know about creating and using this powerful Excel-based dashboard. Whether you’re a logistics manager, supply chain analyst, or operations head, this tool can help you make data-driven decisions quickly and effectively.
Click to Purchases Supply Chain and Logistics Risk Management KPI Dashboard in Excel
What is a Supply Chain and Logistics Risk Management KPI Dashboard?
A KPI (Key Performance Indicator) Dashboard for supply chain and logistics risk management is a centralized tool that tracks, visualizes, and analyzes the most critical metrics impacting your supply chain. Built in Excel, this dashboard is a ready-to-use template that simplifies risk monitoring and performance evaluation without requiring complex software.
It includes interactive sheets, drop-down filters, dynamic charts, and formula-based tracking to monitor both short-term (MTD – Month to Date) and long-term (YTD – Year to Date) KPIs.
Key Features of the Dashboard Template
The dashboard includes seven professionally structured worksheets, each designed for a specific purpose:
Home Sheet
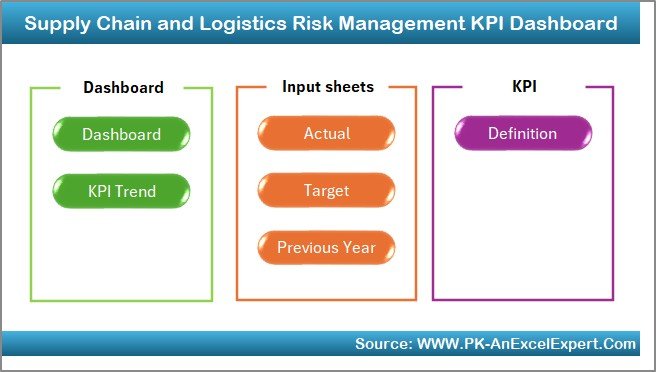
- Acts as an index page
- Contains six navigation buttons to access each sheet directly
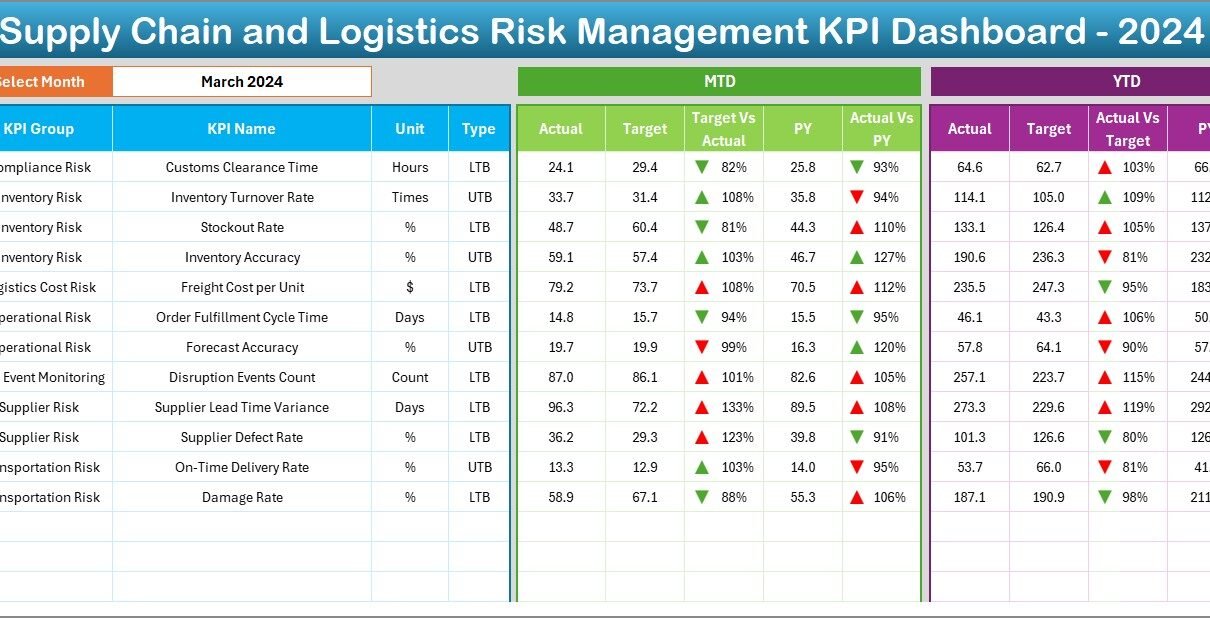
Dashboard Sheet
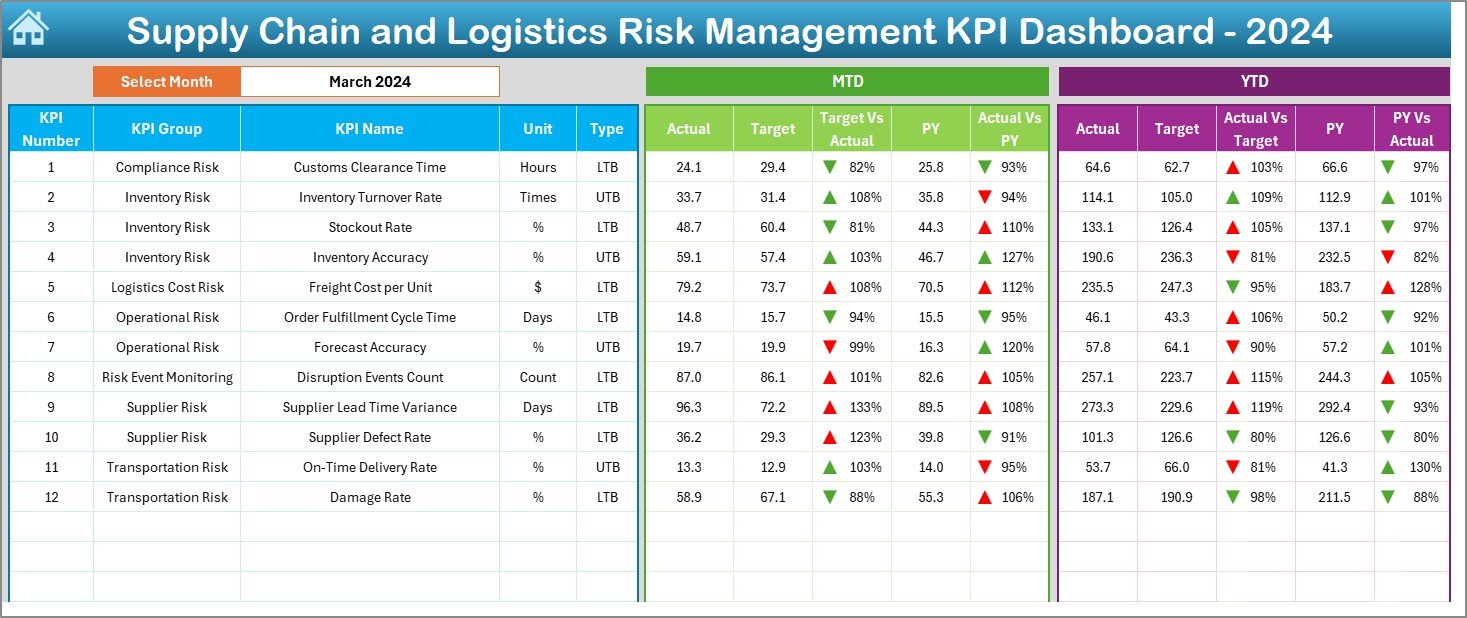
- The main reporting sheet
- Select the month using a drop-down in cell D3
- Automatically updates all KPI visuals and metrics
Displays:
- MTD Actual vs. Target
- MTD Actual vs. Previous Year (PY)
- YTD Actual vs. Target
- YTD Actual vs. PY
- Uses conditional formatting arrows (up/down) for performance indication
KPI Trend Sheet
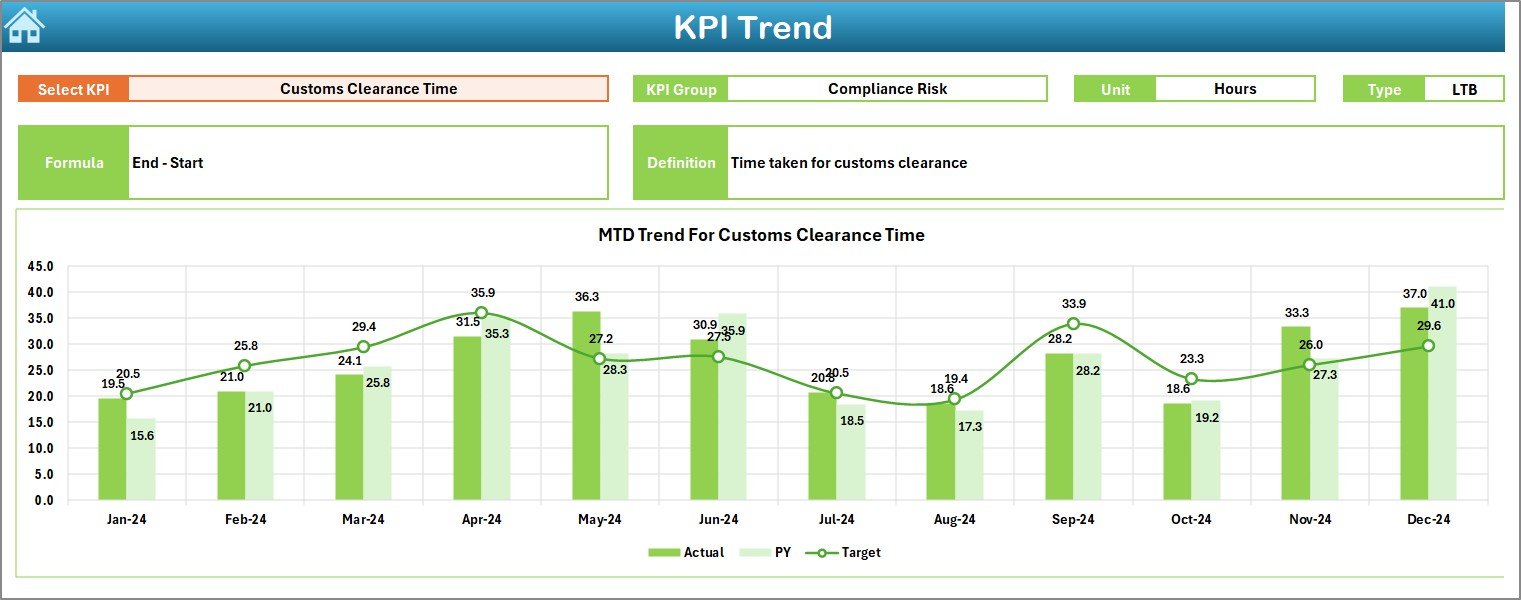
- Choose KPI from drop-down at cell C3
Shows:
- KPI Group
- Unit of Measurement
- KPI Type (LTB or UTB)
- Formula
- Short Definition
Displays MTD and YTD trend charts for:
- Actual
- Target
- Previous Year values
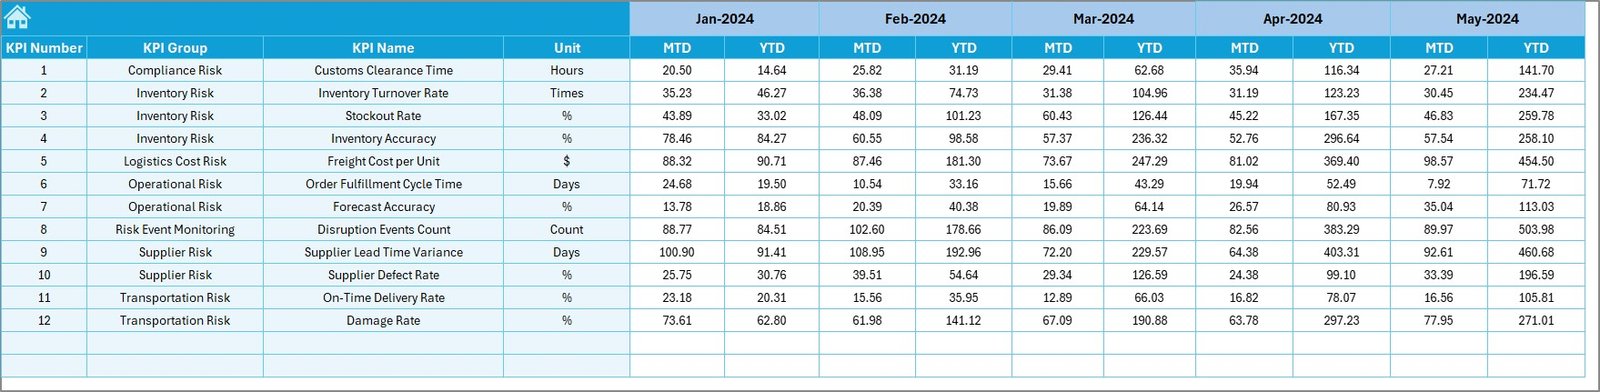
Actual Numbers Input Sheet
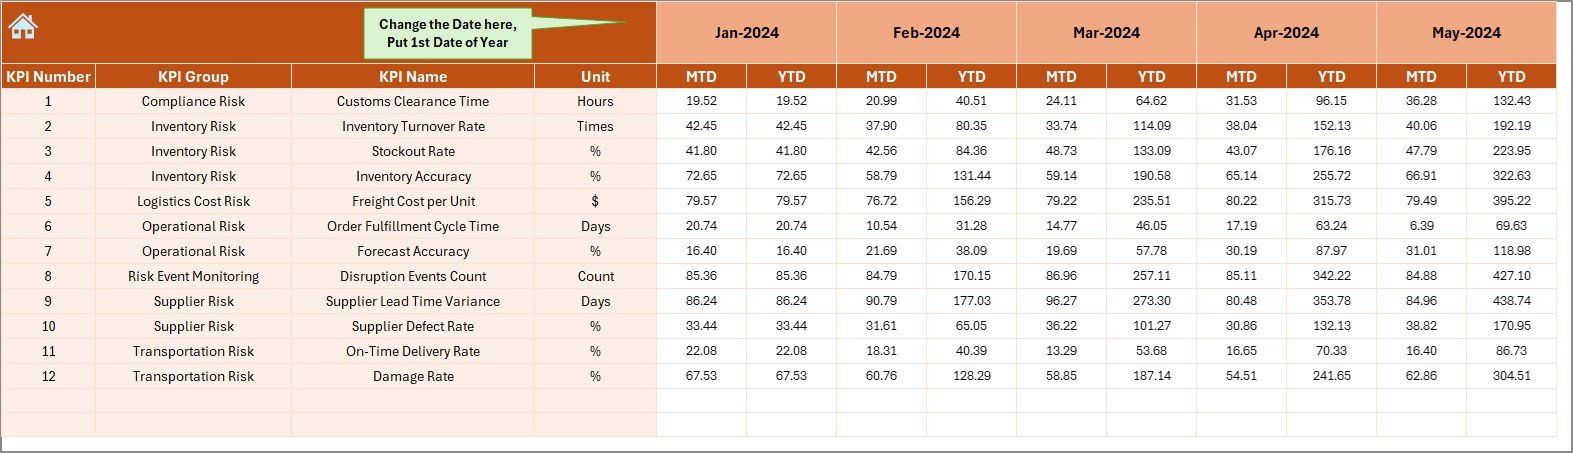
- Input MTD and YTD values for selected months
- Change starting month from cell E1
- Flexible data entry interface
Target Sheet
- Enter target values per KPI
- Required for both MTD and YTD goals
Previous Year Number Sheet
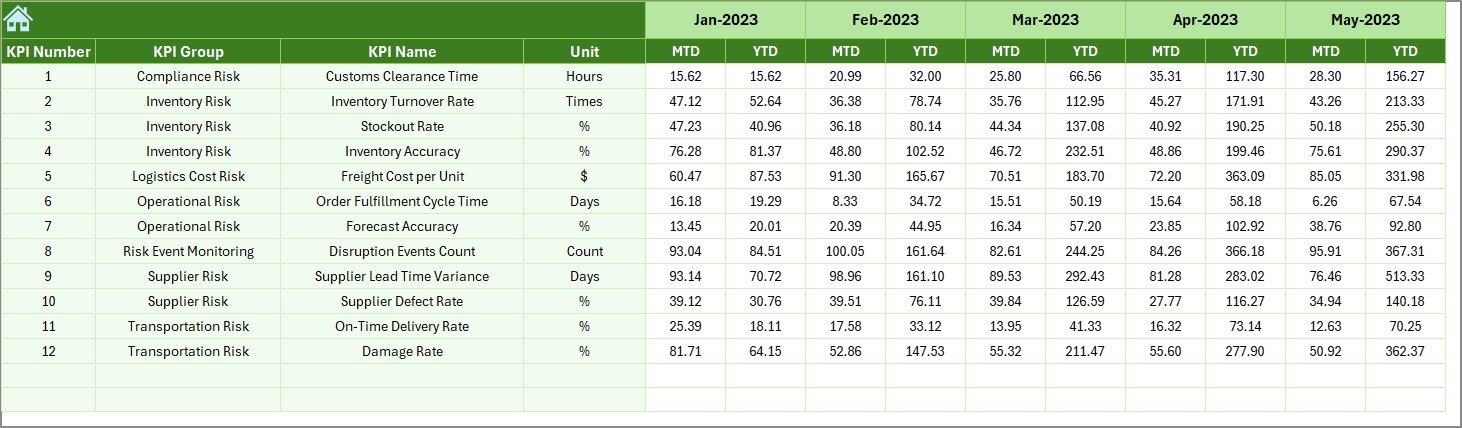
- Input last year’s actuals
- Provides historical comparison for more accurate analysis
Click to Purchases Supply Chain and Logistics Risk Management KPI Dashboard in Excel
KPI Definition Sheet
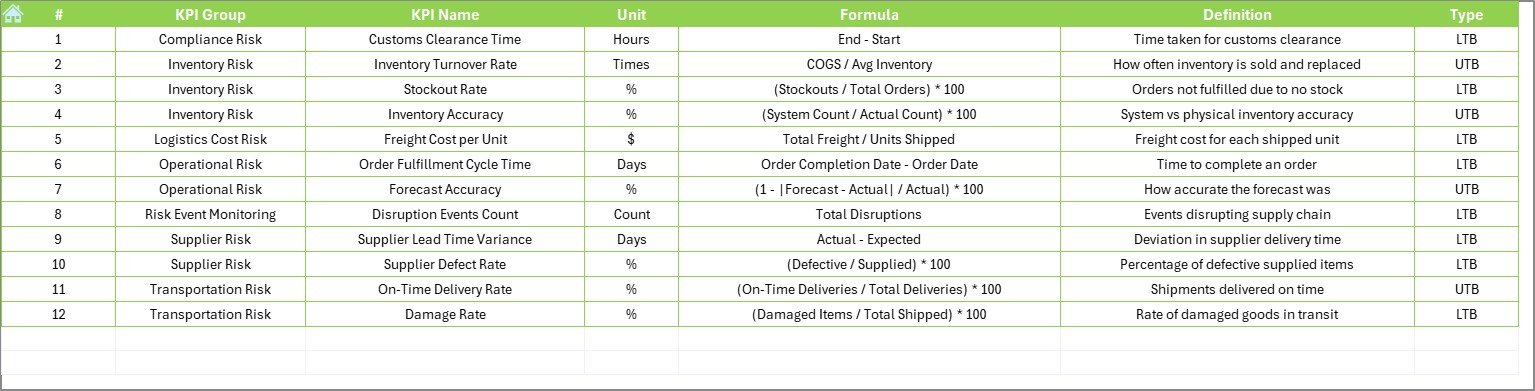
- Master list of all KPIs
Columns include:
- KPI Name
- KPI Group
- Unit
- Formula
- Definition
Why Do You Need This Dashboard?
Managing supply chain risk involves analyzing large volumes of real-time and historical data. This Excel dashboard allows you to:
- Simplify complex datasets
- Spot risk trends quickly
- Compare performance year-over-year
- Set and track realistic targets
- Make informed decisions instantly
With just a few clicks, you can gain a bird’s-eye view of your operational health.
Advantages of Using a Supply Chain & Logistics KPI Dashboard in Excel
🔄 Real-Time Monitoring
See immediate shifts in KPI performance by simply selecting a month. Data updates instantly across charts and comparisons.
🌐 Accessible Anywhere
No need for expensive software. Excel is available on most devices and easy to use for all skill levels.
⚖️ Data-Driven Decisions
Helps you balance cost, quality, and delivery risks using quantifiable metrics.
✅ User-Friendly Interface
The dashboard’s design includes dropdowns, slicers, and auto-updating visuals to minimize manual work.
⚙️ Fully Customizable
You can easily add or remove KPIs, modify definitions, or change formulas to suit your organization’s specific needs.
Best Practices for Supply Chain Risk KPI Tracking
To ensure your dashboard delivers maximum value, follow these best practices:
1. Define KPIs Clearly
- Keep definitions short and meaningful
- Avoid vague or overlapping metrics
2. Classify KPIs by Risk Category
- Group your KPIs under categories such as Inventory Risk, Supplier Risk, Delivery Risk, and Cost Risk
3. Use Both MTD and YTD Metrics
- MTD helps you focus on short-term performance
- YTD provides a long-term view for strategic planning
4. Highlight Critical KPIs
- Use conditional formatting for underperforming metrics
- Focus decision-making efforts where risk is highest
5. Review Regularly
- Update actuals monthly
- Revisit target values quarterly to align with business changes
How to Use the Excel Template Efficiently?
Step 1: Setup Your Months
In the Actual Numbers Input Sheet, enter the start month in cell E1.
Step 2: Fill in Data
Input MTD and YTD values in actual, target, and previous year sheets.
Step 3: Review Dashboard
Go to the Dashboard Sheet and select the month from D3 to view updated metrics.
Step 4: Analyze Trends
Switch to the KPI Trend Sheet and choose a KPI to view its historical trend.
Step 5: Adjust if Needed
Update target numbers, revise definitions, or add new KPIs as needed from the KPI Definition Sheet.
Conclusion
A well-designed Supply Chain and Logistics Risk Management KPI Dashboard in Excel puts you in control. With a clear view of both current and historical performance, you can proactively respond to challenges, minimize disruptions, and enhance efficiency. Since it’s built in Excel, it’s flexible, familiar, and highly customizable for any industry or organization size.
Frequently Asked Questions (FAQs)
1. Can I customize the KPIs in the dashboard?
Yes! You can add, remove, or modify KPIs through the KPI Definition Sheet.
2. Do I need advanced Excel knowledge to use it?
No. The dashboard uses basic Excel features like drop-downs, conditional formatting, and formulas. Anyone with intermediate Excel skills can manage it.
3. Can I use this dashboard for other industries?
Absolutely. While it’s designed for supply chain and logistics, you can adapt it to manufacturing, retail, or any other operations-based field.
4. Is this dashboard mobile-friendly?
You can open it in Excel Mobile, but the best experience is on a desktop or laptop for full functionality.
5. How often should I update the data?
Monthly updates are ideal. However, you can update it more frequently based on your business needs.
Click to Purchases Supply Chain and Logistics Risk Management KPI Dashboard in Excel
Visit our YouTube channel to learn step-by-step video tutorials