In today’s digital era, education systems are shifting rapidly towards e-learning platforms. With this transformation, it’s more important than ever to track and analyze performance effectively. That’s where the Digital Learning KPI Dashboard in Power BI comes into play. This dashboard offers a comprehensive view of key learning metrics, empowering educators, administrators, and decision-makers to monitor progress, meet targets, and improve learning outcomes in real-time.
Click to Purchases Digital Learning KPI Dashboard in Power BI
What is a Digital Learning KPI Dashboard?
A Digital Learning KPI Dashboard is an interactive visual interface built using Power BI that displays key performance indicators (KPIs) related to online learning. It collects, organizes, and visualizes data such as course completion rates, student engagement, learning milestones, and more. With real-time insights and historical comparisons, users can make informed decisions to improve the quality and effectiveness of digital learning initiatives.
Key Features of the Digital Learning KPI Dashboard in Power BI
This ready-to-use Power BI dashboard connects directly to an Excel-based data source and includes three primary pages:
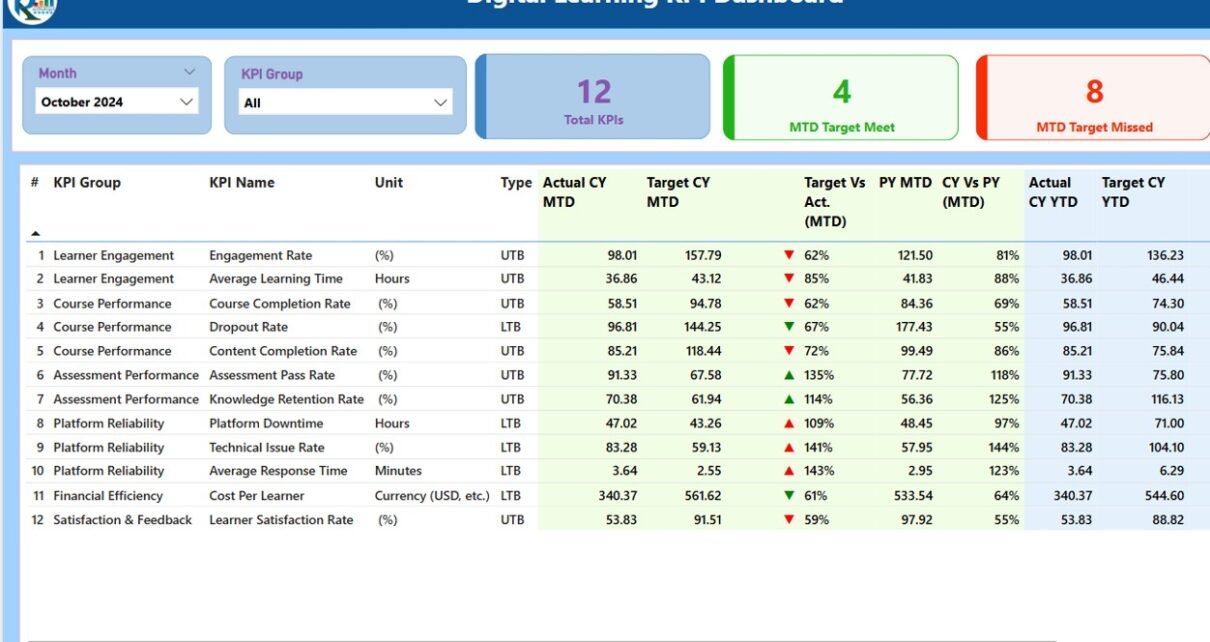
Summary Page
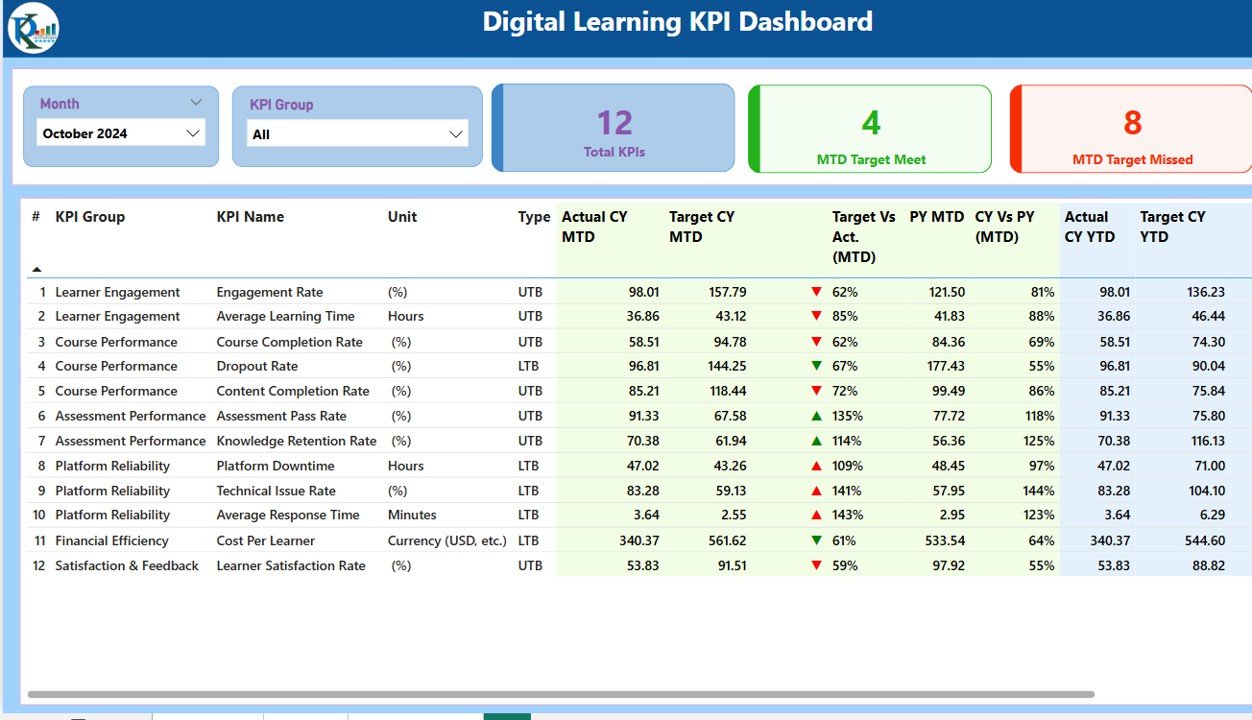
The summary page acts as the central hub of the dashboard. It includes:
- Month and KPI Group Slicers: Filter data dynamically by month or category.
KPI Cards:
- Total KPIs Count
- MTD (Month-to-Date) Target Met
- MTD Target Missed
Detailed KPI Table:
- KPI Number
- KPI Group
- KPI Name
- Unit (e.g., % or count)
- Type (UTB – Upper the Better / LTB – Lower the Better)
- Actual CY MTD and Target CY MTD
- MTD Icon (Green ▲ or Red ▼)
- Target vs. Actual (MTD) in %
- PY MTD (Previous Year)
- CY vs. PY MTD Comparison
- Actual CY YTD and Target CY YTD
- YTD Icon
- Target vs. Actual (YTD) in %
- PY YTD
- CY vs. PY YTD Comparison
This page gives a bird’s-eye view of organizational performance in digital learning initiatives.
KPI Trend Page
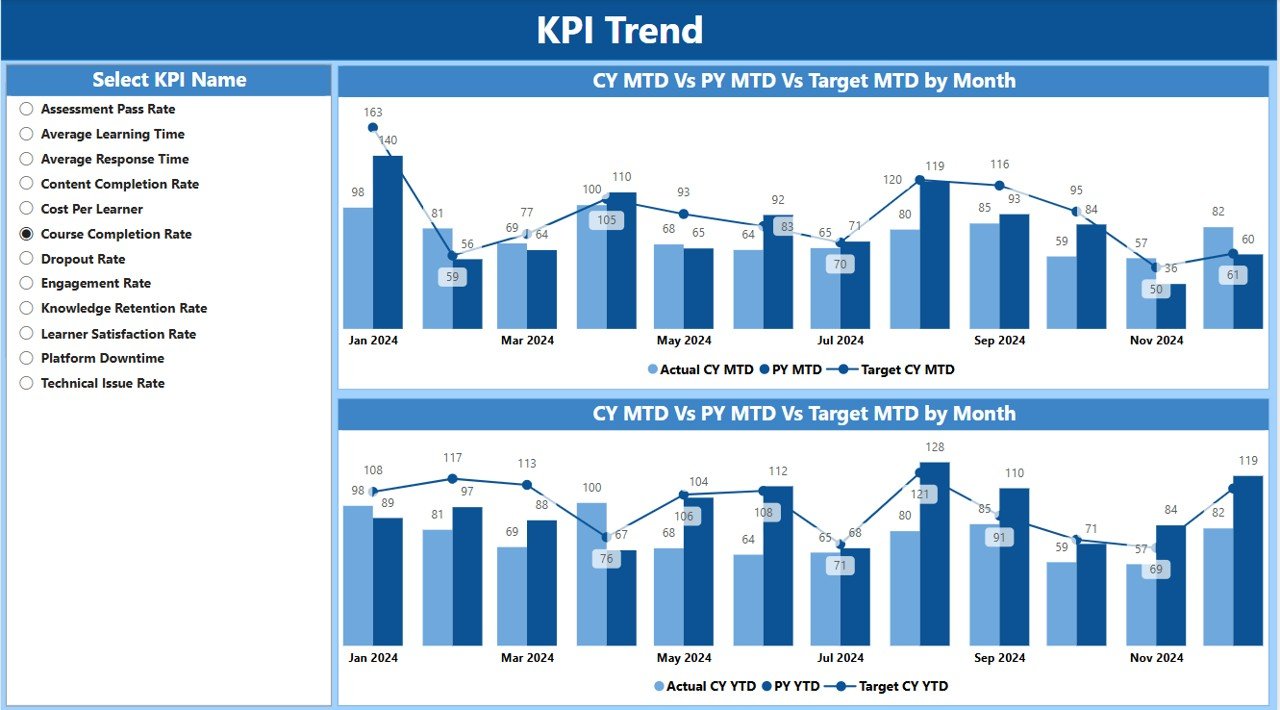
On this page, two combo charts visualize the performance:
- MTD Trend Chart: Displays Current Year Actual, Previous Year, and Target values.
- YTD Trend Chart: Offers a year-to-date performance snapshot.
A slicer lets users choose specific KPIs to dive deeper into the trends.
Click to Purchases Digital Learning KPI Dashboard in Power BI
KPI Definition Page
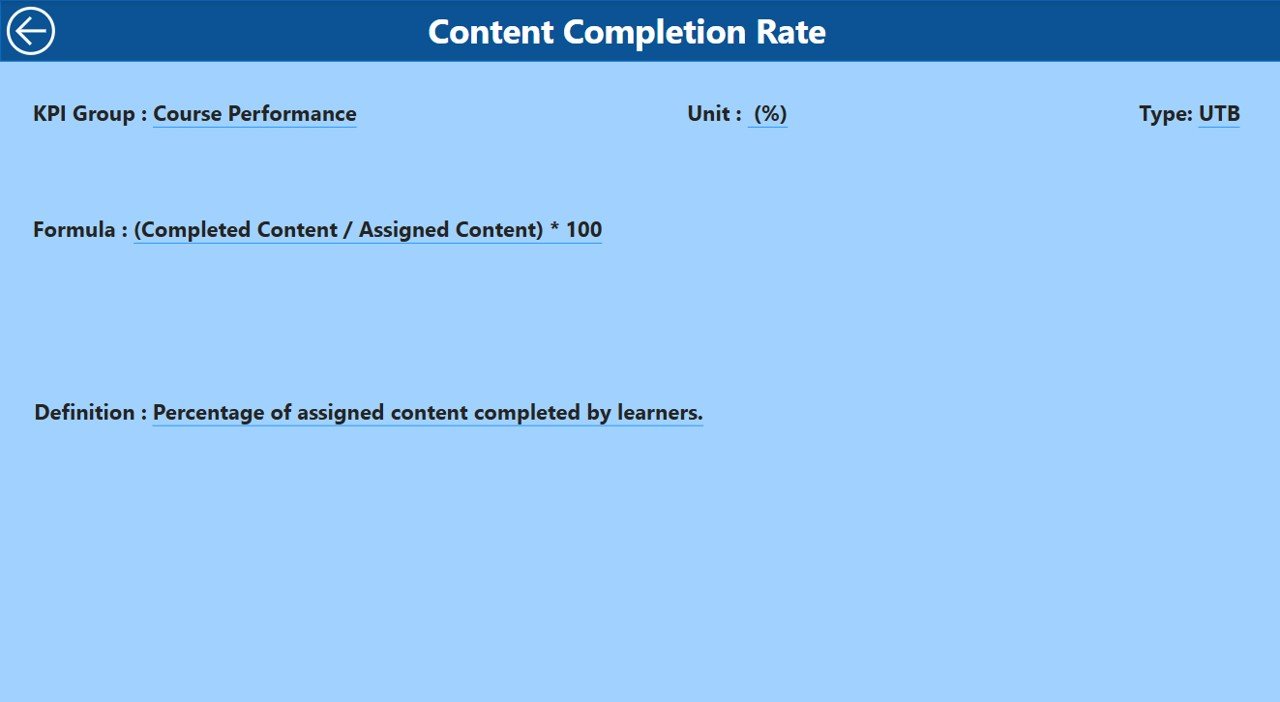
Although hidden by default, this drill-through page helps users access detailed KPI information such as:
- KPI Number
- KPI Name
- KPI Formula
- Definition
- Unit
- Type (LTB or UTB)
You can return to the summary page using the back button on the top-left corner.
Excel Data Source Structure
This dashboard is powered by a structured Excel file with three important worksheets:
Input Actual Sheet
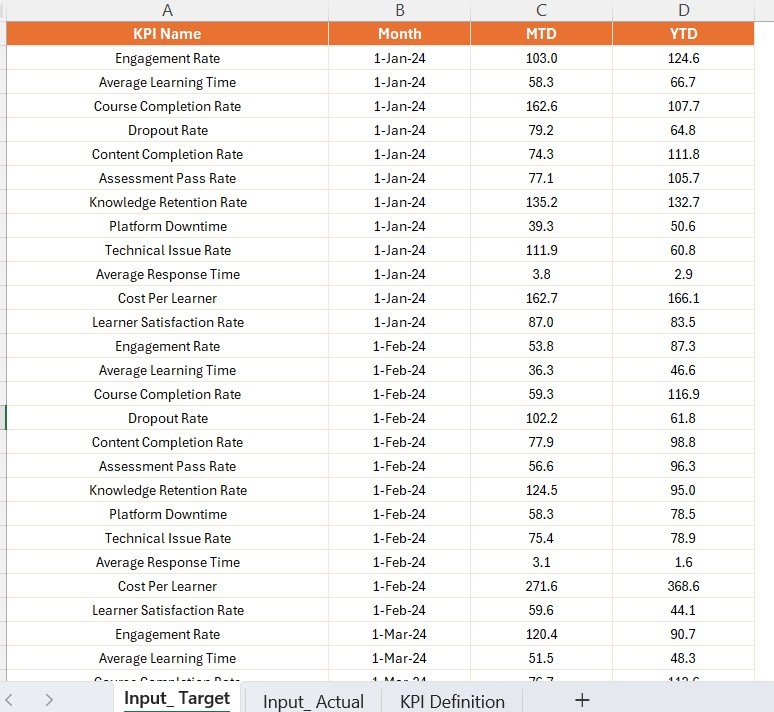
- Fill in the actual KPI numbers.
- Columns include KPI Name, Month (first date of the month), MTD, and YTD values.
Input Target Sheet
- Fill in the target KPI numbers.
- Same structure as the actual sheet: KPI Name, Month, MTD, and YTD values.
KPI Definition Sheet
- Define all KPIs with fields like:
- KPI Number
- KPI Group
- KPI Name
- Unit
- Formula
- Description
- Type (LTB/UTB)
Advantages of Using the Digital Learning KPI Dashboard
📊 Real-Time Monitoring
Track learning performance as it happens with automated data updates.
👥 Enhanced Decision-Making
Get a 360-degree view of KPIs to make faster and smarter decisions.
👁🗨 Visibility into Goals
Compare actuals with targets and quickly spot performance gaps.
📊 Historical Comparisons
Evaluate performance against previous periods for better forecasting.
🔄 Drill-Down Analysis
Understand what’s working and what needs improvement at the most granular level.
Click to Purchases Digital Learning KPI Dashboard in Power BI
Best Practices for Using the Dashboard
1. Update Data Regularly
Maintain the accuracy of insights by updating actuals and targets monthly.
2. Define Clear KPIs
Ensure each KPI is measurable, clearly defined, and aligned with learning objectives.
3. Engage Stakeholders
Share dashboard insights with educators, management, and learners to create accountability.
4. Use Consistent Units
Standardize measurement units across KPIs to avoid confusion.
5. Simplify Visuals
Avoid clutter. Use icons and color codes to highlight key trends.
6. Review Performance Frequently
Schedule monthly or quarterly review meetings to analyze progress.
How Does the Dashboard Help Educators and Managers?
- For Educators: See how students are progressing and identify who needs more support.
- For Managers: Review organizational goals, performance trends, and training effectiveness.
- For Learners: Indirectly benefits them by helping create focused and impactful learning paths.
Conclusion
In a world where online learning is becoming the norm, the Digital Learning KPI Dashboard in Power BI offers an efficient, visually engaging, and highly informative way to monitor educational performance. Whether you’re managing a corporate training program or running an academic institution, this dashboard helps you stay on top of every critical metric that drives success.
Use this tool not just for reporting, but for transforming your learning strategy with data-backed decisions.
Frequently Asked Questions (FAQs)
Q1: What does UTB and LTB mean?
UTB stands for “Upper The Better,” meaning higher values are better. LTB stands for “Lower The Better,” where lower values indicate improved performance.
Q2: Can I customize the KPIs in the dashboard?
Yes, you can easily add or modify KPIs by updating the Excel data source and KPI definition sheet.
Q3: Is Power BI required to use this dashboard?
Yes, you need Microsoft Power BI Desktop (free version is available) to view and interact with the dashboard.
Q4: How frequently should I update the dashboard?
We recommend updating KPI data monthly to maintain accurate and actionable insights.
Q5: Can I share this dashboard with my team?
Absolutely! You can publish it to Power BI Service and share it securely with your team or organization.
Click to Purchases Digital Learning KPI Dashboard in Power BI
Visit our YouTube channel to learn step-by-step video tutorials