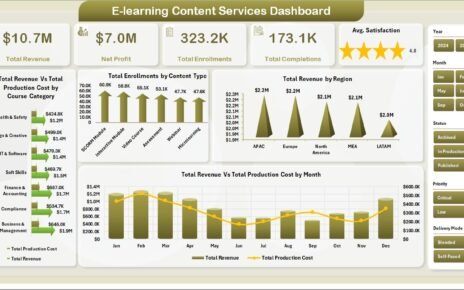
In today’s digital landscape, managing documents effectively is more than a basic necessity—it’s a strategic function. That’s why organizations are now relying on powerful visual tools like the Document Management KPI Dashboard in Power BI to track performance, ensure compliance, and improve document workflows.
This article dives deep into what makes this dashboard so effective, how it works, the key features, and the best practices you should follow to make the most out of it.
Click to Purchases Document Management KPI Dashboard in Power BI
What Is a Document Management KPI Dashboard?
A Document Management KPI Dashboard is a visual reporting tool designed to track, analyze, and improve document-related processes using Key Performance Indicators (KPIs). Built in Power BI, this dashboard connects to an Excel data source and allows users to view month-wise and year-to-date (YTD) performance, track targets, and identify gaps in real-time.
Key Features of the Power BI Dashboard
The Document Management KPI Dashboard in Power BI comes with three main interactive pages:
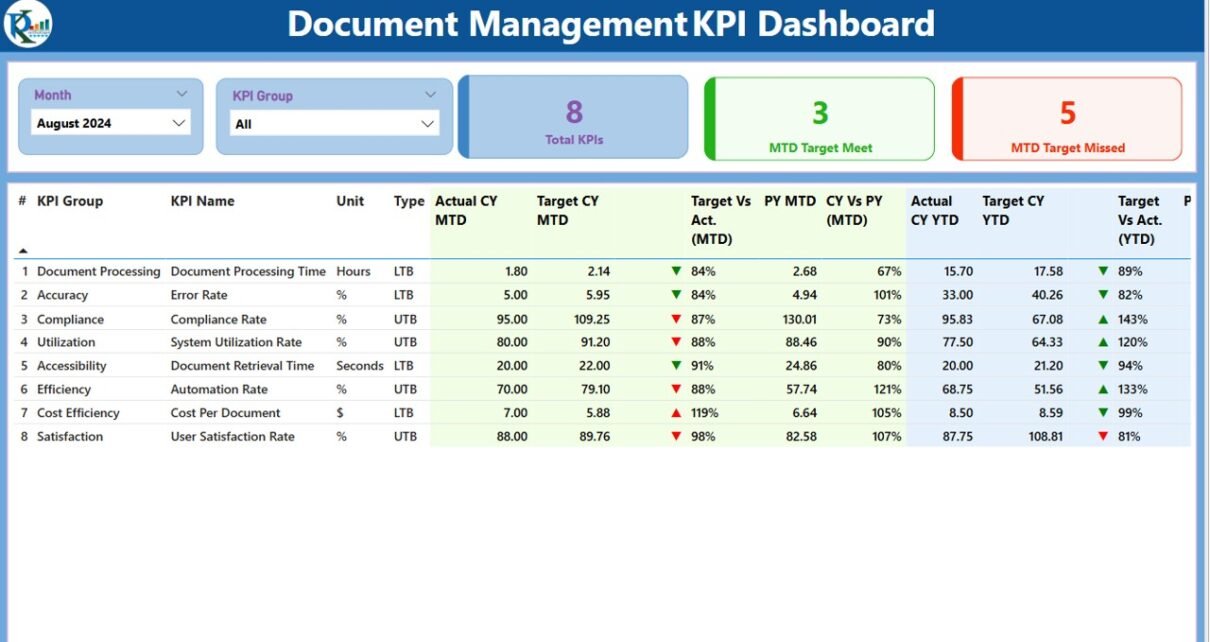
Summary Page
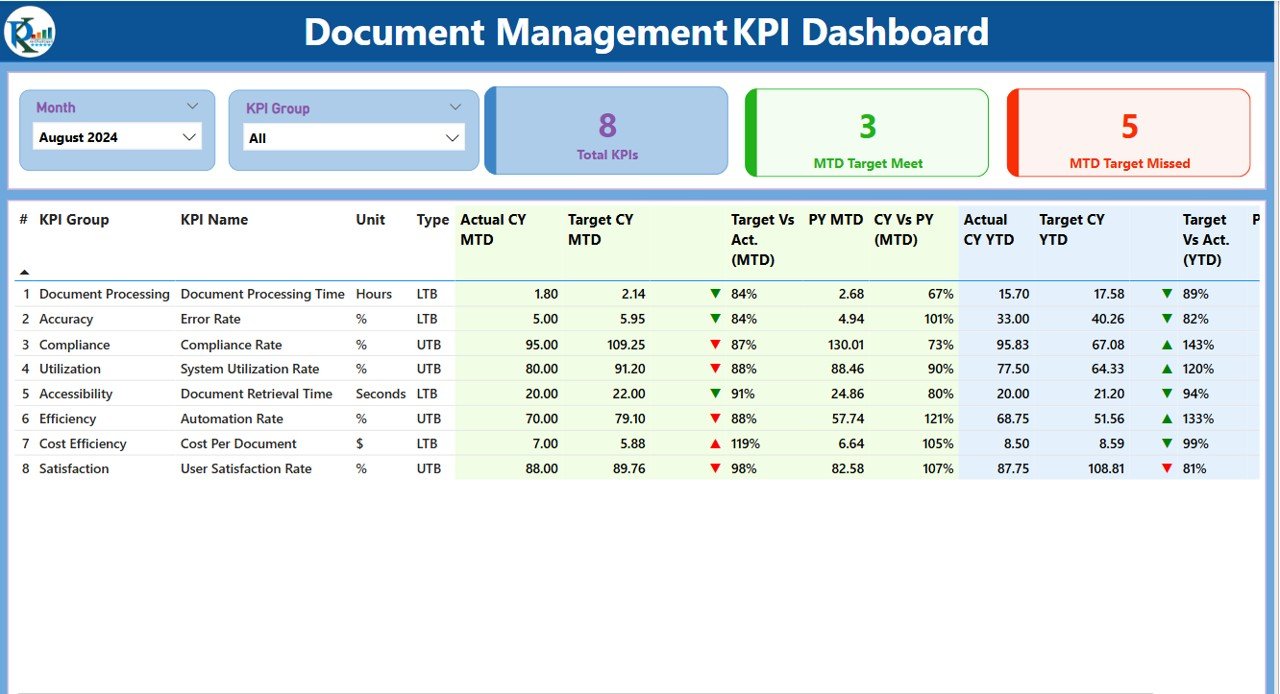
This is the central hub of your dashboard, giving a snapshot of how well your document management KPIs are performing.
Top Section Includes:
- Month and KPI Group Slicers: Easily filter data by month or KPI category.
KPI Cards:
- Total KPIs
- MTD Target Met Count
- MTD Target Missed Count
Detailed KPI Table Columns:
- KPI Number
- KPI Group
- KPI Name
- Unit of Measurement
- KPI Type: LTB (Lower the Better) or UTB (Upper the Better)
- Actual CY MTD
- Target CY MTD
- MTD Status Icon: Green ▲ for met targets, Red ▼ for missed
- Target vs Actual (MTD)
- PY MTD (Previous Year)
- CY vs PY (MTD)
- Actual CY YTD
- Target CY YTD
- YTD Status Icon
- Target vs Actual (YTD)
- PY YTD
- CY vs PY (YTD)
Click to Purchases Document Management KPI Dashboard in Power BI
KPI Trend Page
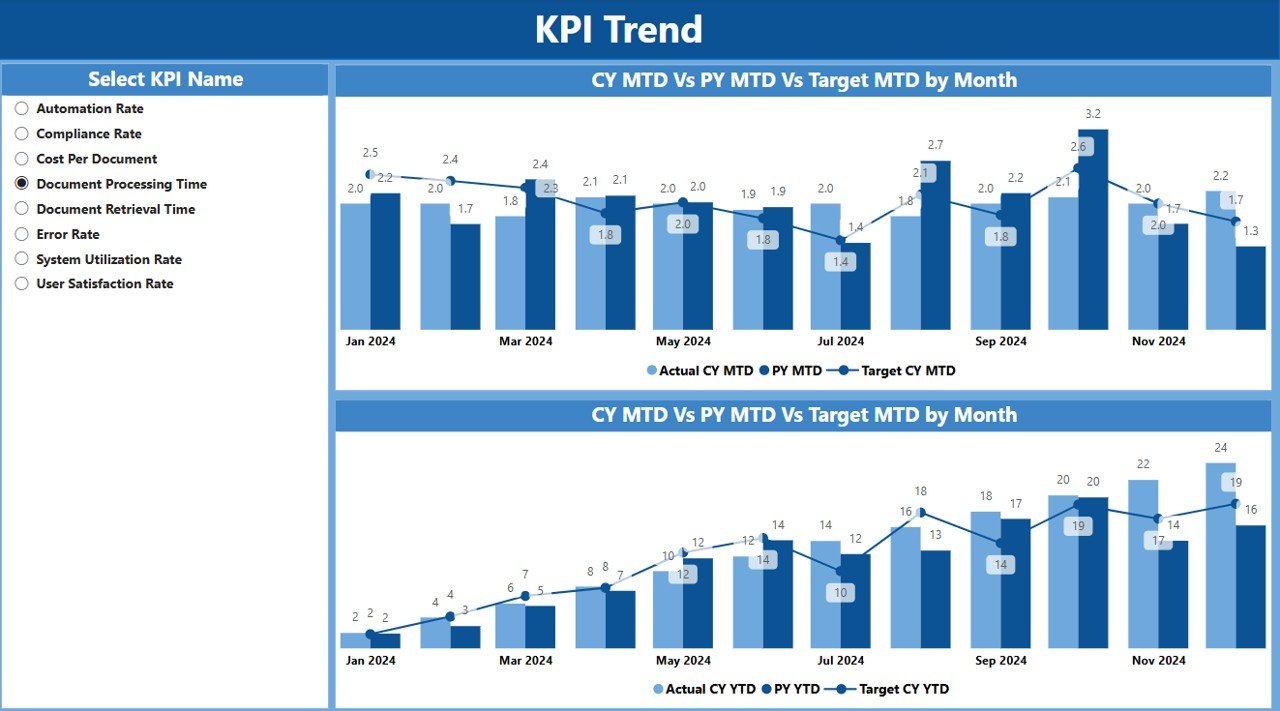
This page enables a deeper dive into performance over time with combo charts for both:
- MTD Trends: Compare Actual vs Target vs Previous Year
- YTD Trends: View progress across multiple months
Users can select individual KPIs via a slicer to examine trends in detail.
KPI Definition Page
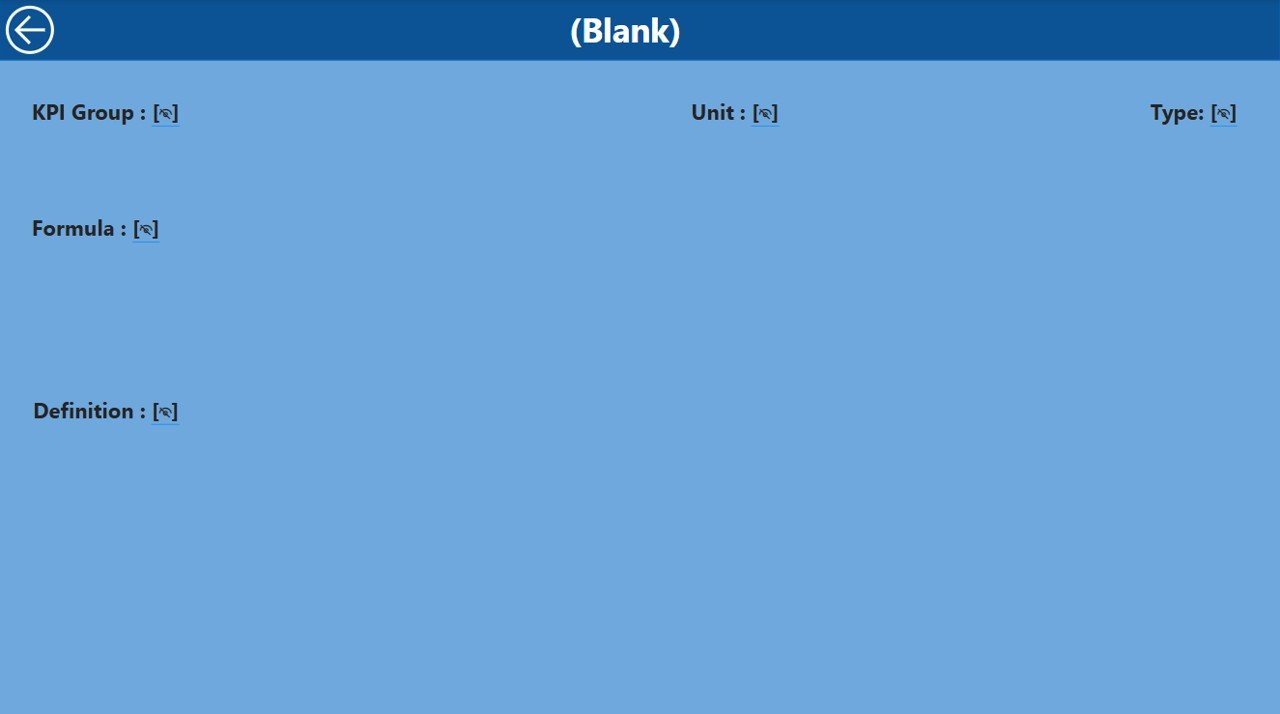
This is a hidden drill-through page linked to the Summary page. Clicking on a KPI allows users to view:
- KPI Formula
- KPI Definition
- Type (LTB/UTB)
To return, simply click the Back button in the top-left corner.
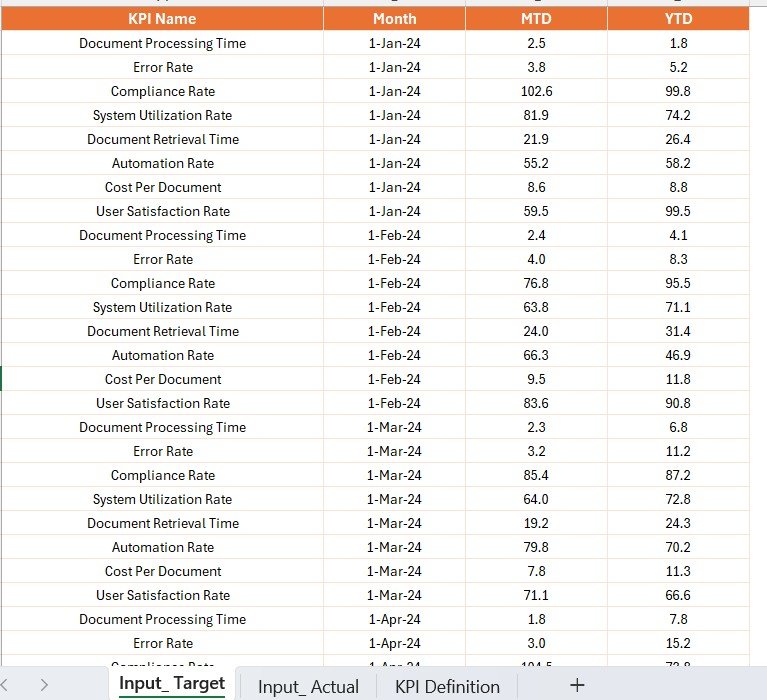
How Does the Excel Data Source Work?
This Power BI dashboard uses a structured Excel workbook with three key worksheets:
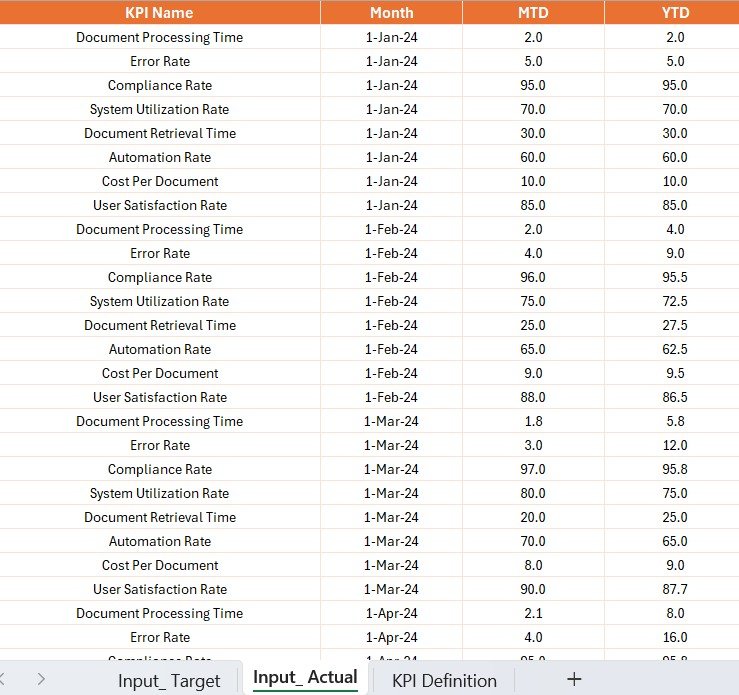
1. Input_Actual Sheet
Capture actual performance numbers for each KPI:
- KPI Name
- Month (use the 1st of each month)
- MTD Actual
- YTD Actual
2. Input_Target Sheet
Track monthly and yearly target numbers:
- KPI Name
- Month (use the 1st of each month)
- MTD Target
- YTD Target
Click to Purchases Document Management KPI Dashboard in Power BI
3. KPI_Definition Sheet
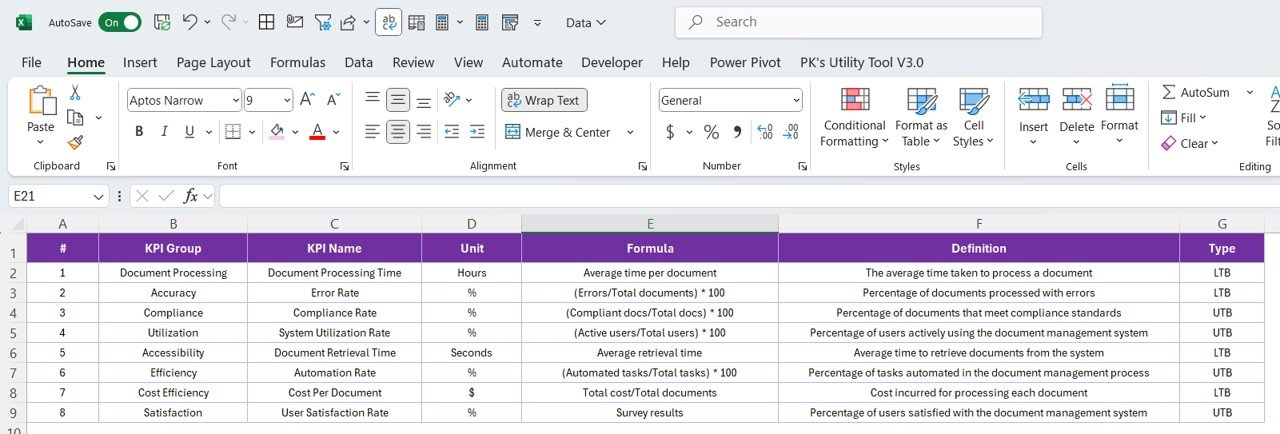
Define each KPI clearly:
- KPI Number
- KPI Group
- KPI Name
- Unit
- Formula
- Definition
- Type (LTB or UTB)
This modular Excel design allows for simple data entry, making it ideal for non-technical users as well.
Why You Need a Document Management KPI Dashboard
Document Management is critical for operational efficiency, especially in industries like healthcare, manufacturing, legal, and education. This dashboard offers a powerful way to:
- Track document processing times
- Monitor compliance
- Identify bottlenecks
- Benchmark performance
- Drive accountability across teams
Advantages of Using a Document Management KPI Dashboard
📊 Real-Time Insights
You get live updates on performance against monthly and yearly targets, helping you act fast.
✅ Improved Decision-Making
Visual data makes it easier for stakeholders to understand what’s working and what’s not.
🔢 Enhanced Accuracy
Using a structured Excel source reduces manual errors and ensures consistency.
📊 Trend Analysis
Compare current performance with previous years to spot patterns and adjust your strategy accordingly.
🔄 Better Accountability
Drill-through features help team leads track performance at a granular level.
Best Practices for Using the Document Management KPI Dashboard
1. Keep Your Excel Data Clean
Always use proper formatting. Stick to the date format for the Month column and double-check for duplicate entries.
2. Update Data Monthly
Schedule time each month to input new actual and target numbers in Excel.
3. Use Consistent KPI Definitions
Ensure that the KPI formulas and definitions do not change frequently. This helps in long-term analysis.
4. Train Team Members
Make sure all stakeholders understand how to navigate and use the dashboard. Simple training sessions go a long way.
5. Leverage Drill-Through Smartly
Use the KPI Definition page to explain unusual trends or performance spikes.
How to Customize the Dashboard for Your Organization
You can tailor this Power BI dashboard to fit your organization’s needs:
- Add new KPI Groups (like Compliance, Operations, Archiving)
- Modify Units of Measurement to suit your data type (e.g., Hours, Days, Count)
- Create Additional Visuals for specific department reports
- Integrate with SharePoint or other document storage systems
Who Should Use This Dashboard?
This dashboard benefits multiple teams:
- Compliance Officers – Track adherence to document control policies
- Operations Managers – Identify delays in document processing
- IT Teams – Monitor digital file management systems
- Executives – Quickly assess high-level KPIs during reviews
Conclusion
The Document Management KPI Dashboard in Power BI is more than a reporting tool. It’s a decision-making assistant. With real-time data, visual performance indicators, and drill-down capabilities, your team can move from reactive problem-solving to proactive strategy execution.
When used correctly, it enhances document workflow transparency, improves operational efficiency, and ensures that your document control systems meet organizational standards.
Frequently Asked Questions (FAQs)
1. Can I connect this dashboard to a live SharePoint folder?
Yes, you can connect Power BI to a live SharePoint folder or OneDrive, allowing real-time updates.
2. Is it possible to automate data refresh in Power BI?
Absolutely! You can schedule refreshes daily, weekly, or monthly using Power BI Service.
3. What types of KPIs can I track with this dashboard?
You can track KPIs like document turnaround time, approval rate, error rate, compliance rate, etc.
4. How can I handle different time zones in the dashboard?
Ensure your source Excel file uses a uniform timezone. You can convert and display the local timezone in Power BI using DAX.
Click to Purchases Document Management KPI Dashboard in Power BI
Visit our YouTube channel to learn step-by-step video tutorials