In today’s fast-paced retail and e-commerce landscape, businesses must monitor performance continually to maintain a competitive edge. Consequently, leaders increasingly rely on Retail and E-commerce Service Delivery KPI Dashboards in Excel to visualize critical metrics, identify trends, and drive data-backed decisions. In this article, you’ll learn how this ready-to-use template empowers your team, explore its key features, understand its advantages, and discover best practices to maximize its value. Finally, you’ll find answers to the most frequently asked questions to help you get started immediately.
Click to Purchases Retail and E-commerce Service Delivery KPI Dashboard in Excel
What Is a Retail and E-commerce Service Delivery KPI Dashboard?
A Retail and E-commerce Service Delivery KPI Dashboard is an Excel-based, interactive template that consolidates key performance indicators (KPIs) into a single, easy-to-navigate interface. It lets you:
-
Track month-to-date (MTD) and year-to-date (YTD) metrics
-
Compare actual performance against targets and previous year (PY) benchmarks
-
Analyze trends over time for each KPI
-
Drill down into detailed data inputs and definitions
Moreover, this dashboard offers an intuitive way for stakeholders—from operations managers to C-suite executives—to stay informed, align on goals, and take swift corrective actions whenever metrics diverge from targets.
Key Features of the Dashboard
This template comprises seven interconnected worksheets, each serving a distinct purpose. Therefore, you can manage your service delivery KPIs end-to-end without switching files.
Home Sheet
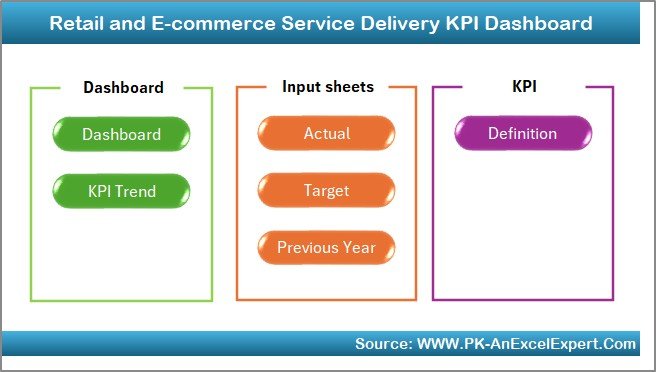
- Functions as the index page
- Contains six buttons that link directly to each worksheet
- Ensures team members navigate quickly without confusion
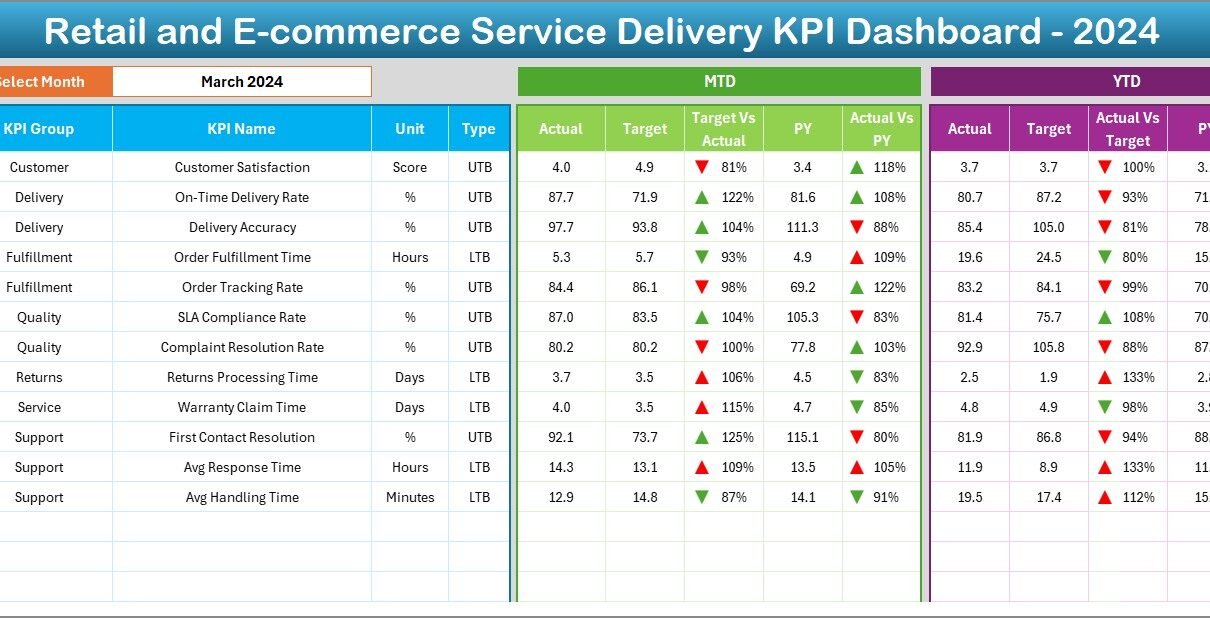
Dashboard Sheet
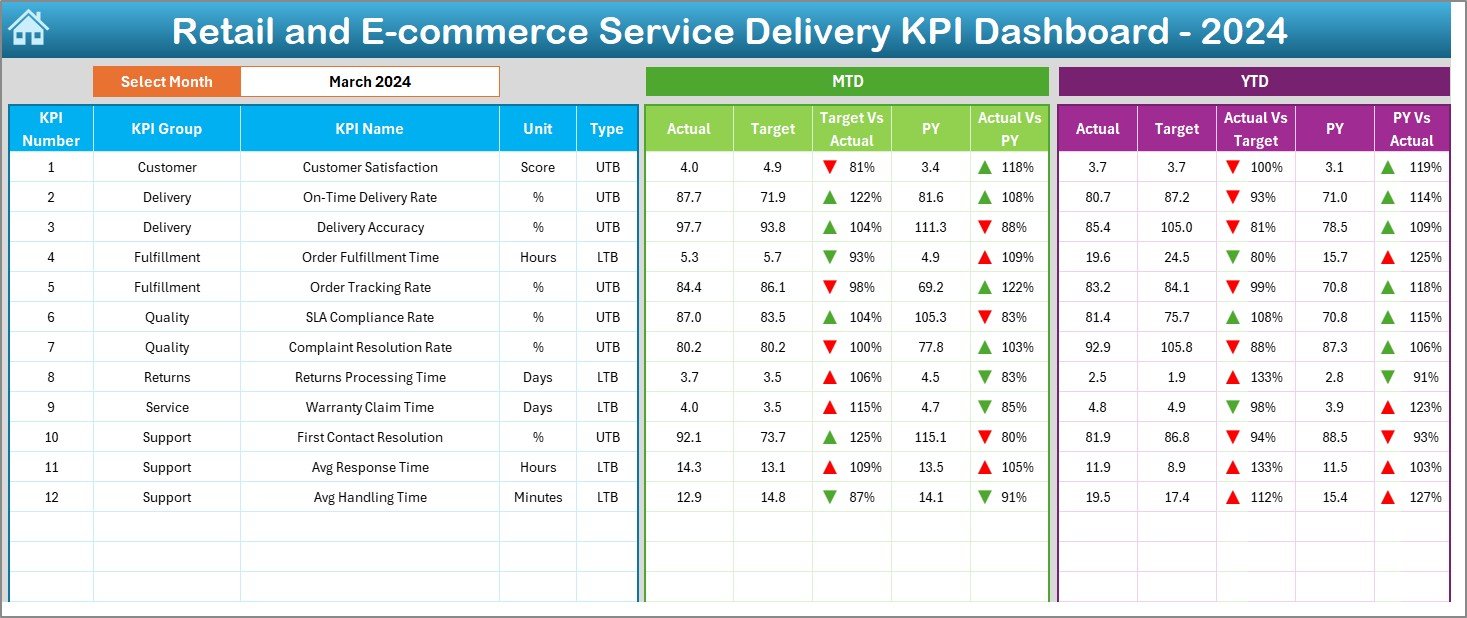
- Serves as the main reporting interface
- Allows you to select the month via a drop-down in cell D3
- Updates MTD and YTD figures for Actual, Target, and PY
- Displays Target vs. Actual and PY vs. Actual variances with up/down arrows via conditional formatting
- Offers at-a-glance insights to measure service delivery against objectives
Click to Purchases Retail and E-commerce Service Delivery KPI Dashboard in Excel
KPI Trend Sheet
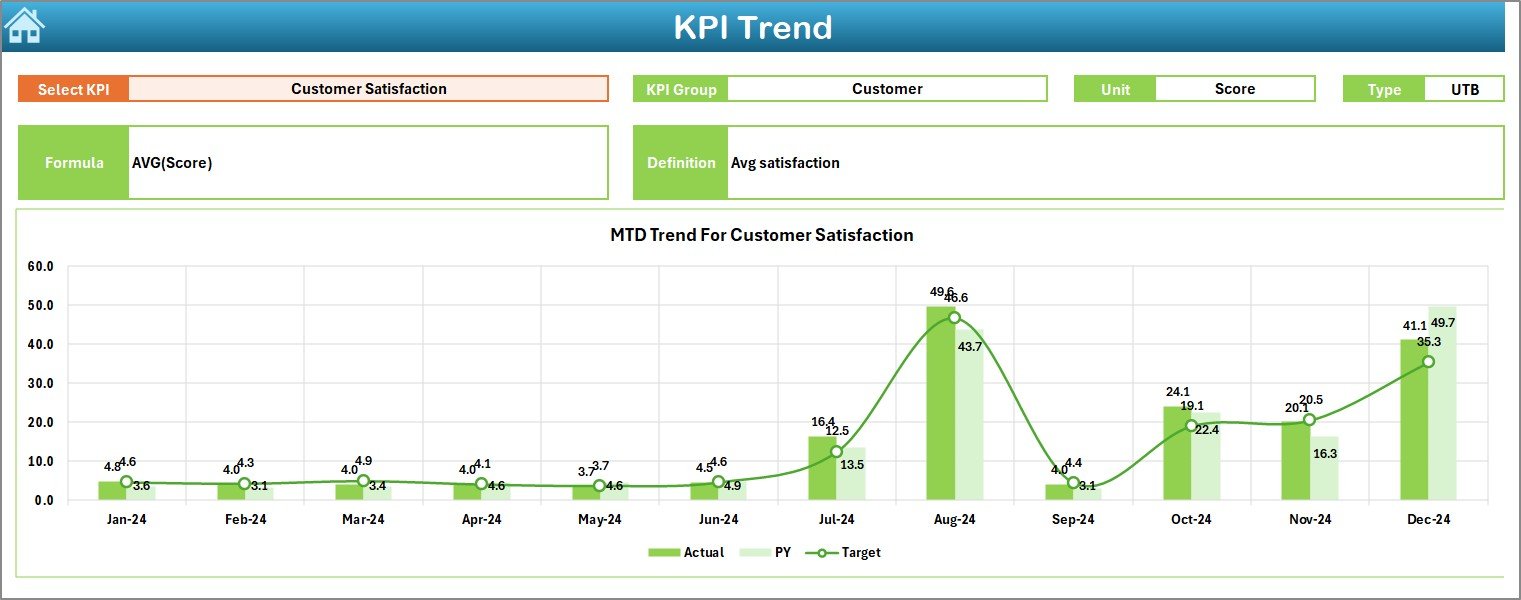
- Lets you choose any KPI from the drop-down in C3
- Shows KPI Group, Unit, Type (Lower the Better or Upper the Better), Formula, and Definition
- Plots MTD and YTD trend charts for Actual, Target, and PY
- Facilitates deep-dive analysis into performance patterns over time
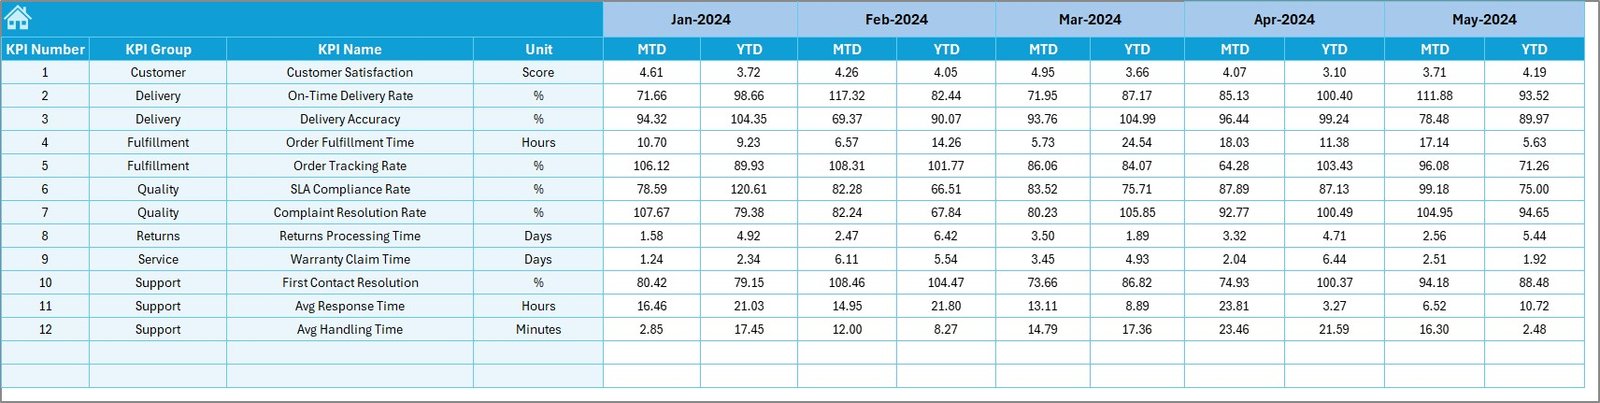
Actual Numbers Input Sheet
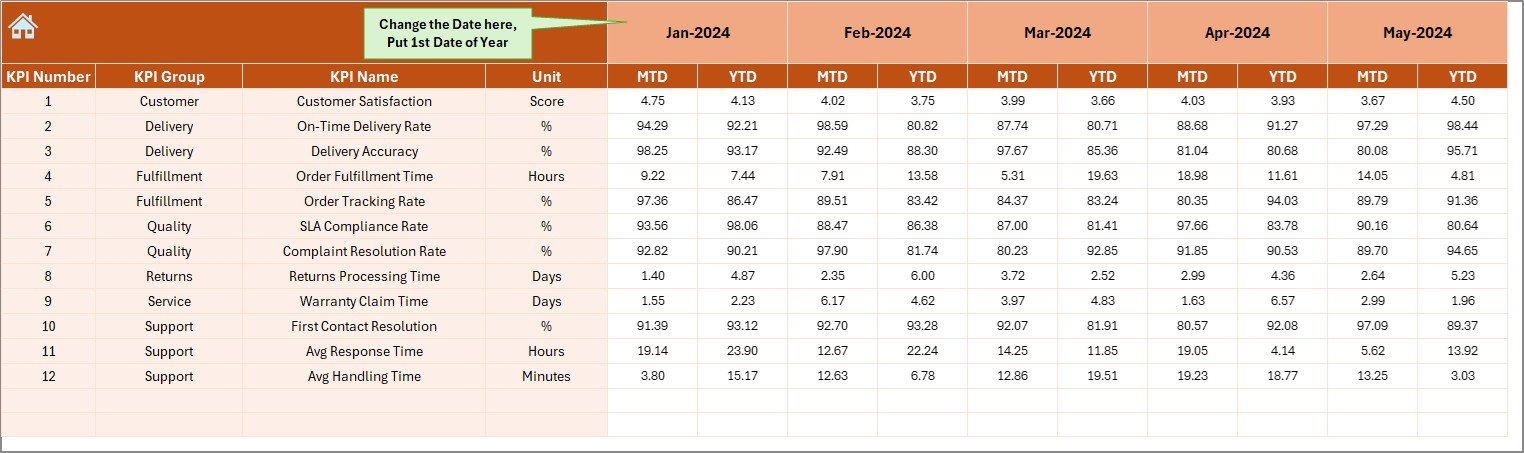
- Allows entry of current year MTD and YTD actuals for each KPI
- Enables you to update the starting month (cell E1) to shift the entire timeline
- Ensures your dashboard reflects the latest data seamlessly
Target Sheet
- Captures monthly Target numbers for each KPI (both MTD and YTD)
- Supports goal-setting processes and scenario planning
Previous Year Numbers Sheet
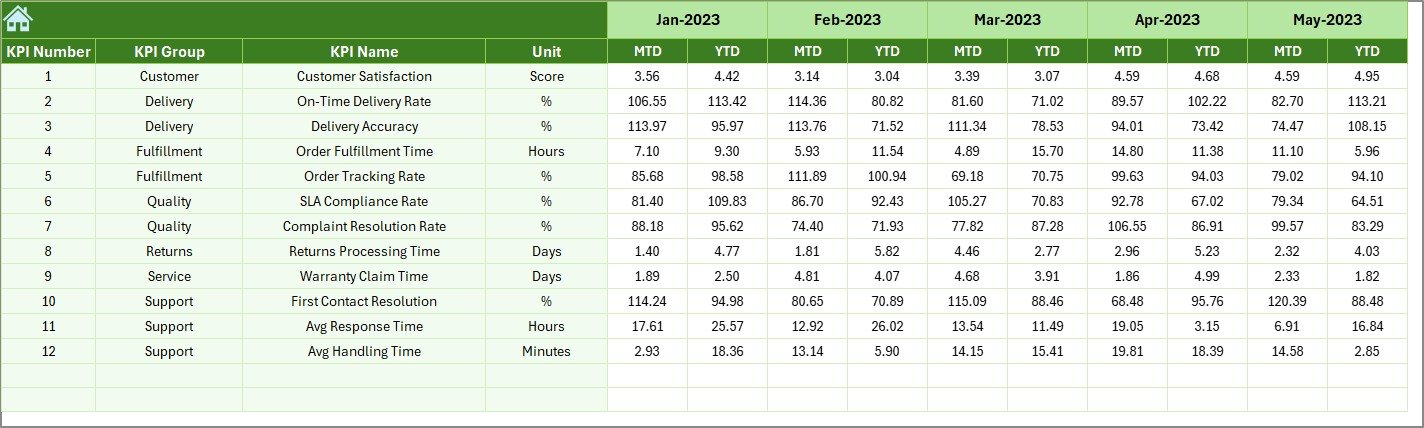
- Stores PY data in the same format as current year inputs
- Empowers year-over-year comparisons to spot seasonal trends and anomalies
KPI Definition Sheet
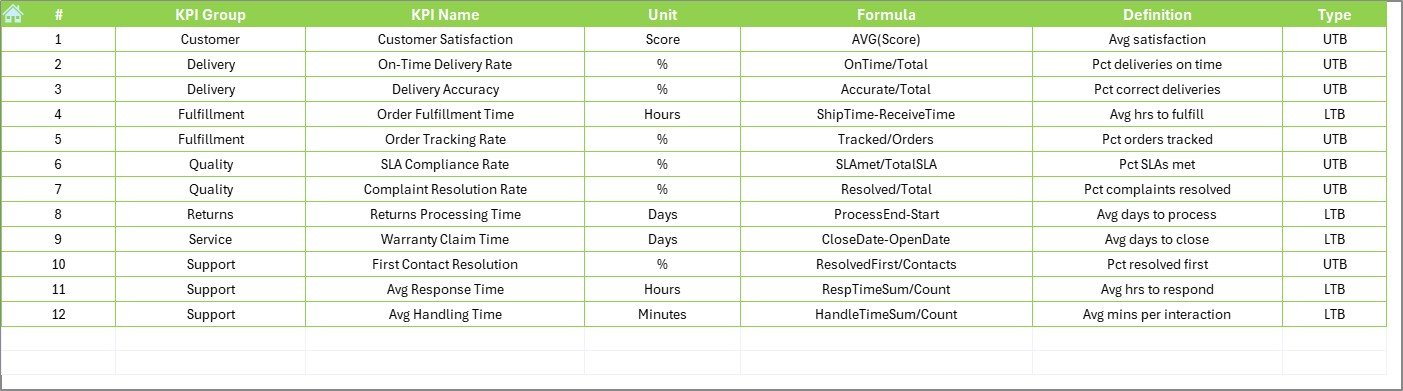
- Houses all KPI metadata: Name, Group, Unit, Formula, and Definition
- Guarantees consistency by centralizing definitions and calculation logic
Advantages of a Retail and E-commerce Service Delivery KPI Dashboard
Implementing this Excel dashboard offers numerous benefits:
-
Enhanced Visibility
As a result of consolidating data in one place, teams gain clear visibility into critical service delivery metrics—no more hunting through multiple spreadsheets or systems. -
Faster Decision-Making
Because you see real-time variances between Actuals, Targets, and PY, you can adjust tactics quickly. Consequently, you minimize response times to issues like late deliveries or customer complaints. -
Improved Accountability
Moreover, by assigning responsibility for data inputs and reviewing trend charts regularly, departments stay accountable for their performance and targets. -
Cost Efficiency
Since the dashboard runs in Excel, you avoid expensive BI licenses or custom software fees. Furthermore, your existing team can maintain it without specialized IT support. -
Scalability
Additionally, the modular structure lets you add new KPIs or extend historical data with minimal effort. Thus, the template grows with your business. -
Customization
Finally, because you control formulas, formatting, and chart types, you tailor the dashboard precisely to your organization’s needs—rather than conforming to rigid, “one-size-fits-all” solutions.
How to Use the Dashboard Effectively
To get the most from this template, follow these steps:
Set Up KPI Definitions
- Begin by completing the KPI Definition sheet.
- Use clear, concise formulas and definitions—keep each under 70 characters when possible.
- Classify each KPI as Lower the Better (LTB) or Upper the Better (UTB).
Populate Historical Targets and Actuals
- Enter previous year data in the Previous Year Numbers sheet.
- Fill in your current year’s Target sheet with realistic, stretch-yet-attainable goals.
- Update the Actual Numbers Input sheet monthly to keep dashboards fresh.
Navigate via Home Sheet
- Use the Home sheet’s buttons to switch between summary, detail, and input sections.
- Train team members to start here to reduce navigation errors.
Analyze Monthly Metrics
- On the Dashboard sheet, select the target month in cell D3.
- Review MTD and YTD summary cards, arrows, and variances to assess performance.
- Click into the KPI Trend sheet for deeper trend analysis on underperforming metrics.
Hold Regular Review Meetings
- Schedule weekly or monthly “dashboard reviews” with stakeholders.
- Discuss variances, root causes, and corrective actions.
- Assign follow-up tasks and update targets or definitions if business needs change.
Best Practices for Retail and E-commerce Service Delivery KPI Dashboards
To maximize impact, adhere to these best practices:
-
Maintain Data Integrity
-
Validate inputs regularly to avoid “garbage in, garbage out.”
-
Lock formula cells to prevent accidental overwrites.
-
-
Use Meaningful Visuals
-
Favor simple bar, line, and column charts compatible with Excel pivot charts.
-
Avoid overly complex visuals like scatterplots that pivot tables can’t support.
-
-
Leverage Conditional Formatting
-
Apply up/down arrows and color scales to highlight key variances instantly.
-
Use consistent color logic (e.g., green for positive, red for negative).
-
-
Document Changes
-
Keep a “Version History” tab to log updates to KPI definitions, formulas, or structure.
-
Date and name each change for audit trails.
-
-
Automate Where Possible
-
Utilize Excel tables and dynamic named ranges so charts update automatically when you add rows.
-
Consider VBA macros to import data or refresh pivot caches at the click of a button.
-
-
Align KPIs to Strategy
-
Focus only on metrics that directly influence customer satisfaction, on-time delivery, and cost efficiency.
-
Discard or deprioritize KPIs that don’t drive actionable insights.
-
-
Train End Users
-
Provide a quick reference guide explaining how to enter data, navigate sheets, and interpret visuals.
-
Host a short workshop to make sure everyone understands the dashboard’s logic.
-
-
Review and Update
-
Revisit your KPI set quarterly.
-
Update definitions or add new KPIs as business objectives evolve.
-
Click to Purchases Retail and E-commerce Service Delivery KPI Dashboard in Excel
Detailed Breakdown of Each Worksheet
Below, you’ll find a closer look at each worksheet’s role and recommended usage tips.
1. Home Sheet
-
Purpose: Serves as the centralized index.
-
Usage Tips:
-
Label each button clearly (e.g., “Go to Dashboard,” “Enter Actuals”).
-
Add brief instructions below each button for first-time users.
-
2. Dashboard Sheet
-
Purpose: Provides a snapshot of MTD/YTD performance.
-
Usage Tips:
-
Place summary cards at the top for high-level KPIs.
-
Organize detail tables below, enabling viewers to scroll through metric lists.
-
3. KPI Trend Sheet
-
Purpose: Enables detailed trend analysis.
-
Usage Tips:
-
Freeze the top row so drop-down and labels remain visible.
-
Add data labels to line charts for clarity during presentations.
-
4. Actual Numbers Input Sheet
-
Purpose: Centralizes current year actual data entry.
-
Usage Tips:
-
Use data validation to restrict entries to numeric values.
-
Highlight the active row or column to reduce data-entry errors.
-
5. Target Sheet
-
Purpose: Holds target numbers for MTD and YTD.
-
Usage Tips:
-
Color code quarterly milestones to visualize pacing.
-
Lock target cells once leadership approves them.
-
6. Previous Year Numbers Sheet
-
Purpose: Stores prior year benchmarks.
-
Usage Tips:
-
Archive older years in a separate hidden sheet to maintain performance.
-
Compare moving averages (e.g., three-month rolling) instead of raw PY for smoother trend analysis.
-
7. KPI Definition Sheet
-
Purpose: Documents metadata for each metric.
-
Usage Tips:
-
Keep definitions concise and aligned to company lexicon.
-
Use comments or notes to explain unusual calculation logic.
-
Conclusion
A Retail and E-commerce Service Delivery KPI Dashboard in Excel empowers your organization to transform raw data into actionable insights. By centralizing KPIs, visualizing trends, and fostering accountability, you’ll accelerate decision-making, improve service levels, and drive profitability. Furthermore, with clear instructions, robust data-validation, and a commitment to best practices, this template will remain your go-to tool for performance management. Start using it today to unlock the full potential of your retail and e-commerce operations.
Frequently Asked Questions
1. What KPIs should I include in my dashboard?
Focus on metrics that directly impact service delivery:
-
On-Time Delivery Rate (UTB)
-
Order Fulfillment Accuracy (UTB)
-
Average Delivery Time (LTB)
-
Customer Complaint Rate (LTB)
-
Return Processing Time (LTB)
2. How often should I update the data?
Update Monthly for strategic reviews and Weekly for operational monitoring. Moreover, ensure data entry deadlines align with reporting cadences.
3. Can I add more KPIs later?
Yes. The dashboard’s modular design lets you insert new rows in the Definition, Target, Actuals, and PY sheets. Thereafter, Excel tables and charts auto-expand.
4. How do I handle missing data?
Use Excel’s built-in functions (e.g., IFERROR, ISBLANK) to flag missing entries. Then, review and fill gaps before meetings to maintain accuracy.
5. Do I need VBA to use this template?
No. You can operate the entire dashboard manually in Excel. However, leveraging VBA Macros can automate data imports and refresh pivot caches for larger datasets.
6. How do I share the dashboard with my team?
Save the file to a shared network or cloud drive with View or Edit permissions. Additionally, export key sheets as PDF for stakeholders who prefer static reports.
Visit our YouTube channel to learn step-by-step video tutorials
Click to Purchases Retail and E-commerce Service Delivery KPI Dashboard in Excel