In today’s digital economy, retail and e-commerce businesses face intense competition. To grow and succeed, they must monitor performance closely and make quick, informed decisions. That’s where a Retail and E-commerce Growth Metrics KPI Dashboard in Excel comes into play. This dashboard helps managers and analysts track crucial metrics, identify opportunities, and address issues before they escalate.
In this guide, we will walk you through everything you need to know about creating, using, and optimizing your KPI dashboard in Excel. Whether you’re a business owner or a data analyst, this article will help you understand how this powerful tool can drive growth in retail and e-commerce environments.
Click to Purchases Retail and E-commerce Growth Metrics KPI Dashboard in Excel
What is a Retail and E-commerce Growth Metrics KPI Dashboard?
A Retail and E-commerce KPI Dashboard is an Excel-based tool designed to consolidate, track, and analyze the key performance indicators (KPIs) that reflect the health and performance of your retail or e-commerce business. It provides a centralized location to monitor metrics like revenue growth, average order value, customer acquisition cost, and more.
This dashboard isn’t just about tracking numbers; it helps you understand the story behind the data. That way, you can make better decisions and take meaningful action.
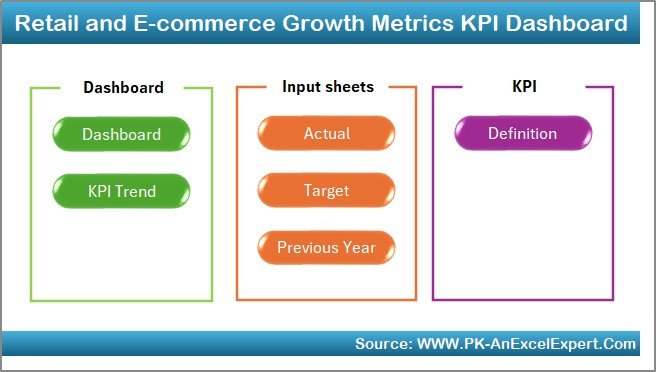
Key Features of the Dashboard Template
This dashboard template is structured into seven smartly designed Excel worksheet tabs, each serving a distinct purpose:
Home Sheet
- Acts as an index page
- Contains navigation buttons to access each of the other tabs quickly
- Ensures seamless user experience
Click to Purchases Retail and E-commerce Growth Metrics KPI Dashboard in Excel
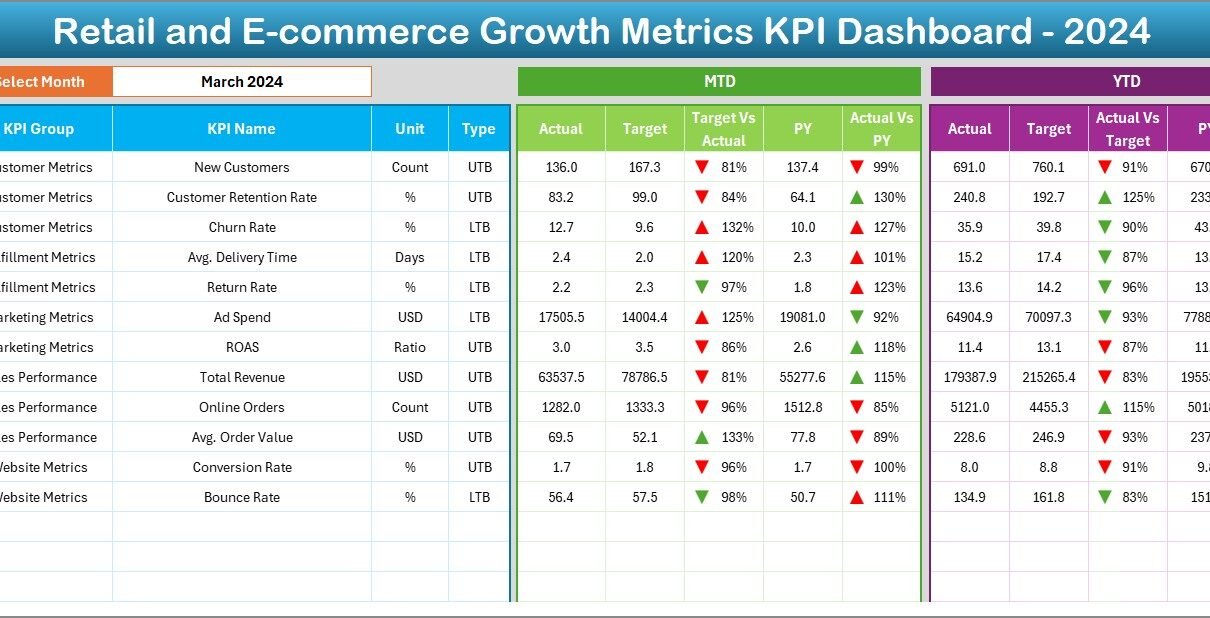
Dashboard Sheet
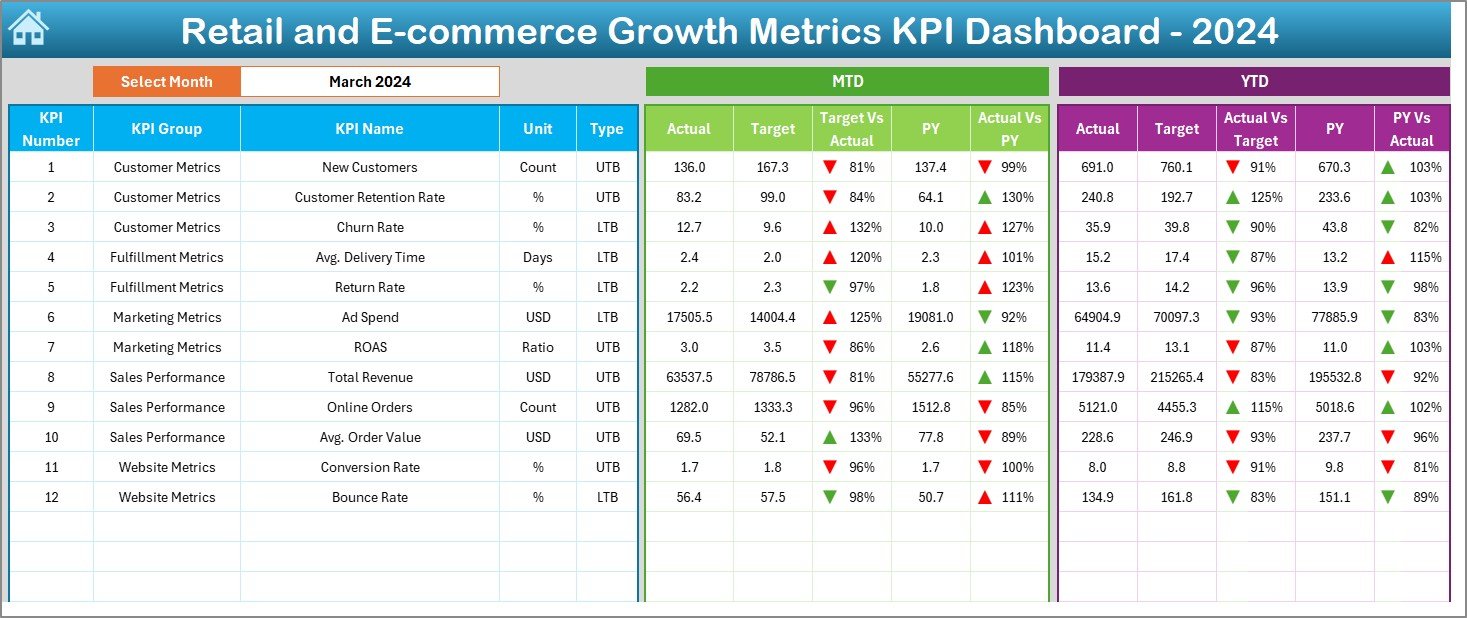
- The heart of the tool
- Allows you to select the month from a drop-down list in cell D3
- Displays MTD (Month-to-Date) and YTD (Year-to-Date) data
Includes:
- Actual vs Target comparison
- Current year vs Previous year analysis
- Conditional formatting (up/down arrows) for quick visual cues
KPI Trend Sheet
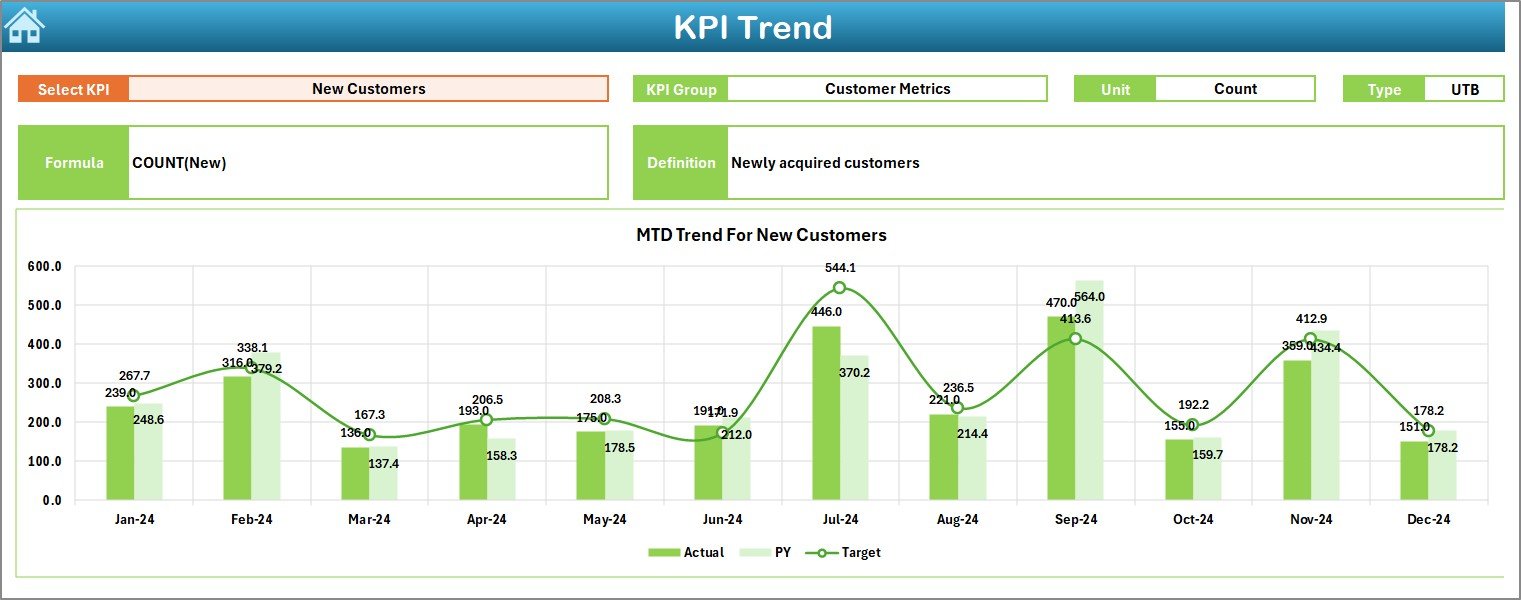
- Offers dropdown in cell C3 to select any KPI
Shows:
- KPI Group
- Unit
- Type (UTB: Upper The Better / LTB: Lower The Better)
- KPI Formula and Definition
- Visualizes MTD and YTD trends through interactive charts
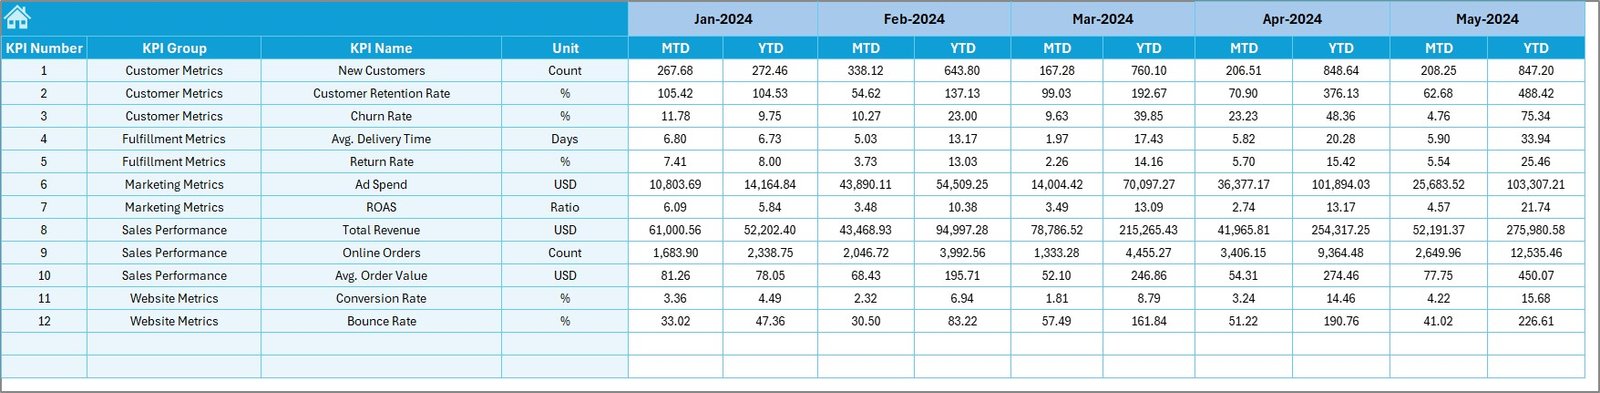
Actual Numbers Input Sheet
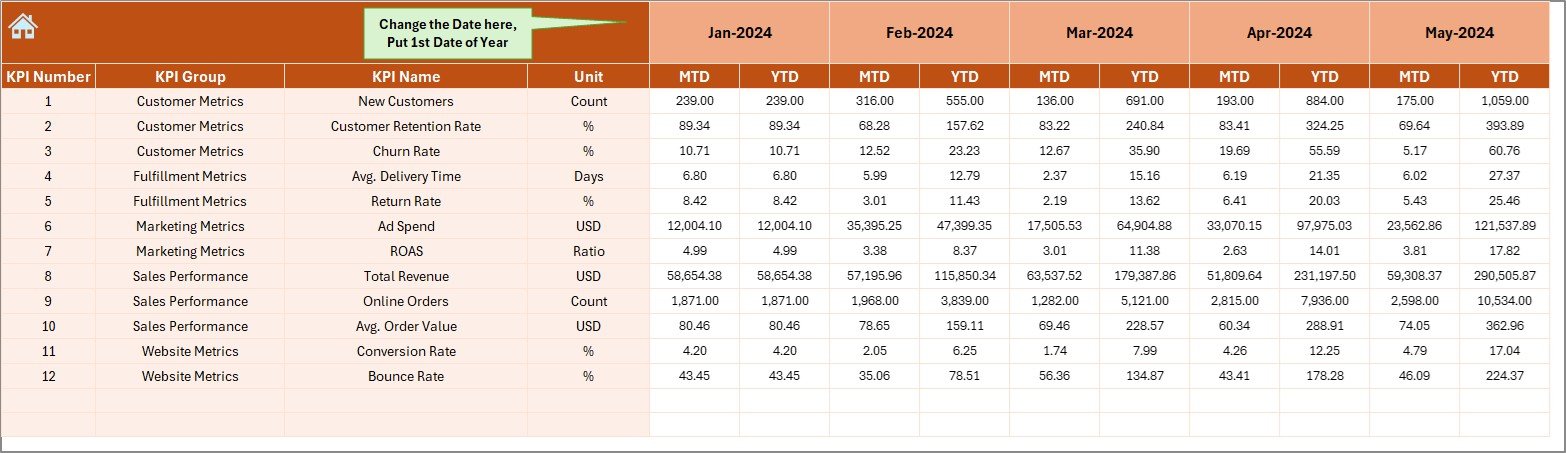
- Enter monthly actual values for MTD and YTD
- Adjust the fiscal year starting month via cell E1
- Enables dynamic tracking of current performance
Click to Purchases Retail and E-commerce Growth Metrics KPI Dashboard in Excel
Target Sheet
- Define monthly MTD and YTD targets for each KPI
- Helps set benchmarks for performance
Previous Year Numbers Sheet
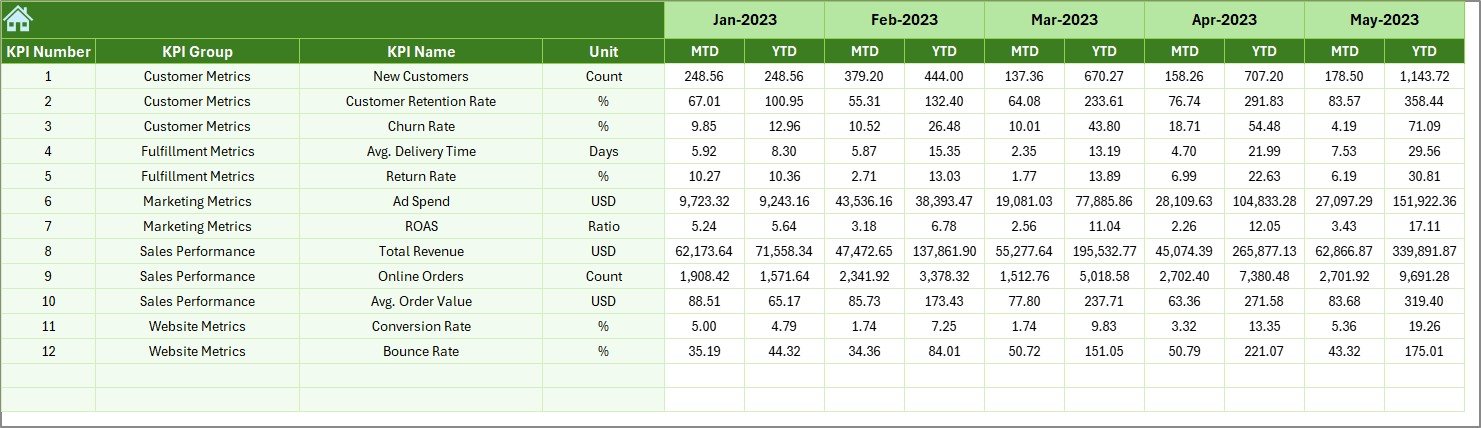
- Record historical MTD and YTD data
- Allows meaningful comparisons and growth analysis
KPI Definition Sheet
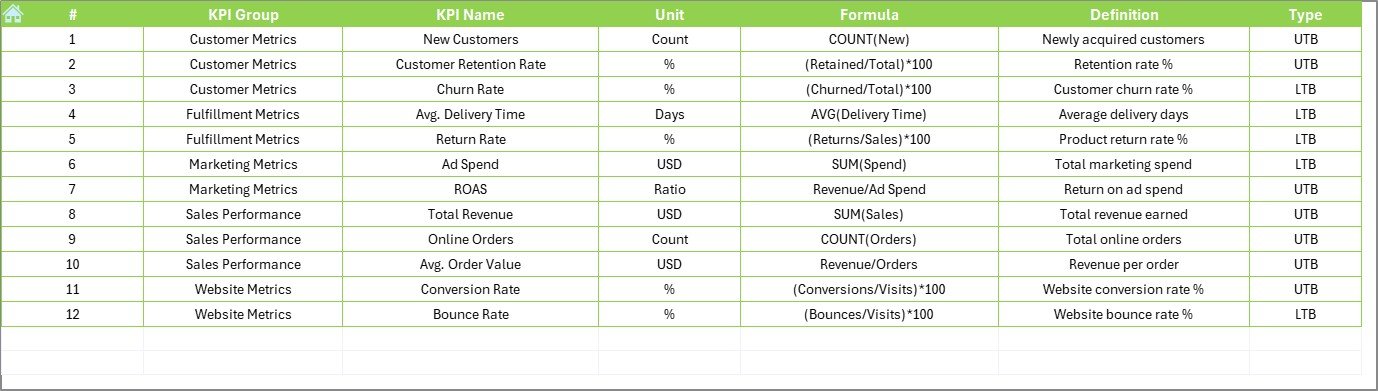
- Document every KPI
- Include Group, Name, Unit, Formula, and Definition
- Acts as a reference and knowledge base for stakeholders
Click to Purchases Retail and E-commerce Growth Metrics KPI Dashboard in Excel
Why Do You Need This Dashboard?
If you’re involved in retail or e-commerce, you’re likely tracking dozens of metrics already. But without structure, the insights get lost. This Excel dashboard helps you:
- Stay organized
- Access real-time insights
- Compare actual performance vs goals
- Detect trends before they impact results
- Communicate effectively with stakeholders
With automation and conditional formatting, it provides instant visibility into performance, ensuring that decision-makers always know where they stand.
Top KPIs to Track in Retail and E-commerce Growth
Your dashboard should include a diverse set of KPIs across different business areas. Below are 12 powerful metrics commonly used:
- Monthly Revenue – Total income from all sales
- Gross Profit Margin – (Revenue – COGS) / Revenue
- Customer Acquisition Cost (CAC) – Total marketing cost / New customers
- Average Order Value (AOV) – Revenue / No. of Orders
- Conversion Rate – (Orders / Website Visitors) x 100
- Cart Abandonment Rate – (Abandoned Carts / Total Carts) x 100
- Customer Retention Rate – % of customers who make repeat purchases
- Sales Per Category – Revenue from each product category
- Return Rate – % of items returned out of total sold
- Stock Turnover Ratio – COGS / Average Inventory
- Revenue per Customer – Revenue / No. of Unique Customers
- Refund Processing Time – Average time to resolve a refund case
Advantages of Using a KPI Dashboard in Excel
Implementing a growth metrics dashboard delivers many benefits:
✅ Centralized Data Tracking
No more jumping between files or platforms. Everything lives in one file.
✅ Real-Time Decision Making
Access the most current numbers instantly. Respond faster to changes in performance.
✅ Customization
Add or remove KPIs as per your business priorities. Tailor it to fit your model.
✅ Cost-Effective
Unlike expensive BI tools, Excel is widely available and highly versatile.
✅ User-Friendly Design
With drop-downs and navigational buttons, this dashboard is easy for anyone to use.
Click to Purchases Retail and E-commerce Growth Metrics KPI Dashboard in Excel
Best Practices for the Retail & E-commerce Growth Dashboard
To maximize the value of this dashboard, follow these best practices:
1. Update Data Consistently
Make sure actual, target, and previous year numbers are refreshed monthly. Inaccurate inputs lead to unreliable outputs.
2. Review KPIs Quarterly
Not all KPIs remain relevant forever. Review them periodically to align with business goals.
3. Keep Definitions Clear
Use the KPI Definition tab to clarify how each metric is calculated. This avoids confusion and ensures alignment.
4. Use Conditional Formatting Wisely
Colors and arrows are helpful, but avoid overusing them. Highlight only what matters.
5. Back Up Regularly
Save copies of the dashboard after major updates to prevent data loss.
How to Use This Dashboard: Step-by-Step Guide
- Start at the Home Tab
- Use the buttons to navigate between sheets
- Input Data
- Add Actual data in the “Actual Numbers Input” tab
- Add Targets in the “Target” tab
- Add Previous Year values in the “Previous Year Number” tab
- View KPI Definition
- Go to the “KPI Definition” tab to understand each metric
- Monitor the Dashboard
- Select a month in the Dashboard tab to see current insights
- Analyze MTD and YTD charts with visual cues
- Check Trends
- Go to the “KPI Trend” tab to explore performance patterns over time
Real-World Applications
This Excel-based KPI dashboard can be applied to:
- Online Retail Stores tracking order volume, returns, and revenue
- Brick-and-Mortar Retail Chains managing sales across locations
- Multi-Channel Sellers analyzing performance on Amazon, Shopify, and own website
- Marketing Teams observing the effectiveness of campaigns
- Inventory Managers watching stock turnover and return rates
How to Customize the Dashboard
Customizing this dashboard is easy and recommended. Here’s how:
- Add More KPIs: Insert new rows in the KPI Definition tab and update related sheets
- Change Time Periods: Modify month names or add new columns for weekly data
- Add More Charts: Use Excel’s Pivot Charts to create additional visuals
- Rename Sheets: Tailor them to match your internal naming conventions
Common Mistakes to Avoid
- Overloading with Too Many KPIs
- Focus on 10–15 meaningful metrics
- Ignoring Data Quality
- Validate your inputs; wrong data leads to wrong decisions
- Neglecting Historical Trends
- Always compare with previous year and target
- Lack of Stakeholder Involvement
- Share the dashboard across departments for broader insights
- Static Reporting
- Keep the file dynamic by updating it monthly
Conclusion
A well-designed Retail and E-commerce Growth Metrics KPI Dashboard in Excel is more than a reporting tool—it’s a decision-making engine. It allows businesses to monitor growth, evaluate performance, and strategize for success with confidence. With just Excel and a bit of discipline, your business can enjoy the same data-driven insights used by industry leaders.
Click to Purchases Retail and E-commerce Growth Metrics KPI Dashboard in Excel
Frequently Asked Questions (FAQs)
1. Can I use this dashboard in Google Sheets?
Yes, but advanced formatting and some features may not carry over smoothly. Excel is preferred for best performance.
2. How many KPIs should I track in this dashboard?
Start with 10–12 core KPIs and expand based on your needs.
3. Do I need Excel expertise to use this dashboard?
No. This template uses drop-downs and buttons, making it beginner-friendly.
4. Is this dashboard suitable for small businesses?
Absolutely. It is lightweight, cost-effective, and ideal for businesses of all sizes.
5. How often should I update the data?
Update the actuals, targets, and previous year numbers every month to maintain accuracy.
6. Can I add more charts to the dashboard?
Yes, you can use Pivot Charts to create custom visuals as needed.
7. Will this dashboard work on Excel for Mac?
Yes, but ensure all buttons and formatting work properly as some Mac versions may behave differently.
8. How do I interpret conditional formatting arrows?
Up arrows indicate performance improvement. Down arrows show decline.
Click to Purchases Retail and E-commerce Growth Metrics KPI Dashboard in Excel
Visit our YouTube channel to learn step-by-step video tutorials