In the world of food packaging, tracking performance is crucial for maintaining quality, meeting customer expectations, and achieving business goals. One of the most effective tools for tracking these metrics is the Food Packaging KPI Dashboard in Power BI. This ready-to-use dashboard allows you to capture essential data, visualize key performance indicators (KPIs), and make informed decisions based on real-time insights. In this article, we will explore how the Food Packaging KPI Dashboard in Power BI works, its key features, advantages, and best practices for using it.
Click to Purchases Food Packaging KPI Dashboard in Power BI
What is the Food Packaging KPI Dashboard in Power BI?
The Food Packaging KPI Dashboard in Power BI is a dynamic, data-driven tool that enables companies to track and analyze key performance indicators (KPIs) in the food packaging industry. Built using Power BI and Excel, this dashboard provides real-time visualizations, helping businesses stay on top of their performance metrics across various stages of the packaging process.
The dashboard is designed to be user-friendly, making it easy for team members and decision-makers to monitor data, track progress, and identify areas for improvement.
Key Features of the Food Packaging KPI Dashboard
The Food Packaging KPI Dashboard consists of three main pages in Power BI:
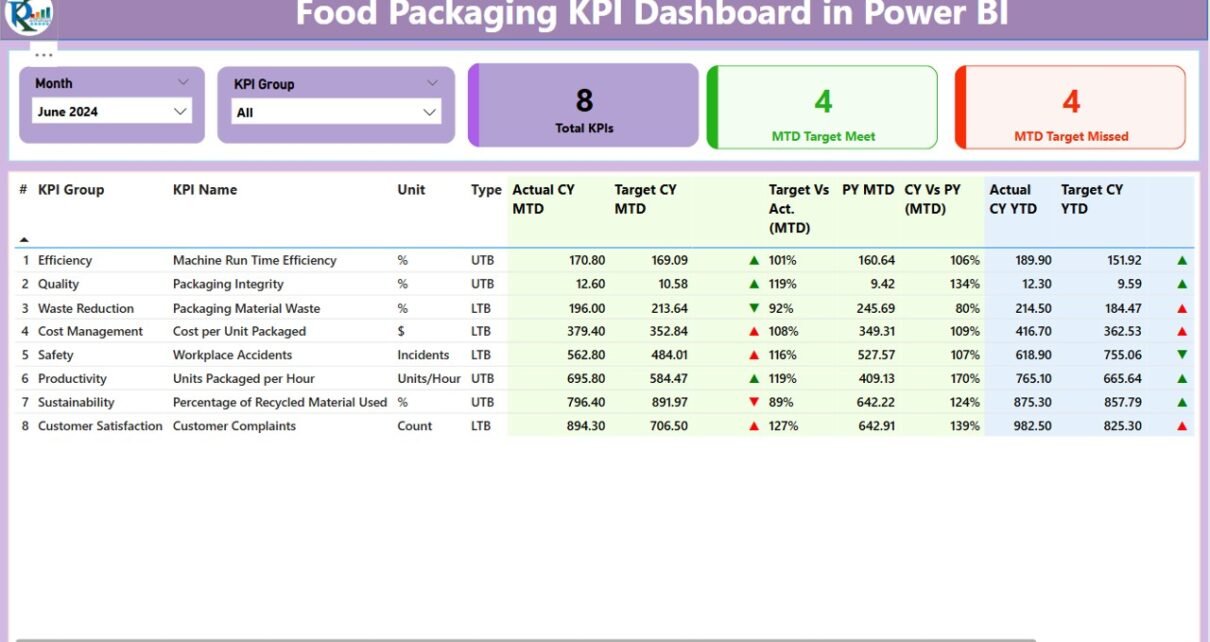
Summary Page
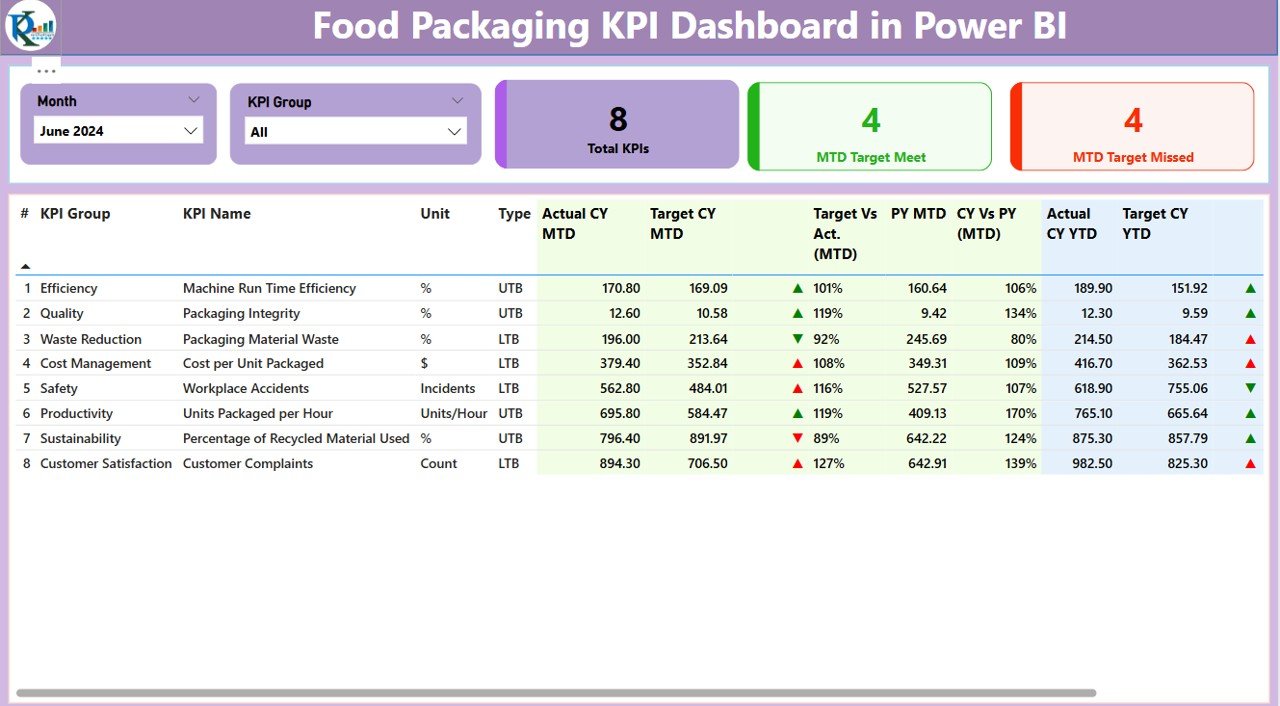
The Summary Page is the heart of the dashboard, providing a comprehensive overview of the KPIs. It includes:
-
-
-
Month and KPI Group Slicer: This slicer allows users to filter data by month and KPI group.
-
Cards for KPI Count: Display the total count of KPIs, KPIs meeting the target (MTD), and KPIs missing the target (MTD).
-
Detailed Table: This table breaks down each KPI with the following information:
-
KPI Number: Sequential number for each KPI.
-
KPI Group: Category or group of the KPI (e.g., Production, Efficiency).
-
KPI Name: Name of the KPI.
-
Unit: Unit of measurement (e.g., Units per Hour).
-
Type (LTB/UTB): The type of KPI (Lower the Better or Upper the Better).
-
Actual CY MTD & Target CY MTD: Current Year MTD (Month-to-Date) actual and target values.
-
MTD Icon: Green/Red arrows showing the status of the KPI.
-
Target Vs Actual (MTD): Percentage comparison of actual vs target for the current month.
-
CY Vs PY (MTD): Comparison of Current Year MTD vs Previous Year MTD.
-
Actual CY YTD & Target CY YTD: Current Year YTD (Year-to-Date) actual and target values.
-
YTD Icon: Green/Red arrows showing the status of the KPI for YTD.
-
Target Vs Actual (YTD): Percentage comparison of actual vs target for YTD.
-
CY Vs PY (YTD): Comparison of Current Year YTD vs Previous Year YTD.
-
-
-
KPI Trend Page
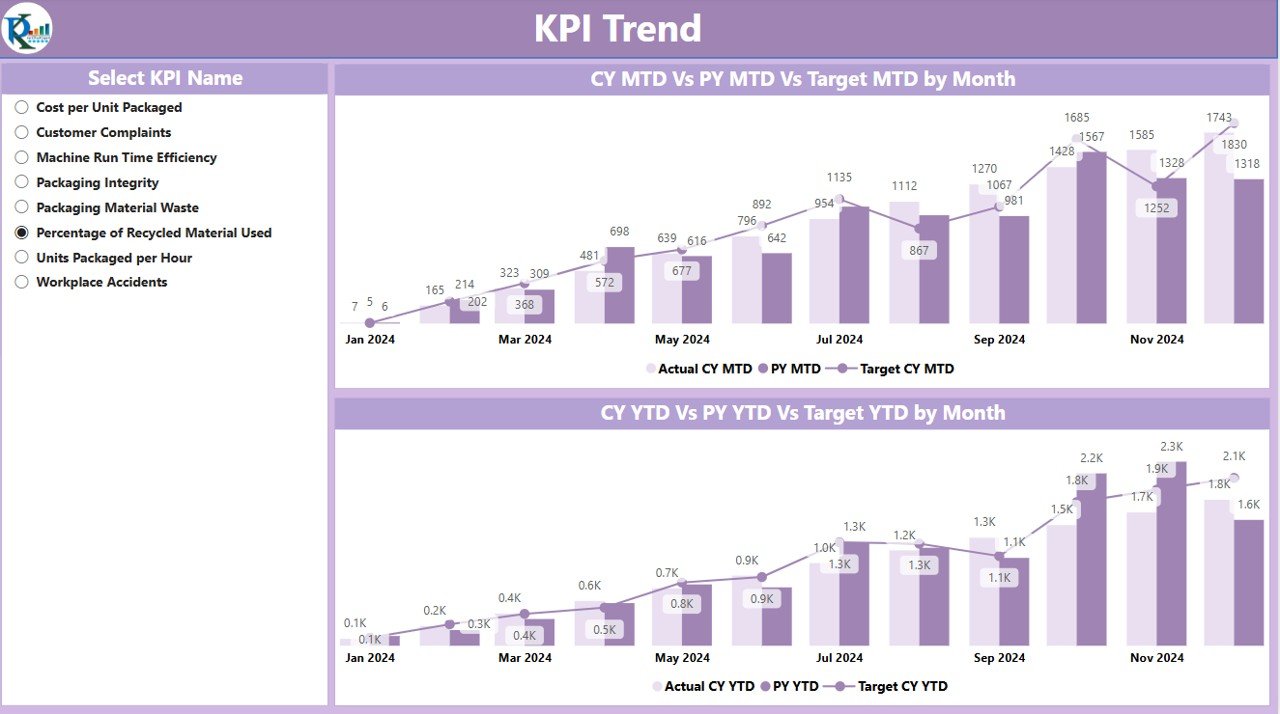
- This page includes combo charts displaying the actual numbers for the current and previous year, along with target values for MTD and YTD. Users can filter data by KPI name using a slicer on the left side.
KPI Definition Page
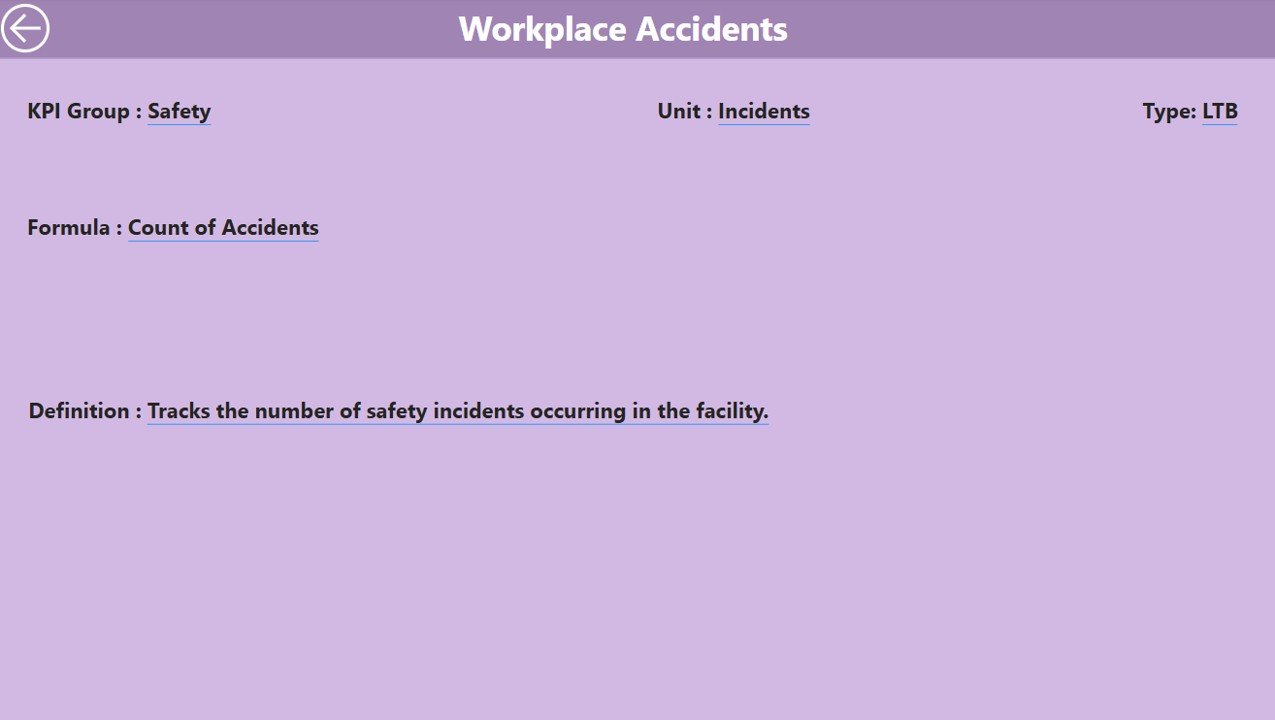
- The KPI Definition Page provides detailed information about each KPI, including its formula and definition. This page is hidden by default and can be accessed via a drill-through feature from the Summary Page. It’s ideal for users who need to understand the formula behind the KPIs.
Advantages of Using the Food Packaging KPI Dashboard
The Food Packaging KPI Dashboard in Power BI offers numerous benefits that help businesses optimize their operations, improve decision-making, and ensure better performance.
-
Real-time Data Visualization
-
The dashboard provides real-time insights, allowing businesses to monitor performance as it happens. This helps decision-makers stay informed and react swiftly to any issues.
-
-
Enhanced Decision-Making
-
With a clear visual representation of data, the dashboard helps users make data-driven decisions. Whether it’s adjusting production processes or optimizing packaging efficiency, having the right information at hand improves the quality of decisions.
-
-
Easy Access to Key Performance Indicators
-
By centralizing all KPIs in one place, the dashboard ensures that relevant data is easy to access and interpret. This reduces the time spent searching for data and allows teams to focus on improving performance.
-
-
Comparative Analysis
-
The ability to compare current performance against past performance (e.g., CY vs. PY) allows users to understand trends, identify patterns, and make adjustments accordingly.
-
-
Customizable Views
-
With slicers for month and KPI group, the dashboard can be tailored to meet the specific needs of different departments or teams. This makes it a versatile tool for tracking performance across various stages of the packaging process.
-
-
Increased Accountability
-
The detailed KPI table, along with color-coded status icons, increases accountability by clearly showing which KPIs are meeting targets and which ones are falling short. This encourages teams to strive for continuous improvement.
-
Best Practices for Using the Food Packaging KPI Dashboard
Click to Purchases Food Packaging KPI Dashboard in Power BI
To get the most out of the Food Packaging KPI Dashboard in Power BI, consider these best practices:
-
Regularly Update Data
-
To ensure the dashboard provides accurate insights, it’s crucial to update the data regularly. This can be done through the Input_Actual and Input_Target sheets, where you input the latest MTD and YTD data.
-
-
Monitor KPIs Consistently
-
Regularly monitor KPIs using the Summary Page and KPI Trend Page. These pages provide an overview of how well the business is performing and where adjustments are needed.
-
-
Utilize Drill-Through for Detailed Insights
-
Take advantage of the KPI Definition Page to gain deeper insights into each KPI. Understanding the formula and the context behind each metric can help identify areas for improvement.
-
-
Customize the Dashboard
-
Modify the slicers and filters to focus on specific KPIs or months. This makes the dashboard adaptable to the needs of various users within the organization, such as production managers, quality control teams, or senior leadership.
-
-
Use Conditional Formatting for Better Clarity
-
Leverage the MTD and YTD icons (red and green arrows) to quickly identify KPIs that are on track and those that need attention. This helps in prioritizing tasks and focusing on key areas for improvement.
-
-
Integrate with Other Business Systems
-
Consider integrating the dashboard with other business systems (e.g., ERP systems, inventory management) for a more comprehensive view of operations.
-
Frequently Asked Questions (FAQs)
What is the Food Packaging KPI Dashboard in Power BI?
-
The Food Packaging KPI Dashboard in Power BI is a data visualization tool that tracks and analyzes key performance indicators related to food packaging. It provides real-time insights into packaging efficiency, production rates, and target performance.
How do I update data in the dashboard?
-
Data can be updated in the Input_Actual and Input_Target sheets of the connected Excel file. Simply input the latest MTD and YTD values for KPIs, and the dashboard will reflect the changes automatically.
What types of KPIs can be tracked using this dashboard?
-
The dashboard can track a wide range of KPIs, including production rates, packaging efficiency, cost per unit, downtime, and quality metrics. These KPIs are categorized into groups such as Production, Efficiency, and Quality.
How does the dashboard compare current performance with past performance?
-
The dashboard compares Current Year (CY) performance with Previous Year (PY) performance using MTD and YTD comparisons. This helps identify trends and make adjustments for continuous improvement.
Can the dashboard be customized?
-
Yes, the dashboard is customizable. You can filter data by KPI group, month, and other parameters. Additionally, you can modify the slicers to focus on specific KPIs or time periods.
Conclusion
The Food Packaging KPI Dashboard in Power BI is a powerful tool that streamlines the tracking and analysis of key performance indicators in the food packaging industry. By providing real-time data, detailed insights, and customizable views, it helps businesses optimize their operations, improve decision-making, and ensure continuous performance improvement. By following best practices and regularly updating data, users can maximize the value of this dashboard and drive better outcomes in their food packaging processes.
Visit our YouTube channel to learn step-by-step video tutorials