In today’s fast-paced global economy, supply chain efficiency is the backbone of a successful business. Whether you’re running a manufacturing unit, a retail operation, or a service business, having clear visibility into your supply chain can drive better decisions, reduce costs, and improve customer satisfaction.
So, how can you gain this visibility without investing in complex, expensive software? The answer is simple — a Supply Chain Report in Excel.
This article will walk you through everything you need to know about using Excel to build a robust supply chain report. We’ll explore the key features, benefits, best practices, and frequently asked questions to help you make the most of this powerful reporting tool.
Click to Purchases Supply Chain Report in Excel
What is a Supply Chain Report in Excel?
A Supply Chain Report in Excel is a structured and interactive spreadsheet that allows you to track and analyze your supply chain operations using predefined metrics. It transforms raw data into actionable insights using Excel features like slicers, charts, tables, and formulas.
This report is designed for:
-
Supply chain managers
-
Procurement teams
-
Inventory controllers
-
Business analysts
-
And anyone who wants better visibility into their supply network
Rather than relying on generic spreadsheets or manually compiled reports, this template delivers a ready-to-use solution tailored to modern supply chain needs.
Key Features of the Supply Chain Report Template
Our Excel-based Supply Chain Report template comes with three main pages and additional support sheets to ensure seamless use. Here’s a breakdown:
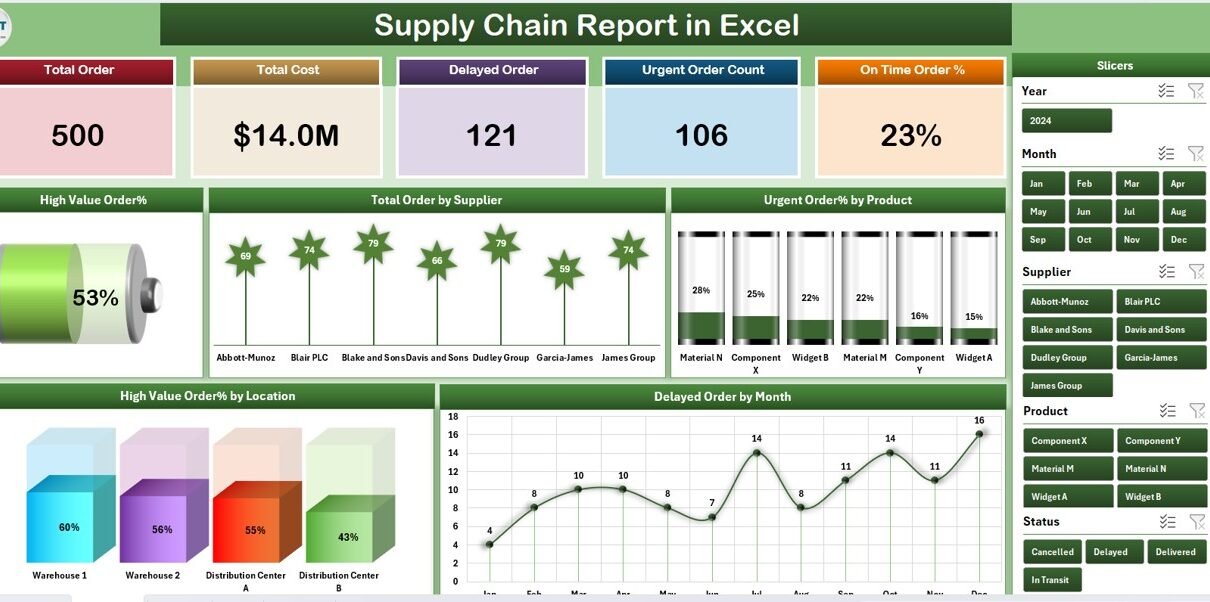
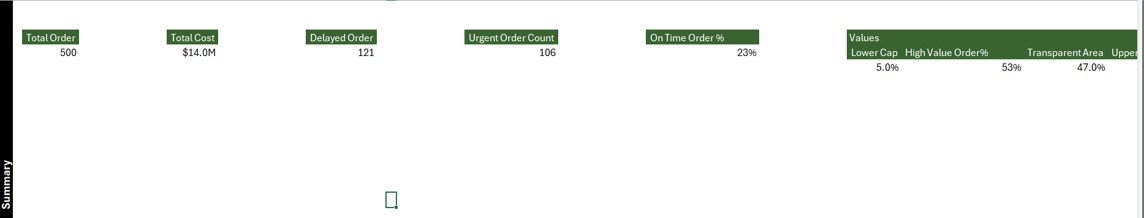
Summary Page
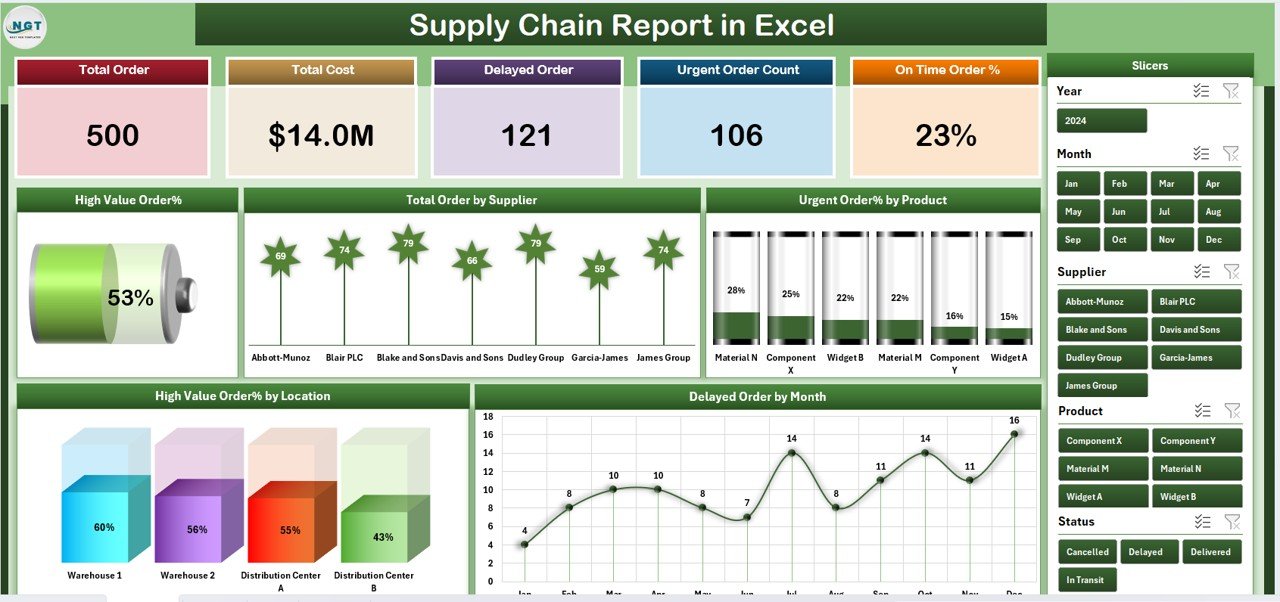
This is the main dashboard view that gives you a high-level overview of your supply chain performance.
It includes:
Top 5 Cards (KPIs):
- High Value Order %
- Total Order by Supplier
- Urgent Order % by Product
- High Value Order % by Location
- Delayed Orders by Month
Interactive Slicers on the Right Side
Easily filter by time period, location, supplier, or product to drill down into specific insights.
-
Visual Charts
These include bar charts, pie charts, and line graphs that make complex data easy to understand.
Report Page
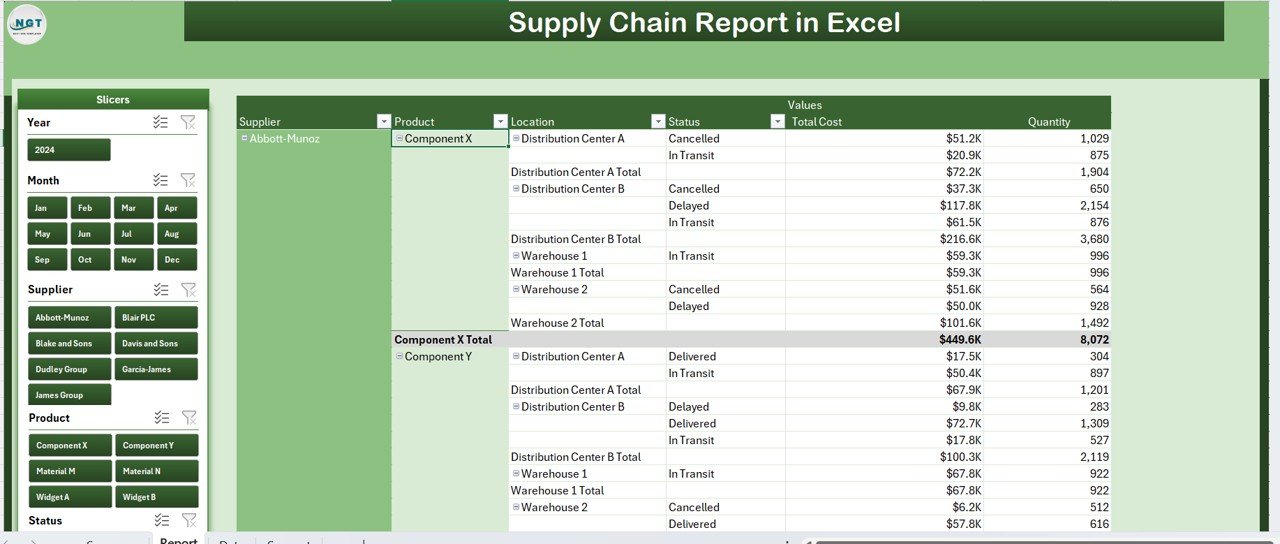
This page serves as your detailed data view. It comes with:
-
Left-side slicers for filtering
An organized information table to display detailed records such as:
- Order ID
- Supplier Name
- Product Type
- Order Date
- Delivery Status
- Order Value
- Priority Level
This layout supports effective decision-making and quick identification of trends.
Data Sheet
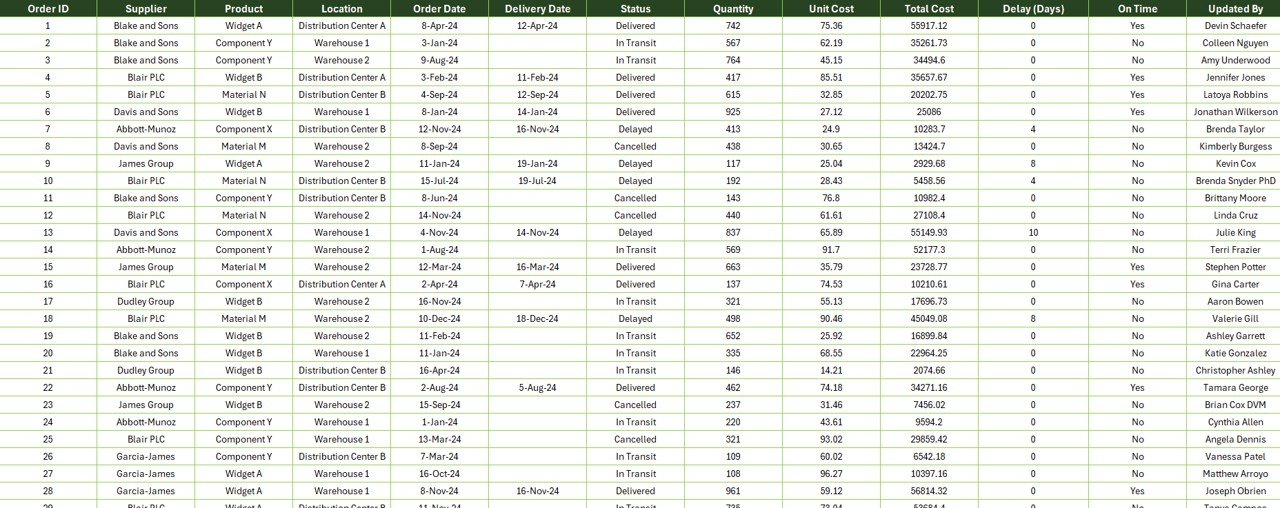
This is the backend where you enter or import your raw data. You can:
-
Copy/paste your supply chain data
-
Import from external sources
-
Connect to databases or APIs (optional with Power Query)
Support Sheet
The support sheet contains:
-
Dropdown lists
-
Defined values for slicers
-
Lookup references for metrics
It ensures consistency and keeps the main data table clean and functional.
Why Use Excel for Your Supply Chain Report?
Click to Purchases Supply Chain Report in Excel
You might wonder — with so many ERP and supply chain platforms out there, why use Excel?
Here’s why:
-
✅ Accessibility: Everyone has Excel.
-
✅ Customizable: You can adapt the report to your specific needs.
-
✅ No Cost: No additional software investment required.
-
✅ Visual and Interactive: Charts and slicers make insights easy to digest.
-
✅ Data Control: Full control over how your data is stored, calculated, and displayed.
KPIs to Track in a Supply Chain Report
To make your report effective, it’s important to include the right metrics. Here are some common KPIs already included in our Excel template:
-
High Value Order % – Identifies large transactions to manage supplier negotiations.
-
Urgent Order % by Product – Helps track emergency orders which could indicate forecasting issues.
-
Total Orders by Supplier – Provides insight into supplier dependency.
-
Delayed Orders by Month – Tracks supply chain disruptions or inefficiencies.
-
High Value Order % by Location – Highlights geographic trends in your procurement strategy.
These metrics help you make decisions faster and align your team on performance goals.
Advantages of Using a Supply Chain Report in Excel
Here are the key benefits of adopting this ready-to-use report:
-
🔹 Improves Visibility
Monitor your entire supply chain from a single dashboard. -
🔹 Increases Accountability
Assign ownership to suppliers and teams based on real data. -
🔹 Enhances Planning
Understand historical trends and plan better for upcoming months. -
🔹 Reduces Operational Cost
Catch delays, urgent orders, and cost overruns early. -
🔹 Boosts Communication
Share reports easily across teams and departments with no need for special training.
Best Practices for Using the Supply Chain Report in Excel
To get the most out of your Excel report, follow these best practices:
1. Keep Data Updated
Ensure your data sheet is regularly refreshed — either manually or via automated imports.
2. Use Standard Naming Conventions
Maintain consistency in product names, supplier codes, and locations.
3. Protect Sensitive Data
Use Excel’s built-in password and sheet protection features to prevent unwanted edits.
4. Avoid Overloading with Data
Focus on actionable data. Archive older data to maintain speed and usability.
5. Use Conditional Formatting
Highlight delays or urgent orders with colors to draw immediate attention.
6. Validate Data Entries
Use data validation and dropdowns from the support sheet to minimize entry errors.
How to Get Started with the Supply Chain Report Template
Here’s a step-by-step guide to using the template:
-
Download the Template
-
Load the Excel file onto your system.
-
-
Go to the Data Sheet
-
Replace the sample data with your actual records.
-
Ensure your column headers match exactly.
-
-
Review the Support Sheet
-
Customize dropdown values if needed.
-
-
Check the Summary Page
-
Use the slicers to filter data.
-
Review the charts to get a quick overview.
-
-
Explore the Report Page
-
Use filters to deep-dive into specific segments.
-
-
Update Regularly
-
Keep refreshing data weekly or monthly to maintain relevance.
-
Who Can Benefit from This Excel-Based Report?
This tool is ideal for:
🔸 Small and Medium Businesses (SMBs)
🔸 Supply Chain Consultants
🔸 Logistics Coordinators
🔸 Procurement Officers
🔸 Retail Managers
🔸 Inventory Controllers
No matter your role, this report helps simplify complex supply chain decisions.
Use Case Examples
Example 1: Procurement Manager
A procurement manager can track high-value orders and ensure the supplier contract terms are followed.
Example 2: Inventory Controller
Helps monitor which products face frequent urgent orders—indicating inventory planning gaps.
Example 3: Operations Analyst
Spot delivery delays by month to identify process bottlenecks or supplier reliability issues.
Opportunities for Improvement
Even the best systems can evolve. Here are areas to enhance your report further:
🌐 Integrate with Power BI
For advanced visualizations and drill-down reports.
🔁 Automate Data Imports
Use Power Query or macros to reduce manual entry.
📧 Add Email Alerts
Trigger alerts for late orders or high urgency levels.
🧩 Expand KPI Scope
Include metrics like inventory turnover, cost per order, and on-time delivery rate.
Conclusion
A well-structured Supply Chain Report in Excel gives you the clarity and control needed to optimize your supply chain. It’s affordable, adaptable, and easy to use — making it the perfect choice for businesses of all sizes.
Whether you’re tracking supplier performance, monitoring urgent orders, or analyzing delays, this Excel template brings efficiency and insight directly to your fingertips.
Don’t let your supply chain run in the dark. Use this report to illuminate performance, reduce risk, and drive smarter decisions every day.
Frequently Asked Questions (FAQs)
1. Can I customize the Supply Chain Report in Excel for my business?
Yes! The template is fully customizable. You can add or remove columns, change KPIs, or adjust visuals based on your business needs.
2. Do I need advanced Excel skills to use this report?
Not at all. Basic Excel knowledge is enough. The template uses built-in charts, slicers, and formulas. No coding or macros required.
3. Can I use this report for multi-location supply chains?
Yes. You can track data by location and supplier. Use the slicers to filter and analyze each location’s performance individually.
4. What Excel version is compatible with this template?
The template works best with Excel 2016 and later, including Office 365 desktop versions.
5. How often should I update the data sheet?
That depends on your business. Daily, weekly, or monthly updates work depending on how fast your supply chain moves. Most businesses prefer a weekly cadence.
6. Can I share the report with others?
Absolutely. You can email the Excel file or share it via cloud services like OneDrive or Google Drive.
7. Can I connect this report to a database?
Yes. Advanced users can connect it to external databases using Power Query or Excel’s Data Connection tools.
Visit our YouTube channel to learn step-by-step video tutorials