Efficient production planning is the backbone of any manufacturing or operations-driven business. Without proper tracking, resource allocation, and performance monitoring, production delays, quality issues, and cost overruns can become the norm rather than the exception.
This is where a Production Planning Dashboard in Power BI comes into play. It transforms raw data into meaningful insights, allowing managers and planners to make quick, informed, and data-driven decisions.
In this comprehensive guide, we will explore the features, benefits, use cases, advantages, best practices, and common FAQs about using a Production Planning Dashboard in Power BI. Whether you’re new to Power BI or looking to optimize your current production monitoring system, this article will serve as your complete resource.
Click to Purchases Production Planning Dashboard in Power BI
What is a Production Planning Dashboard in Power BI?
A Production Planning Dashboard in Power BI is an interactive visual tool designed to monitor, analyze, and manage production activities in real time. It integrates with data sources (such as Excel, ERP systems, or manufacturing databases) and displays Key Performance Indicators (KPIs), trends, and analytics in an easy-to-understand format.
With this dashboard, managers can:
-
Track orders by status, category, plant, and production line
-
Monitor completion rates against planned targets
-
Evaluate planner performance
-
Identify monthly trends and delays
-
Compare actual production quantity vs. planned quantity
This helps ensure that production runs smoothly, resources are optimized, and business objectives are met on time.
Key Features of the Production Planning Dashboard in Power BI
Our ready-to-use Production Planning Dashboard comes with 5 interactive pages inside the Power BI Desktop application. Each page focuses on a different aspect of production analysis.
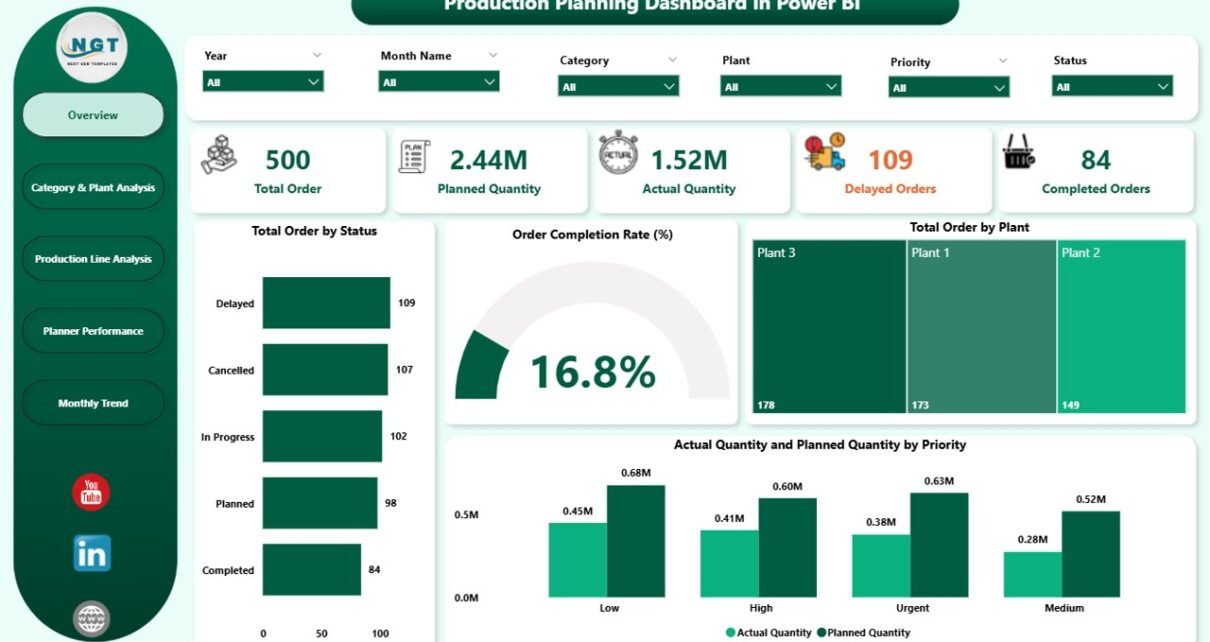
Overview Page – The Control Center
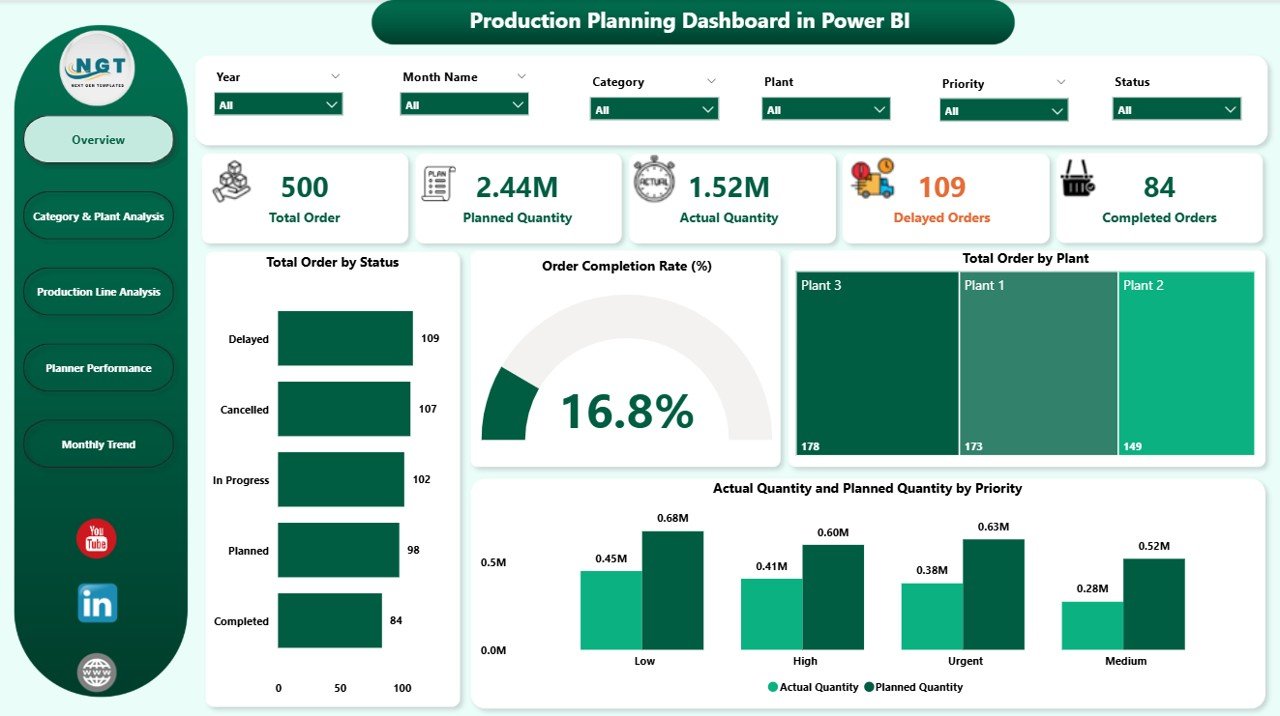
The Overview Page acts as the main dashboard hub.
Key Elements:
-
7 slicers for quick filtering (e.g., by date, plant, product category)
5 summary cards for instant KPI viewing:
- Total Orders
- Order Completion Rate (%)
- Pending Orders
- Completed Orders
- Cancelled Orders
4 interactive charts:
- Total Orders by Status
- Order Completion Rate (%)
- Total Orders by Plant
- Actual Quantity vs. Planned Quantity by Priority
This page provides a quick health check of production operations, helping decision-makers spot performance gaps at a glance.
Category & Plant Analysis – Product-Level Insights
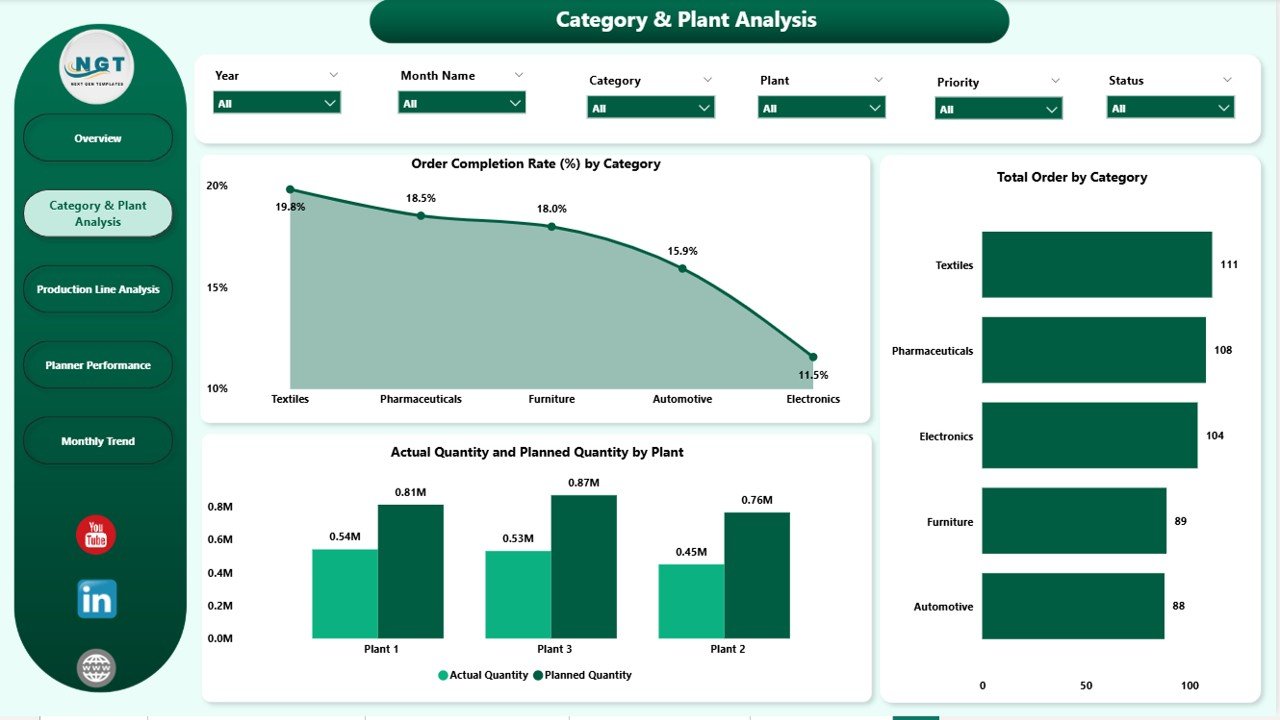
The Category & Plant Analysis Page helps identify how different product categories perform across various plants.
Key Elements:
-
7 slicers for flexible filtering
3 main charts:
- Total Orders by Category
- Order Completion Rate (%) by Category
- Actual vs. Planned Quantity by Category and Plant
This view is especially useful for identifying bottlenecks in specific plants or categories, allowing targeted process improvements.
Click to Purchases Production Planning Dashboard in Power BI
Production Line Analysis – Workflow Performance
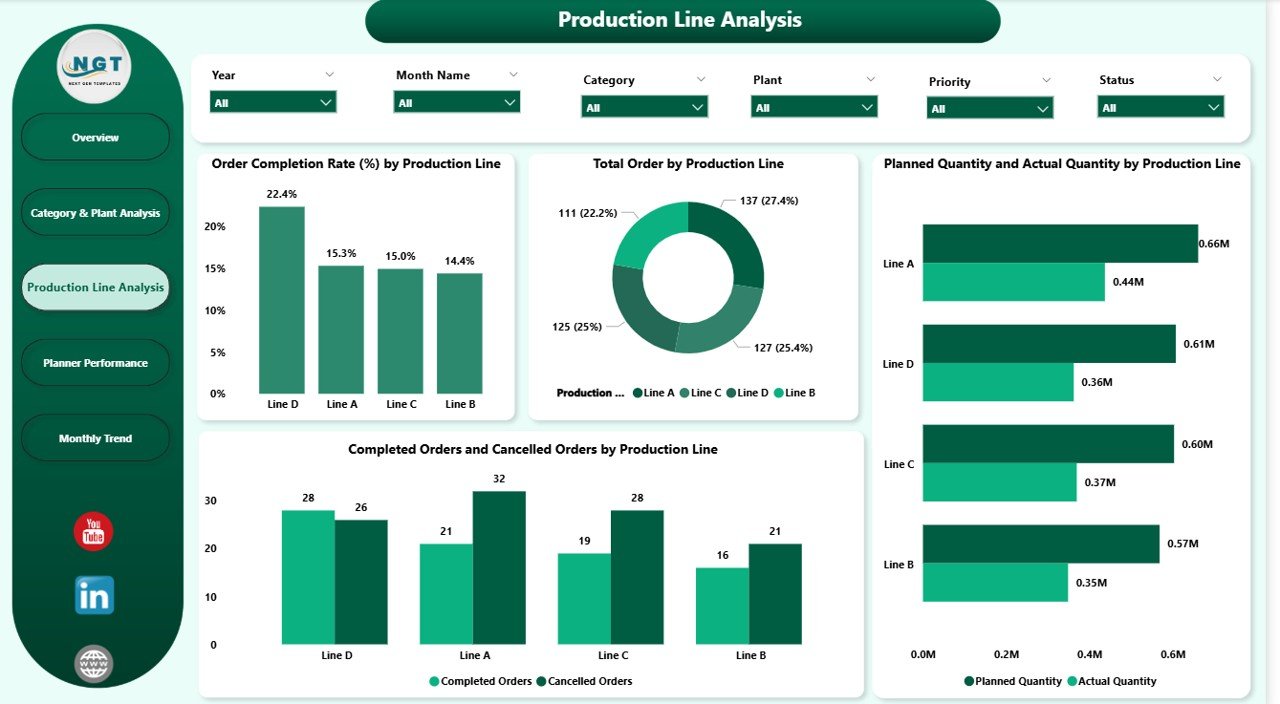
The Production Line Analysis Page focuses on operational efficiency by production line.
Key Elements:
-
7 slicers for detailed breakdowns
3 main charts:
- Total Orders by Production Line
- Order Completion Rate (%) by Production Line
- Completed Orders vs. Cancelled Orders by Production Line
- Planned vs. Actual Quantity by Production Line
This helps track equipment utilization, production speed, and error rates, ensuring smoother workflow management.
Planner Performance – Workforce Efficiency
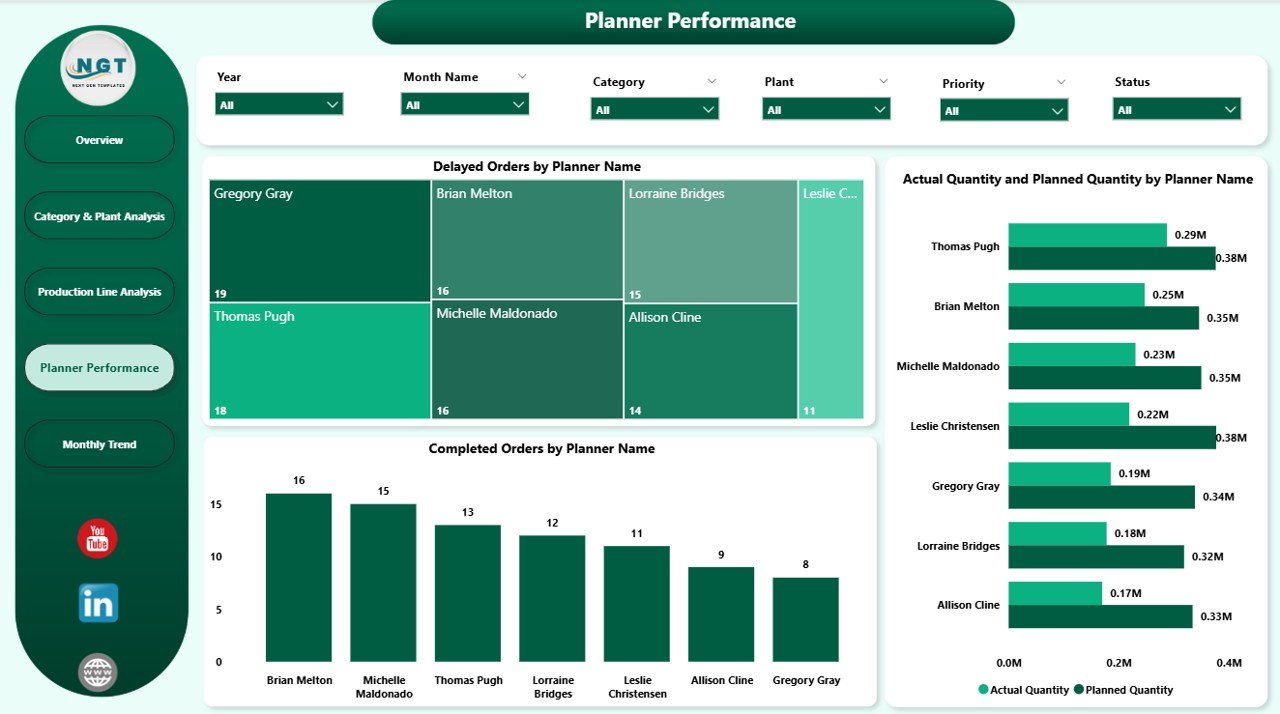
The Planner Performance Page evaluates the individual performance of planners in charge of scheduling and monitoring production.
Key Elements:
-
7 slicers for refined data selection
3 performance charts:
- Delayed Orders by Planner Name
- Actual vs. Planned Quantity by Planner
- Completed Orders by Planner
This enables performance benchmarking and identifies training or resource allocation needs.
Monthly Trends – Tracking Performance Over Time
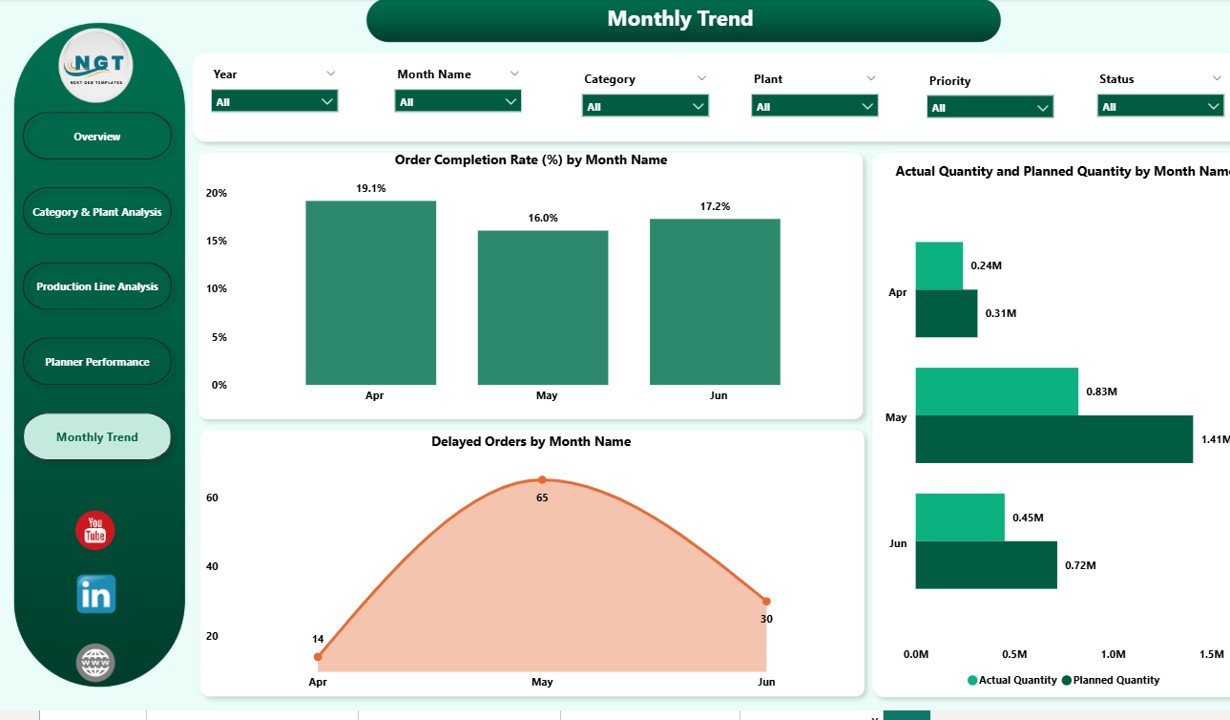
The Monthly Trends Page provides a time-based view of production data.
Key Elements:
-
7 slicers for flexible time-period analysis
Key charts:
- Profit Margin % by Month
- Revenue vs. Target by Month
- Order Completion Rate (%) by Month
- Actual vs. Planned Quantity by Month
- Delayed Orders by Month
This page helps identify seasonal patterns, recurring delays, and demand fluctuations, enabling better forecasting.
Why Use a Production Planning Dashboard in Power BI?
Here’s why integrating such a dashboard can be a game-changer for your operations:
-
Centralized Monitoring: All KPIs and reports in one platform
-
Real-Time Insights: Instant visibility into production status
-
Data Accuracy: Reduces manual reporting errors
-
Improved Decision-Making: Data-driven planning for efficiency
-
Trend Analysis: Identifies recurring issues and opportunities for improvement
Advantages of a Production Planning Dashboard in Power BI
-
Faster Decision-Making: Quickly see where production stands vs. targets
-
Better Resource Allocation: Assign resources to high-priority areas
-
Error Reduction: Spot discrepancies between planned and actual outputs
-
Performance Benchmarking: Compare plants, categories, and planners
-
Improved Communication: Shared dashboards keep teams aligned
Opportunities for Improvement in Production Planning Dashboards
While these dashboards are powerful, there’s always room for growth:
-
Integrating IoT Data: Connect with machine sensors for live equipment monitoring
-
Automating Data Refresh: Schedule automatic data pulls to reduce manual uploads
-
Adding Predictive Analytics: Use AI to forecast demand and production delays
-
Enhancing Mobile Access: Ensure dashboards are optimized for smartphones and tablets
Best Practices for Using a Production Planning Dashboard in Power BI
To get the best results, follow these best practices:
-
Use Clear Visuals: Avoid overcrowding charts with too many data points
-
Standardize KPIs: Ensure consistent definitions across departments
-
Schedule Regular Reviews: Check the dashboard weekly or monthly
-
Enable Drill-Through Options: Allow users to click into detailed reports
-
Combine Historical & Real-Time Data: This gives both context and accuracy
-
Train Users: Ensure all stakeholders know how to interact with the dashboard
Conclusion
A Production Planning Dashboard in Power BI is more than just a reporting tool—it’s a strategic asset for modern manufacturing and operations teams. With its visual clarity, real-time insights, and deep analysis capabilities, businesses can streamline production, reduce waste, and achieve operational excellence.
When combined with best practices, this dashboard can significantly improve productivity, efficiency, and profitability. Whether you’re managing one production line or an entire global operation, Power BI gives you the visibility and control you need.
Frequently Asked Questions (FAQs)
1. What data sources can be connected to the Production Planning Dashboard in Power BI?
You can connect Excel files, SQL databases, ERP systems like SAP, cloud services, and IoT devices.
2. How often should I update my dashboard data?
For accurate insights, set up daily or weekly refresh schedules. Real-time refresh is ideal for critical operations.
3. Can I customize the dashboard for my specific KPIs?
Yes. Power BI dashboards are fully customizable. You can add or remove KPIs based on your business needs.
4. Is Power BI suitable for small-scale manufacturing units?
Absolutely. Power BI can scale from small workshops to large multi-plant operations.
5. How secure is my data in Power BI?
Power BI uses enterprise-grade security features, including role-based access control and data encryption.
6. Can I view the dashboard on mobile devices?
Yes. Power BI offers a mobile app that allows you to view and interact with dashboards on smartphones and tablets.
Visit our YouTube channel to learn step-by-step video tutorials