In the era of digital and data-driven strategies, sports and entertainment organizations are looking for practical ways to track fan engagement. As a result, fan behavior analytics has become one of the most popular areas of focus. With the Fan Engagement KPI Dashboard in Power BI, you can monitor and improve fan interaction in real time. This article will walk you through everything you need to know about this dashboard — from its core features to its practical benefits and best practices — so you can use it confidently.
Click to Purchases Fan Engagement KPI Dashboard in Power BI
What Is a Fan Engagement KPI Dashboard in Power BI?
A Fan Engagement KPI Dashboard in Power BI is a dynamic visual reporting tool that allows you to track and evaluate key performance indicators related to the way fans interact with your organization.
It uses data collected in Excel (or another platform) and transforms it into insightful visual reports that help you understand whether your engagement strategies work.
The dashboard focuses on both Month-to-Date (MTD) and Year-to-Date (YTD) performance, offering a consistent way to compare actual figures against both targets and last year’s results.
Why Do You Need a Fan Engagement KPI Dashboard?
Every organization wants to build long-term relationships with fans. However, without tracking the right metrics, it becomes difficult to know if engagement campaigns deliver any real value.
This dashboard helps you to:
-
Identify which campaigns perform well
-
Spot drop-offs before they become major problems
-
Align departments based on real data
-
Compare current engagement levels with targets and previous results
-
Optimize decision making based on real-time performance
Main Components of the Fan Engagement KPI Dashboard
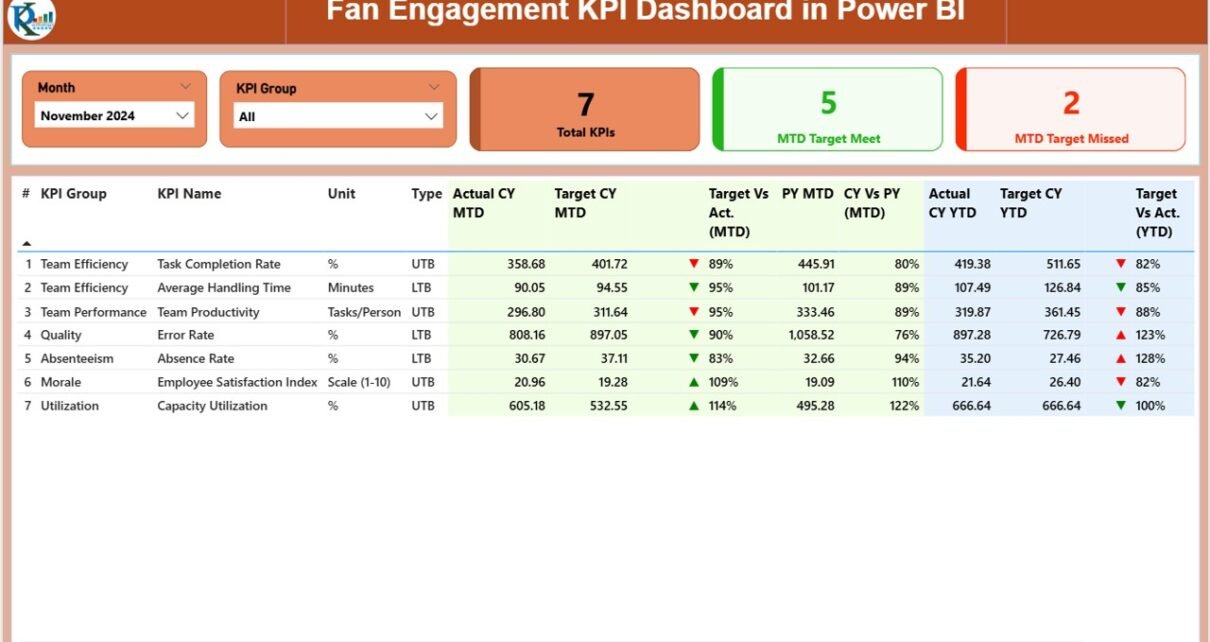
Summary Page – Your Real-Time Overview
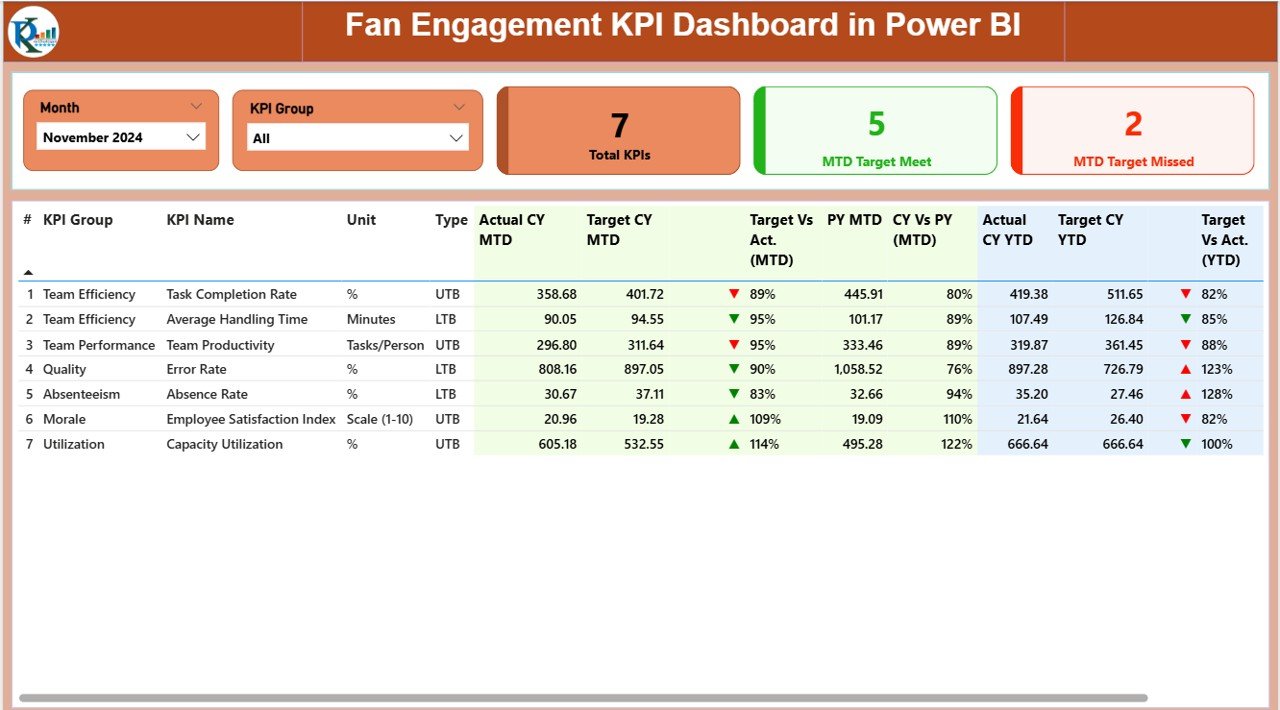
The Summary Page is the core of the dashboard. It gives a quick overview of all KPIs and tells you exactly where you stand.
On this page, you will find:
-
Month and KPI Group slicers – to filter the data instantly
3 KPI cards that show:
- Total number of KPIs
- Number of KPIs meeting the current month’s target
- Number of KPIs missing the target
KPI Trend Page – Analyze Changes Over Time
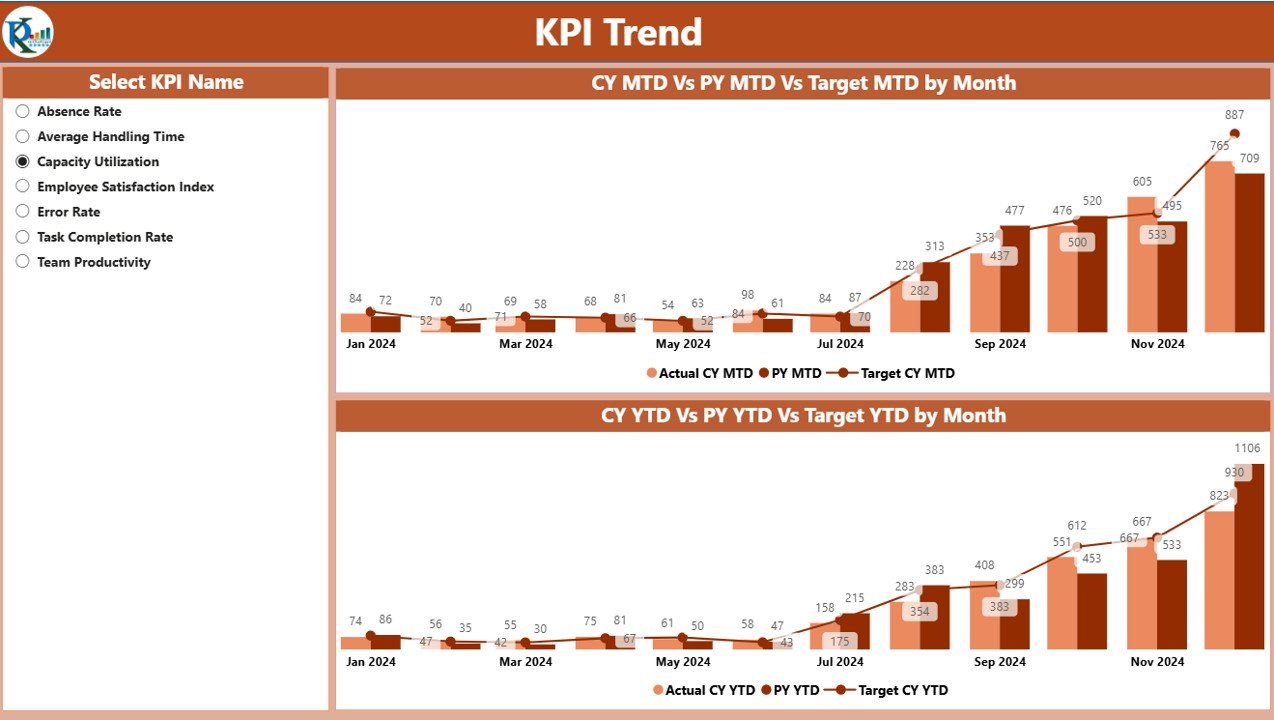
The KPI Trend page shows visual trends for each KPI over time.
It includes two combo charts:
-
One for MTD Actual, MTD Target, and MTD Previous Year
-
One for YTD Actual, YTD Target, and YTD Previous Year
A slicer on the left allows you to select a specific KPI.
This makes it extremely simple to examine month-by-month performance and identify consistent trends or sudden changes.
KPI Definition Page – Drill Down into KPI Details
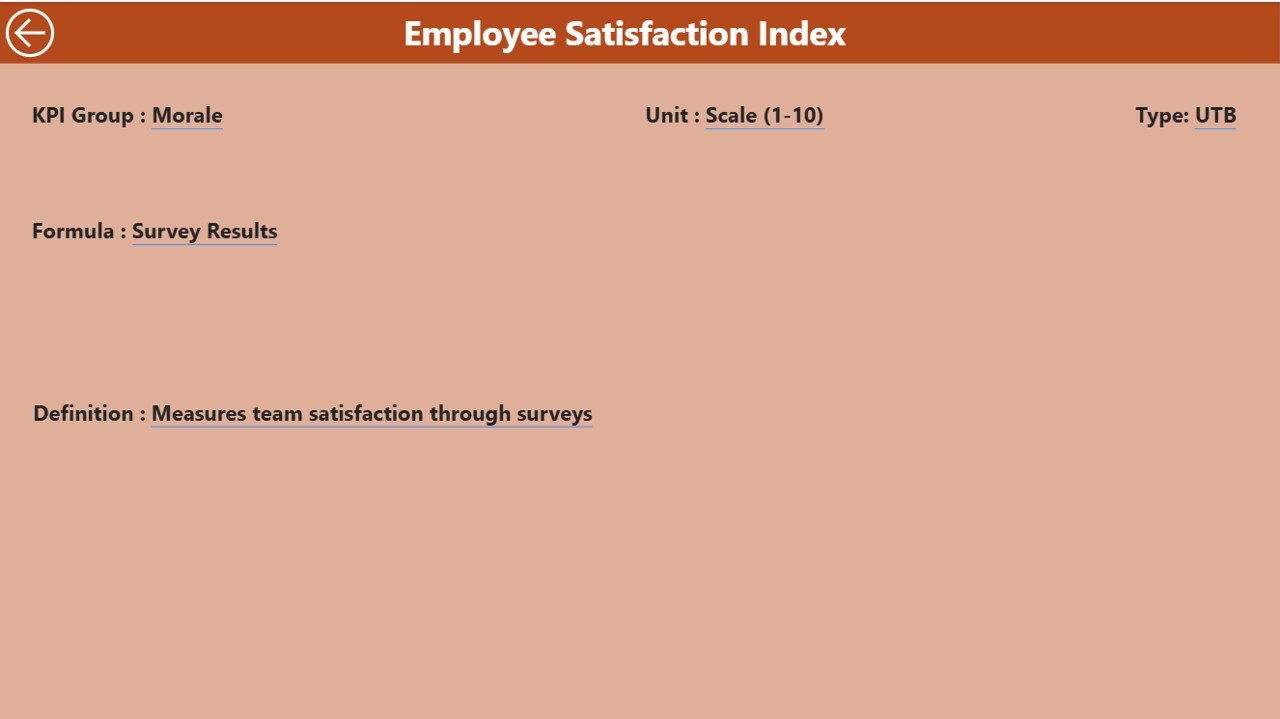
The KPI Definition page is a hidden drill-through page.
From the Summary Page, you can right-click any KPI and drill through to see:
-
KPI Formula
-
KPI Definition
-
KPI Group and Unit
-
KPI Type (LTB or UTB)
It allows deeper understanding without overwhelming the main dashboard.
How Does the Excel Data Structure Work?
The dashboard pulls the source data from an Excel file.
This file contains the following three worksheets:
✅ Always use the first date of the month as the reference date in the Excel sheets.
✅ Make sure KPI Names and Groups stay consistent across all three sheets.
Advantages of Fan Engagement KPI Dashboard in Power BI
-
Instant Visibility — You get clear insights into engagement levels in real time.
-
Data-Driven Decision Making — You can decide what to improve without guessing.
-
Better Campaign Planning — You understand peak periods and low-performing areas.
-
Comparative Analysis — You can compare current results with both targets and last year’s results.
-
User-Friendly Interface — Power BI allows you to interact with data using filters, slicers, drill-through, and tooltips.
-
Easy Integration — The dashboard pulls data directly from your existing Excel sources.
How to Build This Dashboard (Step-by-Step)
Click to Purchases Fan Engagement KPI Dashboard in Power BI
Step 1 – Prepare Your Excel Data
-
Create the three Excel sheets (Input_Actual, Input_Target, KPI_Definition).
-
Fill each sheet with your KPI data (MTD, YTD, Target, Definition, etc.).
-
Use the same KPI Name in all sheets to avoid breakages.
Step 2 – Connect Excel to Power BI
-
Open Power BI Desktop
-
Click Get Data → Excel
-
Select the 3 sheets
-
Load them into the model.
Step 3 – Build Relationships
-
Make sure the KPI Name field connects the tables correctly.
-
Set relationships with Single Direction from KPI Definition → Input tables.
Step 4 – Create the Summary Page
-
Add slicers for Month and KPI Group.
-
Insert 3 KPI cards for quick results.
-
Add a table visual and include all MTD and YTD values.
Step 5 – Add Icons for Performance Indicators
-
Use DAX to create a Status Icon column.
-
Show ▲ if Actual ≥ Target and ▼ if Actual < Target.
Step 6 – Create Combo Charts for Trends
-
Insert combo charts on the KPI Trend Page.
-
Show Actual, Target, and PY for both MTD and YTD.
Step 7 – Set Up Drill-Through Page
-
Add a page called KPI Definition.
-
Insert a table that contains KPI definition fields.
-
Enable Drill-through on the KPI Name field.
Best Practices for Fan Engagement KPI Dashboard in Power BI
-
Use simple and consistent KPI names
This avoids mismatch issues while linking the tables. -
Avoid overcrowding visuals
Too many visuals in one place reduce the clarity of the dashboard. -
Update Excel data every month
Regular updates ensure accurate MTD and YTD tracking. -
Use conditional formatting wisely
Icons and colors make the dashboard more readable. -
Validate all DAX formulas
Test each formula before presenting the dashboard to stakeholders. -
Use descriptive tooltip text
Tooltips help users understand KPIs without leaving the page.
Conclusion
A Fan Engagement KPI Dashboard in Power BI offers a powerful and easy-to-use analytics solution.
It tracks real-time performance, supports data-driven decision making, and helps you compare current results with past values.
With a well-structured Excel data input and a carefully designed Power BI interface, you can monitor engagement, improve performance, and build a stronger relationship with your fans.
Frequently Asked Questions
Q1. What is the main purpose of a Fan Engagement KPI Dashboard?
The main purpose is to track, measure, and improve the way fans interact with your organization by using real-time performance indicators.
Q2. Which metrics should I track in a Fan Engagement KPI Dashboard?
You should track metrics such as attendance rate, social media engagement, content interaction, membership renewals, and event participation.
Q3. Can I customize the dashboard based on my own KPIs?
Yes, Power BI allows full customization. You can use your own KPI definitions and update the Excel source tables with your own values.
Q4. How often should I update the dashboard data?
You should update the dashboard at least once every month to ensure accurate MTD and YTD analysis.
Q5. Do I need advanced Power BI skills to use this dashboard?
No. Once the dashboard is set up, you only need basic Power BI skills to navigate and filter the data.
Visit our YouTube channel to learn step-by-step video tutorials