Recruitment is the lifeline of every growing organization. Without a structured hiring process, your team could spend precious time chasing unqualified candidates, losing top talent to competitors, and failing to track where improvements are required. Fortunately, using a Recruitment and Hiring Report in Excel helps you turn scattered recruitment data into clear, actionable insights.
In this article, you will learn how a Recruitment and Hiring Report in Excel works, why your HR team should use one, and what best practices you need to follow to get the most value.
Let us dive in step-by-step and discover how this simple yet powerful tool supports data-driven recruitment.
What Is a Recruitment and Hiring Report in Excel?
Click to Purchases Recruitment and Hiring Report in Excel
A Recruitment and Hiring Report is a ready-to-use, easy-to-customize Excel dashboard that provides detailed insights about your hiring activities. It captures your entire recruitment funnel — from total applicants and interviews to final hiring numbers — and displays key metrics in charts, cards, and tables.
You can easily monitor trends and answer questions like:
-
How many candidates did we receive this month?
-
Which department has the highest hiring success rate?
-
Which source delivers the most experienced candidates?
-
Which interviewer has the highest hiring rate?
Why Do You Need a Recruitment and Hiring Report?
Recruitment is no longer just about screening resumes and conducting interviews. Modern hiring teams must take quick and informed decisions to stay competitive. And therefore, an Excel-based recruitment report becomes a valuable tool for several reasons:
✅ Tracks each stage of the hiring funnel
✅ Allows quick comparison across departments and sources
✅ Highlights inefficiencies to improve the process
✅ Provides transparency for leadership and HR managers
✅ Makes decision-making faster and more accurate
Key Features of the Recruitment and Hiring Report in Excel
The template usually includes 3 main pages and 1 support sheet:
Summary Page
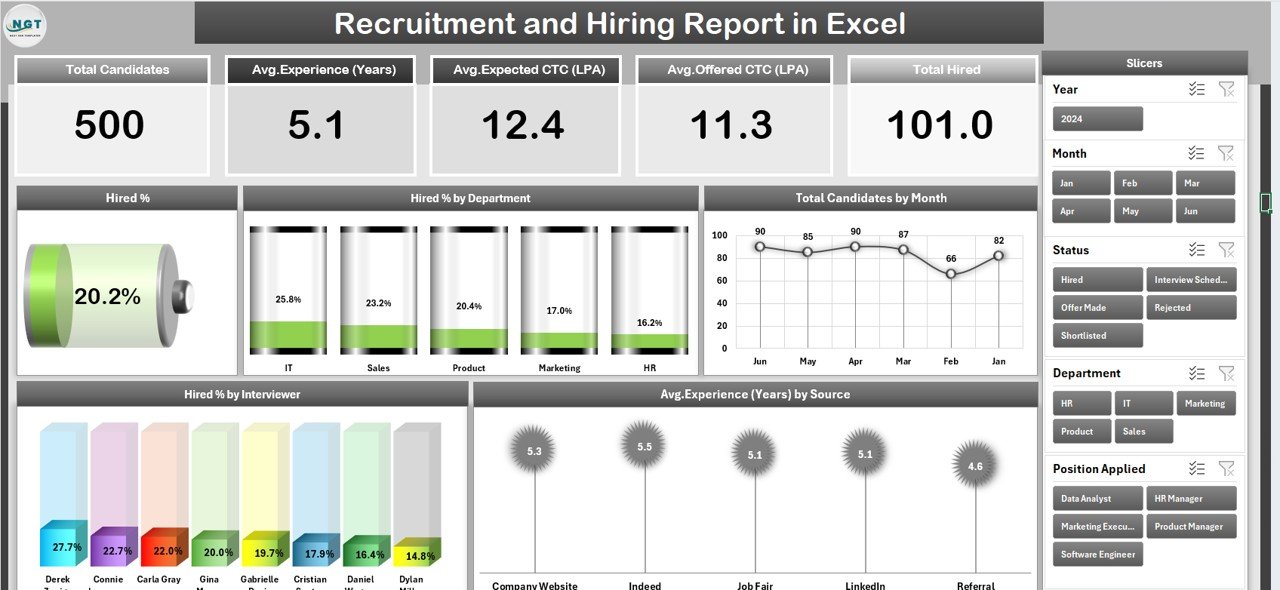
This is the primary dashboard and provides an at-a-glance view of top metrics. It contains:
-
Top 5 KPI Cards such as Total Hired, Interviews Conducted, Average Experience and Total Candidates.
-
Right-side Slicer to filter analysis by Department, Source, Interviewer and Date.
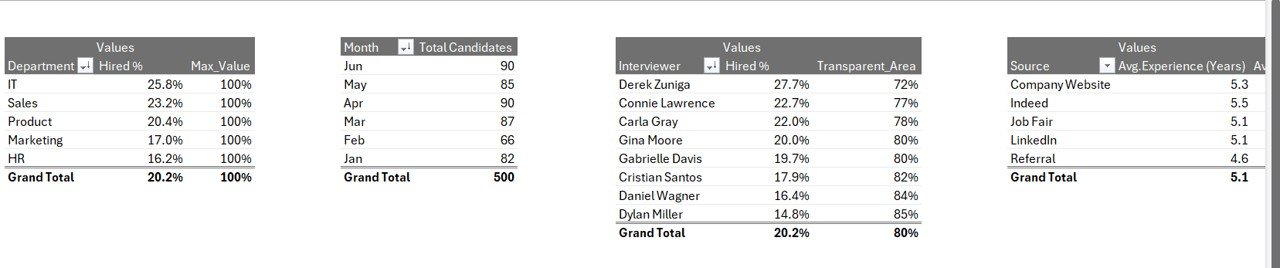
5 Interactive Charts:
- Overall Hired %
- Hired % by Department
- Total Candidates by Month
- Hired % by Interviewer
- Avg. Experience (Years) by Source
Click to Purchases Recruitment and Hiring Report in Excel
Report Page
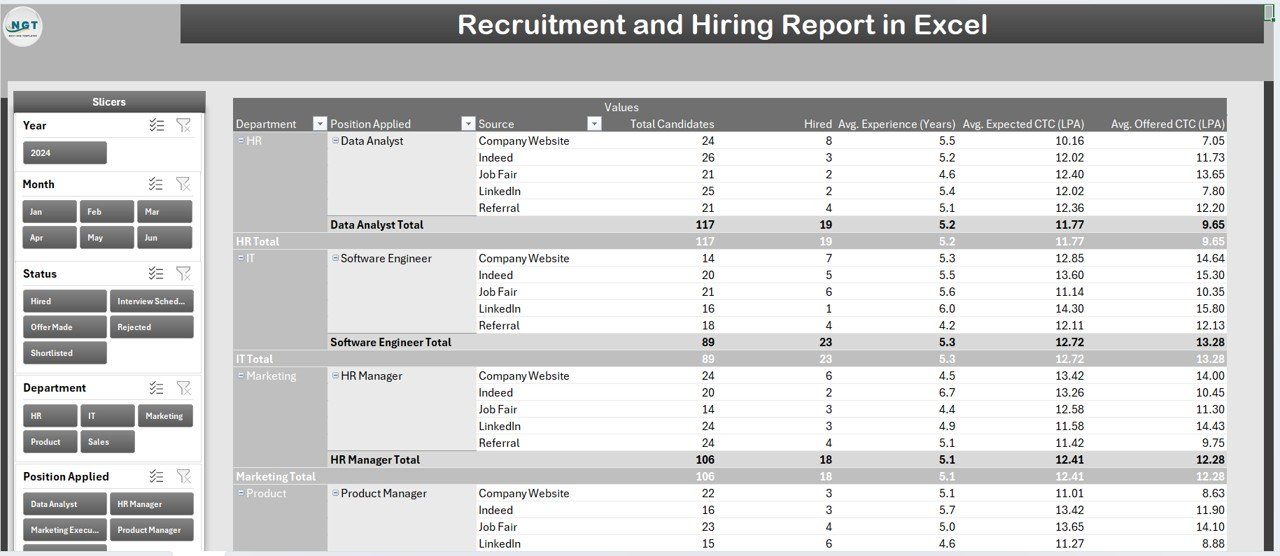
This page includes:
-
Left-side Slicer for multi-level filtering
-
Information Table with detailed applicant data
Data Sheet
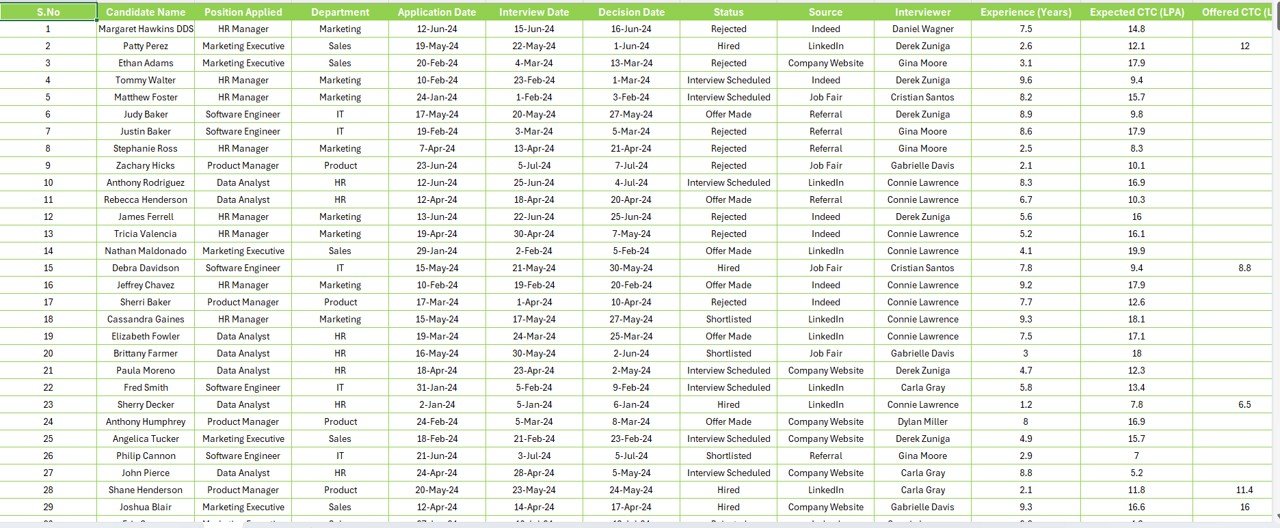
The back-end sheet where all raw recruitment events are captured.
Support Sheet
Reference lists used in filters, dropdowns, slicers, department names, interviewers, etc.
How Does Excel Help in Recruitment Reporting?
Excel provides formulas, Pivot Tables, and interactive slicers that help turn plain data into meaningful trends. Because of its flexibility, you can easily update the dataset and the dashboard adjusts automatically.
With proper use of Pivot Charts, Slicers and Conditional Formatting, recruiters can:
-
Spot hiring delays early
-
Compare performance between recruiters
-
Find the best sourcing channels
-
Analyze month-over-month progress
Advantages of Using a Recruitment and Hiring Report in Excel
Using Excel for recruitment analytics brings many practical benefits. Below are the top advantages:
✅ Central Visibility
You get all critical hiring metrics in one single dashboard. No more jumping between spreadsheets and emails.
✅ Faster Recruitment Decisions
Interactive charts reveal problem areas instantly so you can take action without wasting time.
✅ Easy Customization
You can add or remove KPIs depending on your organization’s hiring goals.
✅ Data-Driven Planning
Managers get access to real-time data and can easily adjust strategies.
✅ Cost-Effective
Excel does not require any additional software license. You only need a predefined template.
Best Practices for the Recruitment and Hiring Report in Excel
To keep your report accurate, insightful and easy to use, follow these best practices:
✔ Define Clear KPIs
Select only the KPIs that directly align with your recruitment strategy. Do not overload the dashboard with too many numbers.
✔ Maintain Data Consistency
Use dropdowns in the Data Sheet so that department names, sources and interviewers remain consistent.
✔ Update Regularly
Refresh the data weekly or monthly to ensure the report always gives real-time insight.
✔ Use Pivot Slicers
Slicers allow HR managers to filter data interactively and quickly focus on specific categories.
✔ Keep Your Layout Clean
Use proper white space and avoid excessive colors. Clean dashboards improve readability and decision making.
How to Use the Recruitment and Hiring Report (Step-by-Step)
Step 1 – Collect Data
Gather all candidate data including application date, department, source, interviewer, experience and hiring status.
Step 2 – Maintain the Data Sheet
Enter or link all raw recruitment data into the Data Sheet. Use drop-down lists to avoid inconsistencies.
Step 3 – Refresh the Pivot Tables
Once the data is updated, click Refresh All so that all tables and charts reflect the new information.
Step 4 – Analyze the Summary Page
Use slicers to filter analysis by Department, Interviewer or Source. Review charts and KPI cards for quick insight.
Step 5 – Drill Down Using the Report Page
Navigate to the Report Page and apply multiple filters to view more detailed data about specific candidates.
Opportunities for Improvement in the Recruitment Process (Based on the Report)
-
Reduce time-to-hire by identifying bottlenecks in the interview phase
-
Improve sourcing strategy by focusing on high-performing channels
-
Increase hiring quality by tracking interviewer success rate
-
Align HR and business goals by closely monitoring hiring % by department
Conclusion
A Recruitment and Hiring Report in Excel is not just a dashboard — it is a strategic decision-making tool. It allows HR teams to evaluate performance, find gaps in the recruitment funnel, and improve the quality of hires in a measurable way.
By following the best practices and regularly updating the report, organizations can attract the right talent at the right time and stay ahead in the competitive landscape.
Frequently Asked Questions
Q1. What is the purpose of a Recruitment and Hiring Report in Excel?
The purpose is to provide a clear and structured view of all recruitment activities. It helps HR teams track hiring performance, understand trends, and improve decision making.
Q2. Can I customize the Recruitment Report to include new KPIs?
Yes. Excel gives full flexibility to add new KPIs, filters or charts based on your organization’s needs.
Q3. How often should I update the recruitment data?
You should update the report at least once every month. For fast-moving recruitment environments, a weekly update is recommended.
Q4. Do I need advanced Excel skills to use this template?
No. Basic knowledge of Pivot Tables and slicers is enough to refresh the data and navigate the dashboard.
Q5. Can I use this report for different departments?
Yes. You can filter the dashboard by department and track hiring progress independently for each business unit.
Visit our YouTube channel to learn step-by-step video tutorials