Managing mental health services requires more than dedication—it requires actionable insights. Healthcare leaders must track patient outcomes, therapy effectiveness, resource utilization, and compliance with regulations. Without a proper system, monitoring becomes inconsistent, decisions become delayed, and service quality declines.
This is where the Mental Health Services KPI Dashboard in Power BI comes in. It transforms raw data into clear insights, allowing organizations to track performance, identify challenges, and improve care delivery. With interactive visuals, trend analysis, and real-time updates, this dashboard makes it easy to manage mental health operations effectively.
In this article, we will explore everything you need to know about the Mental Health Services KPI Dashboard in Power BI, including its features, advantages, best practices, and real-world applications.
Click to Purchases Mental Health Services KPI Dashboard in Power BI
What Is a Mental Health Services KPI Dashboard in Power BI?
A Mental Health Services KPI Dashboard in Power BI is a prebuilt analytics solution designed for healthcare providers, clinics, and non-profit organizations offering mental health services. It helps track Key Performance Indicators (KPIs) such as:
-
Number of patients treated
-
Average waiting time for appointments
-
Therapy session completion rates
-
Patient satisfaction levels
-
Compliance with mental health regulations
-
Staff productivity and workload
Instead of manually preparing reports in Excel or paper-based systems, this dashboard allows healthcare managers to visualize KPIs instantly. With filters, slicers, and drill-through features, users can explore performance across departments, programs, and time periods.
Key Features of the Mental Health Services KPI Dashboard
The Mental Health Services KPI Dashboard in Power BI includes multiple pages that provide both a high-level overview and in-depth analysis.
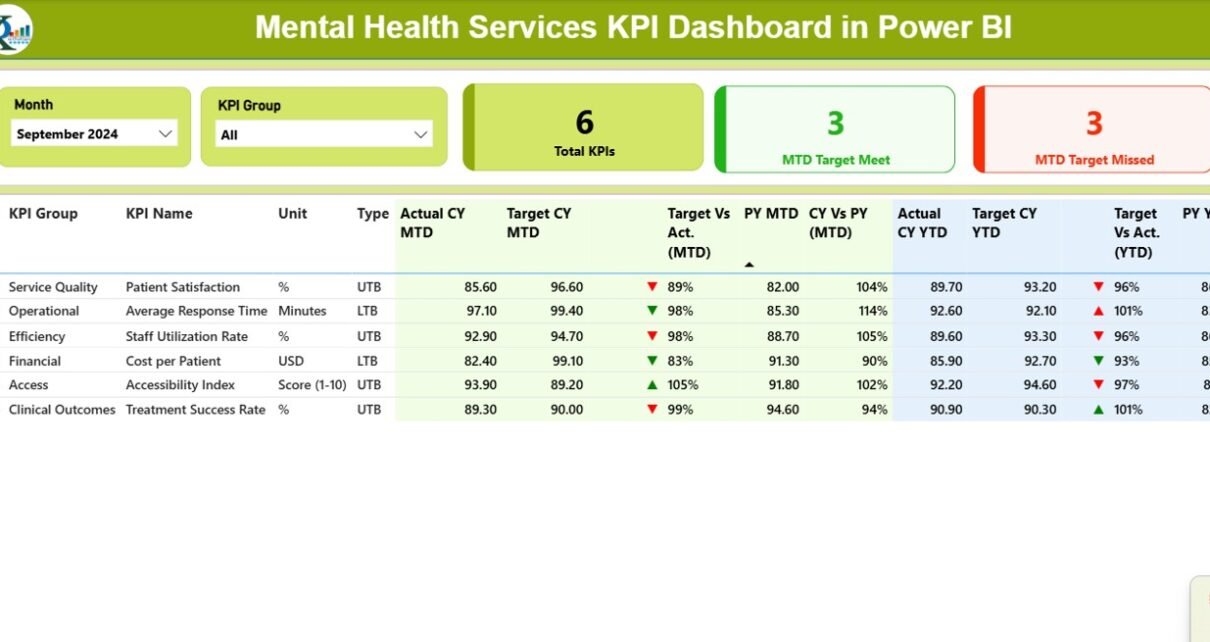
Summary Page
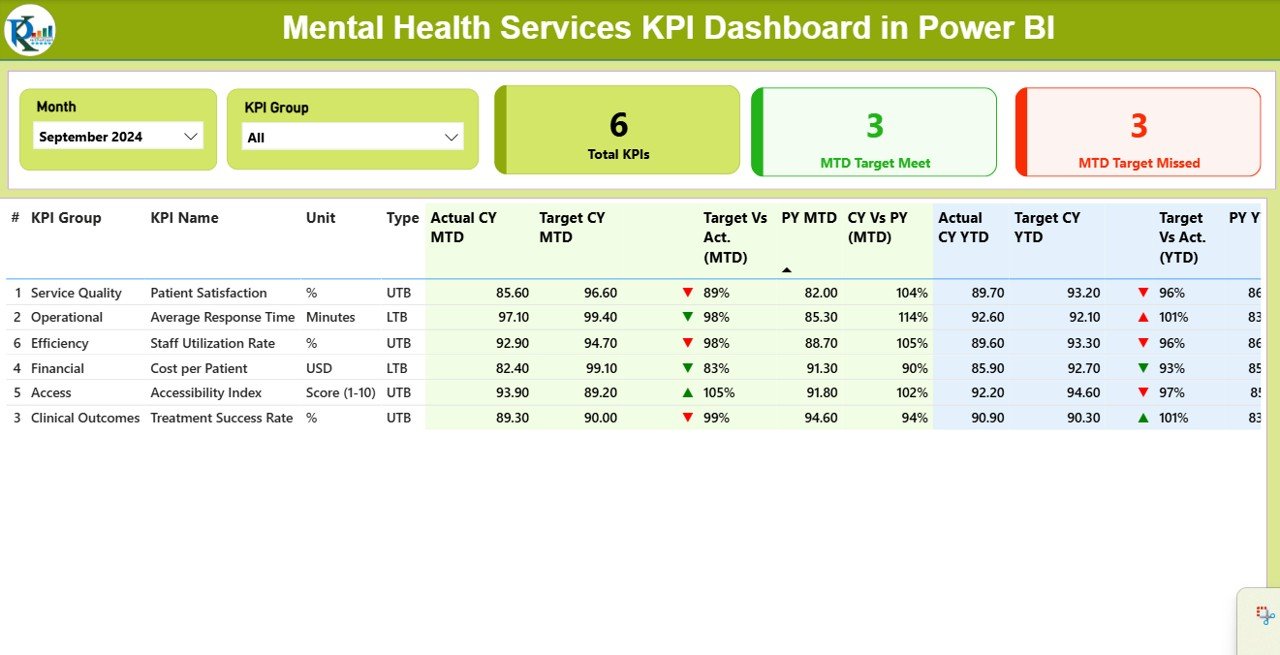
The Summary Page is the main hub of the dashboard. It provides:
-
Month and KPI Group slicer: Quickly filter data by month or KPI category.
-
Cards: Displaying total KPIs, number of KPIs meeting the target (MTD), and those missing the target (MTD).
Detailed KPI table: Showing information such as:
Click to Purchases Mental Health Services KPI Dashboard in Power BI
- KPI Number
- KPI Group
- KPI Name
- Unit of measurement
- Type (LTB = Lower the Better, UTB = Upper the Better)
- Actual CY MTD (Current Year Month-to-Date)
- Target CY MTD
- MTD Icon (red ▼ or green ▲ for performance)
- Target vs. Actual (MTD %)
- Previous Year MTD (PY MTD)
- CY vs. PY (MTD %)
- Actual CY YTD (Year-to-Date)
- Target CY YTD
- YTD Icon (status indicator)
- Target vs. Actual (YTD %)
- PY YTD
- CY vs. PY (YTD %)
This table makes it easy to evaluate progress against both monthly and yearly targets, with clear icons showing which KPIs are on track.
KPI Trend Page
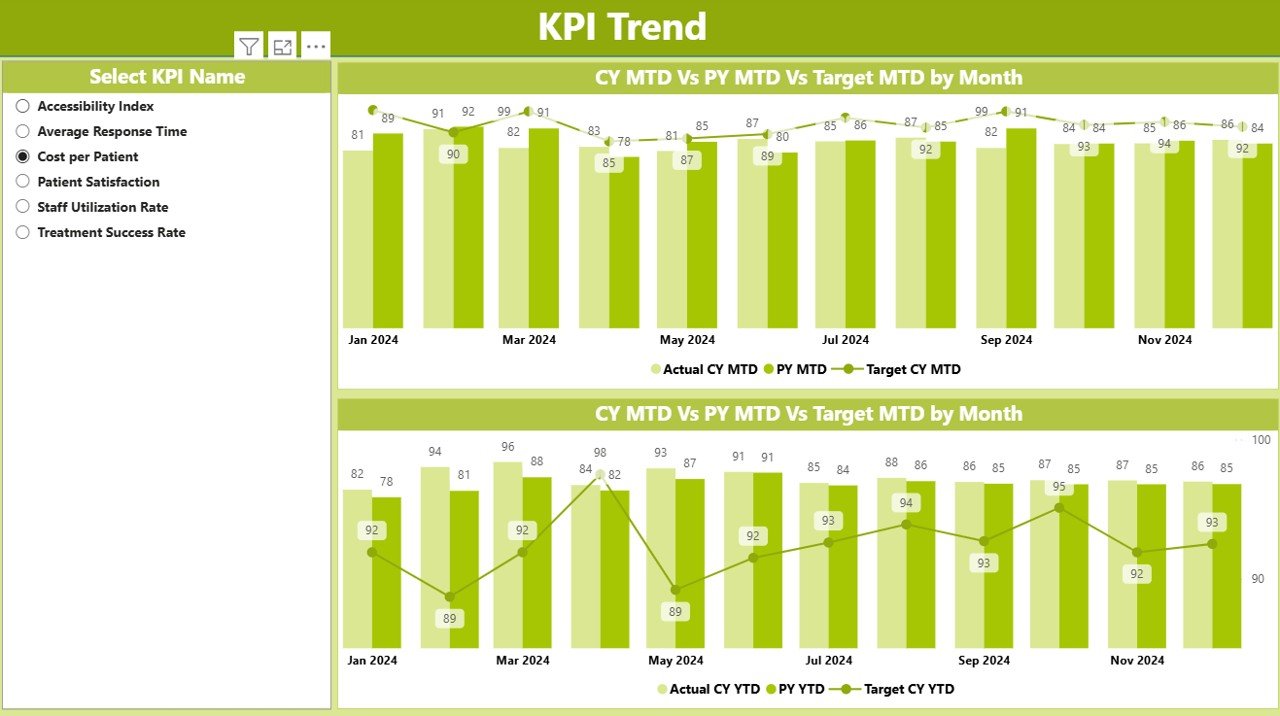
The KPI Trend Page is ideal for analyzing historical performance. It includes:
-
Combo charts: Comparing Actuals (Current Year and Previous Year) against Targets.
-
MTD and YTD trends: See short-term and long-term performance in one place.
-
Interactive slicer: Select a specific KPI to visualize its performance over time.
This page is useful for spotting trends, identifying seasonal variations, and understanding whether interventions are improving outcomes.
KPI Definition Page
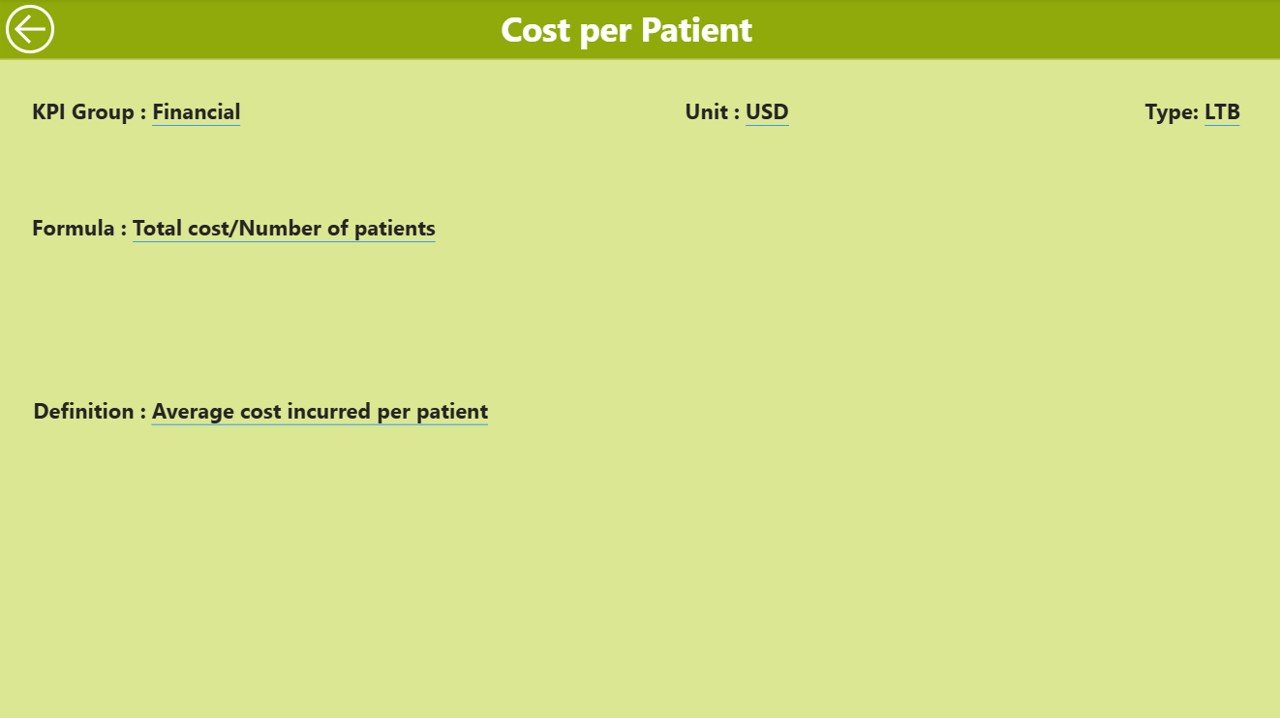
The KPI Definition Page provides documentation and clarity. It is hidden by default but can be accessed through drill-through navigation.
Here, users can see:
-
KPI Number
-
KPI Group
-
KPI Name
-
Unit of measurement
-
Formula
-
Definition
-
KPI Type (LTB or UTB)
This ensures transparency and consistency. For example, if a KPI measures “Patient Satisfaction %”, the definition explains exactly how the score is calculated.
Data Source: Excel Integration
The dashboard is powered by an Excel data source, making it easy to update and maintain. The Excel file includes three worksheets:
Input_Actual Sheet:
- Contains actual KPI values by month.
- Records MTD and YTD numbers.
Input_Target Sheet:
- Contains target KPI values by month.
- Records MTD and YTD targets.
KPI Definition Sheet:
- Stores KPI Number, KPI Group, KPI Name, Unit, Formula, Definition, and Type.
With these sheets, even non-technical staff can update data without advanced Power BI knowledge.
Why Do Mental Health Organizations Need KPI Dashboards?
Mental health organizations face unique challenges. Unlike other healthcare services, outcomes are not always immediate or easy to measure. A patient may attend therapy sessions for months before significant progress appears. In such cases, monitoring KPIs helps track incremental improvements and ensure resources are used effectively.
Key benefits of KPI dashboards include:
-
Transparency: Staff and stakeholders can clearly see what is working and what needs attention.
-
Efficiency: Instead of spending hours creating manual reports, managers can focus on service delivery.
-
Accountability: KPIs set clear expectations for performance and compliance.
-
Continuous improvement: Tracking trends helps organizations refine treatment approaches.
Advantages of the Mental Health Services KPI Dashboard
Here are the top advantages:
📊 Real-time insights: See updated performance data instantly.
⚡ Time-saving: Reduce manual reporting effort by automating analysis.
🔎 Transparency: Make data-driven decisions based on clear KPIs.
📈 Trend visibility: Compare Current Year vs. Previous Year data easily.
✅ Goal tracking: Identify KPIs meeting or missing targets.
🧑⚕️ Healthcare focus: Monitor therapy, counseling, and patient engagement KPIs.
🛠 Customizable: Add or modify KPIs based on organizational needs.
🌍 Scalable: Suitable for clinics, hospitals, NGOs, and government mental health programs.
Best Practices for the Mental Health Services KPI Dashboard
To maximize the value of your dashboard, follow these best practices:
Define Clear KPIs
- Ensure every KPI has a clear definition and formula.
- Example: “Therapy Completion Rate = Completed Sessions / Scheduled Sessions × 100”.
Keep Data Updated
- Regularly update Excel sheets with the latest actuals and targets.
- Schedule monthly or weekly updates for accuracy.
Use Drill-Through Features
- Encourage users to explore definitions and details when interpreting KPIs.
Highlight Critical Metrics
- Use icons and conditional formatting to focus attention on underperforming KPIs.
Involve All Stakeholders
- Share dashboards with clinical staff, managers, and administrators for collective improvement.
Ensure Privacy & Compliance
- Anonymize patient data when necessary.
- Comply with HIPAA, GDPR, and other healthcare regulations.
Train Users
- Provide training so staff can interpret data correctly.
- Encourage self-service analysis in Power BI.
Real-World Applications of the Dashboard
The Mental Health Services KPI Dashboard can be applied in multiple scenarios:
-
Hospitals and Clinics: Tracking patient outcomes and treatment efficiency.
-
NGOs and Non-profits: Monitoring program effectiveness and donor-funded initiatives.
-
Government Programs: Ensuring public health services meet mental health goals.
-
Corporate Wellness Programs: Evaluating employee mental health initiatives.
-
Universities and Schools: Tracking counseling service utilization and student well-being.
Conclusion
Click to Purchases Mental Health Services KPI Dashboard in Power BI
The Mental Health Services KPI Dashboard in Power BI is more than a reporting tool—it is a complete performance management system. It provides real-time insights, saves time, and promotes data-driven decisions in mental health organizations. By adopting this dashboard, organizations can improve service quality, enhance transparency, and ensure better patient outcomes.
Frequently Asked Questions (FAQs)
1. What is a Mental Health Services KPI Dashboard?
It is a Power BI dashboard that tracks performance metrics in mental health organizations, such as patient outcomes, staff productivity, and compliance.
2. How is the data updated in the dashboard?
The dashboard connects to Excel sheets where staff input actuals, targets, and KPI definitions. Updates reflect automatically in Power BI.
3. Can I customize the KPIs in this dashboard?
Yes. You can add, remove, or modify KPIs based on your organization’s needs by updating the KPI Definition sheet.
4. Is this dashboard suitable for small clinics?
Absolutely. It is scalable and works for small clinics, hospitals, NGOs, or large government programs.
5. How does this dashboard improve patient care?
By tracking key metrics like therapy completion, waiting time, and satisfaction, managers can make informed decisions to improve patient outcomes.
6. Do I need Power BI expertise to use this dashboard?
No. Basic training is enough. Most updates are done via Excel, while Power BI handles visualization and analysis.
7. Is the dashboard compliant with healthcare regulations?
Yes. As long as you input anonymized or compliant data, the dashboard can be used under HIPAA, GDPR, and other standards.
Visit our YouTube channel to learn step-by-step video tutorials