Research institutions thrive on innovation, discovery, and collaboration. Yet, without proper performance measurement, even the most promising projects can lose direction. Monitoring the right Key Performance Indicators (KPIs) ensures that resources, time, and funding align with institutional goals.
This is where the Research Institutions KPI Dashboard in Excel becomes invaluable. Built entirely in Excel, this dashboard provides a clear, interactive, and structured way to track metrics that matter the most. It transforms raw data into insights, enabling institutions to evaluate progress, identify bottlenecks, and make informed decisions.
In this article, we will dive deep into what this dashboard is, its structure, the features of each worksheet, its benefits, opportunities for improvement, and the best practices for using it effectively. By the end, you will have a detailed roadmap to manage your research projects and institutional KPIs in a systematic and data-driven way.
Click to Purchases Research Institutions KPI Dashboard in Excel
What Is a Research Institutions KPI Dashboard in Excel?
A Research Institutions KPI Dashboard in Excel is a structured tool designed to track, monitor, and analyze performance indicators specific to research environments. From the number of active projects and funding utilization to publication outputs and collaboration levels, KPIs in research institutions capture the entire spectrum of activities.
Unlike expensive business intelligence tools, this Excel dashboard is lightweight, customizable, and accessible to anyone with basic Excel skills. You don’t need programming or technical expertise—built-in formulas, conditional formatting, and pivot charts handle the complexity.
Key Features of the Research Institutions KPI Dashboard
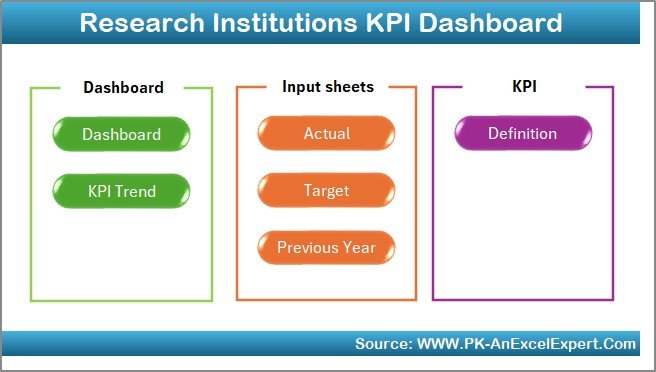
The dashboard contains seven main worksheets, each with a distinct role. Together, they create a cohesive and interactive performance monitoring system.
Home Sheet
-
Acts as the index page of the dashboard.
-
Includes buttons to navigate to other sheets quickly.
-
Simplifies user interaction by allowing anyone to jump directly to the desired section without scrolling or searching.
This design ensures efficiency, especially when multiple stakeholders use the same file.
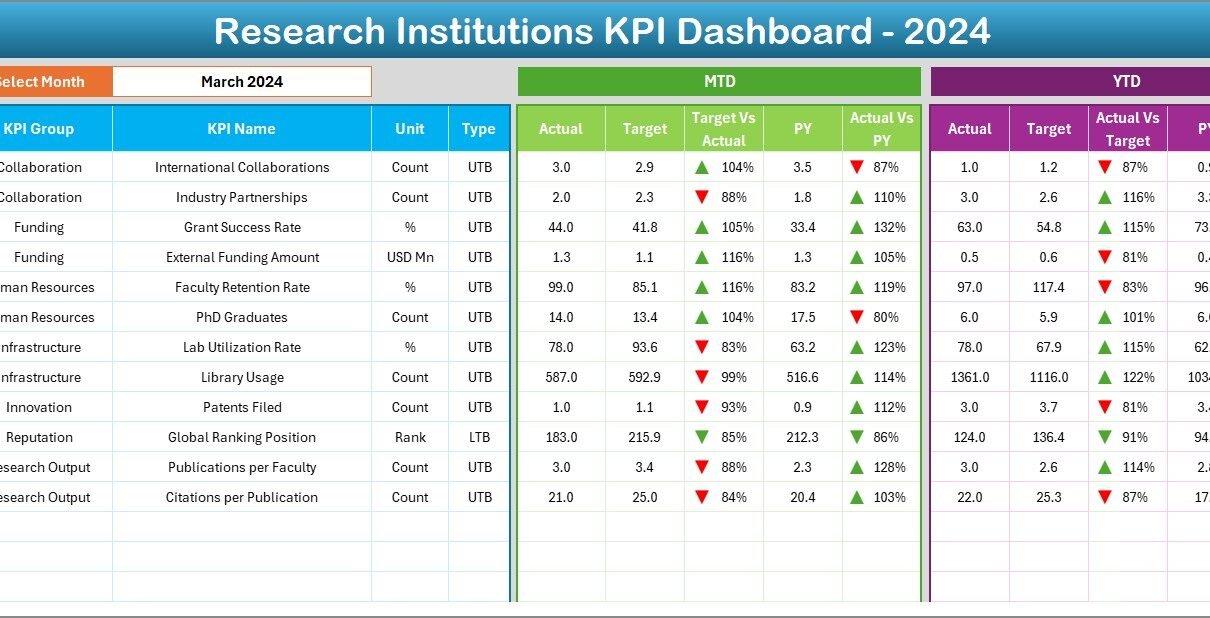
Dashboard Sheet
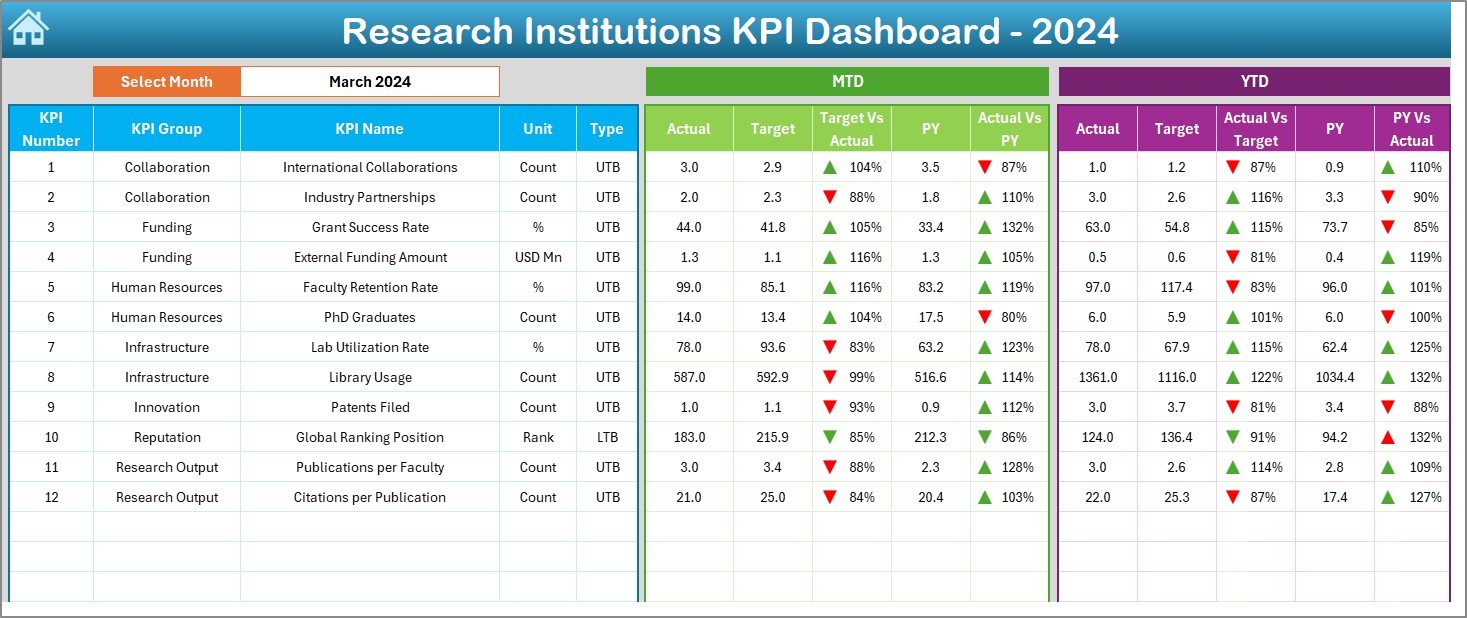
The Dashboard tab is the heart of the template. It gives a real-time overview of research performance.
-
At the top, users select the month from a dropdown menu.
Once selected, the entire dashboard updates automatically with:
- MTD (Month-to-Date) Actual, Target, and Previous Year values.
- Variance analysis with conditional formatting (green/red arrows).
- YTD (Year-to-Date) Actual, Target, and Previous Year data.
This structure ensures stakeholders can compare current performance not only with goals but also with historical data.
Click to Purchases Research Institutions KPI Dashboard in Excel
KPI Trend Sheet
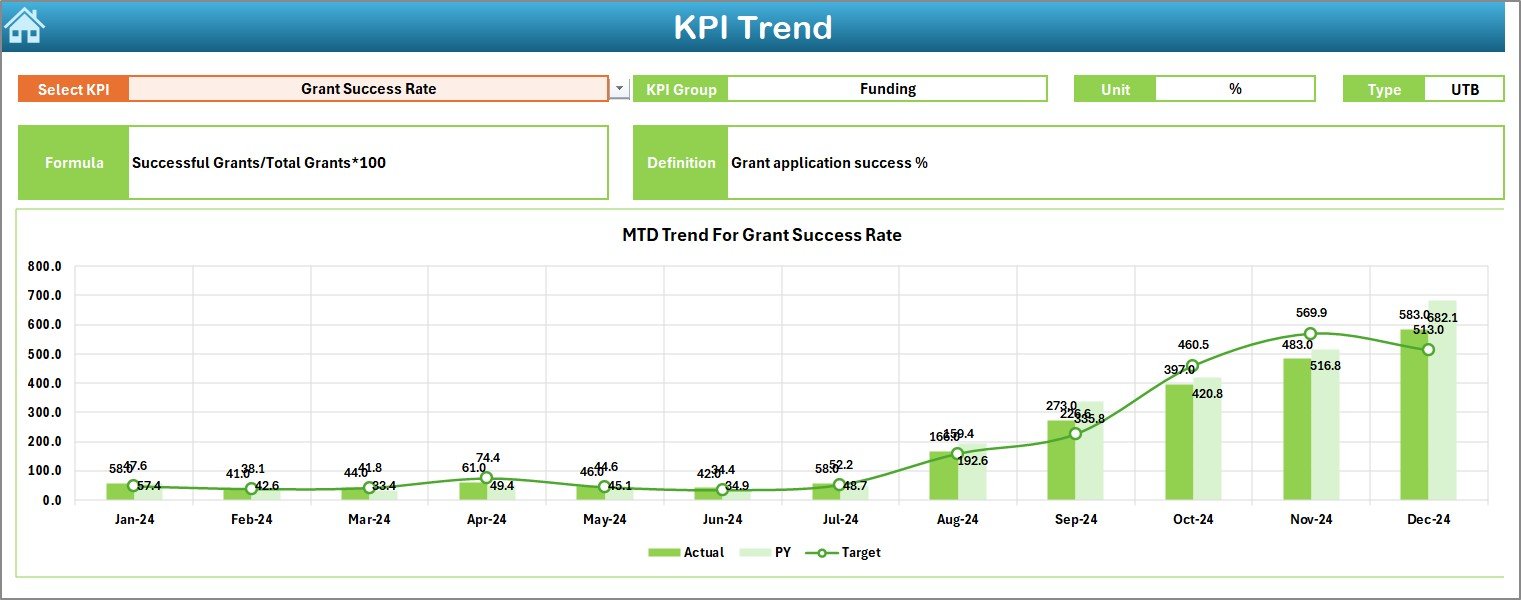
Tracking trends over time helps spot patterns and potential issues.
-
Select the KPI name from a dropdown in cell C3.
Displays:
- KPI Group
- Unit of Measurement
- Type of KPI (UTB = Upper the Better or LTB = Lower the Better)
- Formula and Definition of KPI
-
Visualizes MTD and YTD trends through charts comparing Actual, Target, and Previous Year.
This sheet is particularly powerful for research institutions where publication trends, grant approvals, or funding usage must be compared across time.
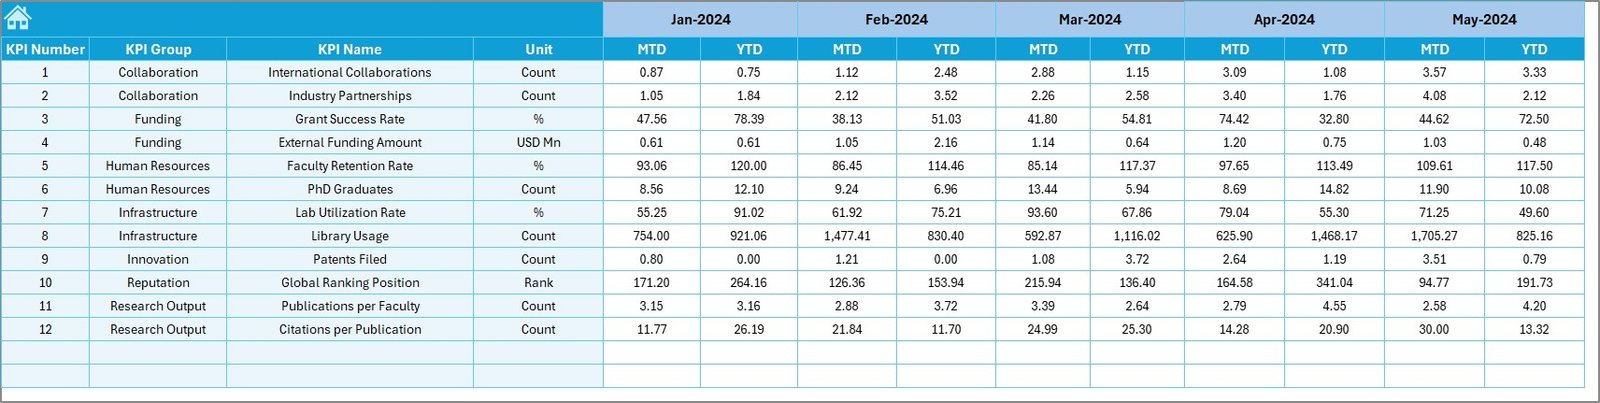
Actual Numbers Input Sheet
-
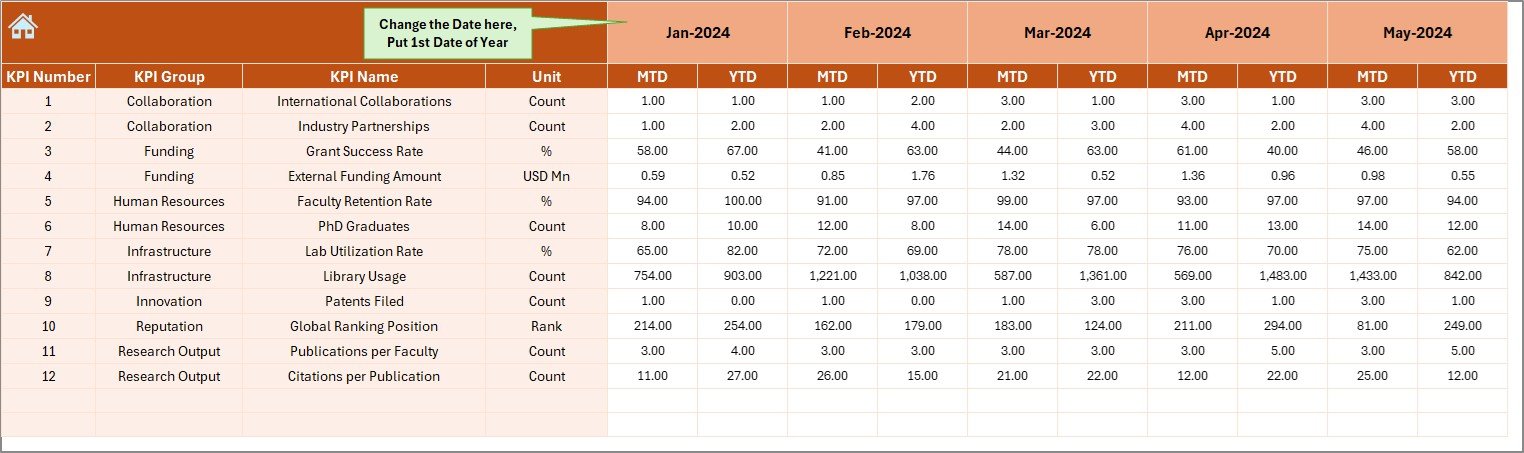
This is the data entry sheet for actual performance numbers.
-
You can define the start month in cell E1.
-
Records both MTD and YTD values for each KPI.
Having a centralized input area keeps the system consistent and prevents errors caused by multiple entries across sheets.
Target Sheet
Research institutions rely heavily on setting clear targets.
-
This sheet allows input of monthly and yearly targets for each KPI.
-
Stores both MTD and YTD targets side by side with actual values.
It ensures accountability by directly linking expected outcomes with actual performance.
Previous Year Numbers Sheet
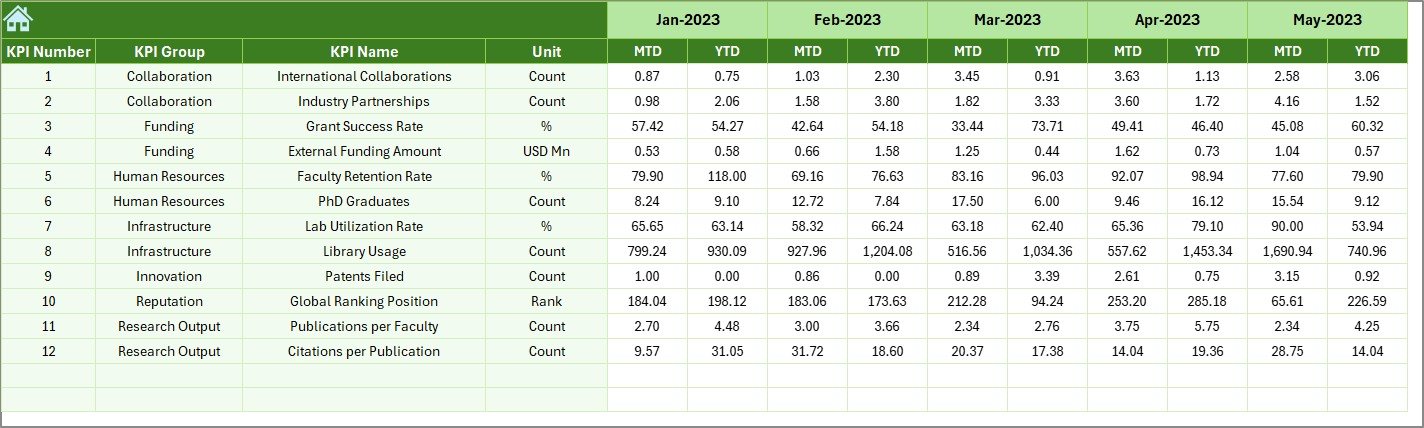
Historical comparisons are essential for understanding growth and progress.
-
This sheet records Previous Year data for every KPI.
-
Structured like the Actual and Target sheets for consistency.
By comparing with historical data, institutions can measure long-term trends.
KPI Definition Sheet
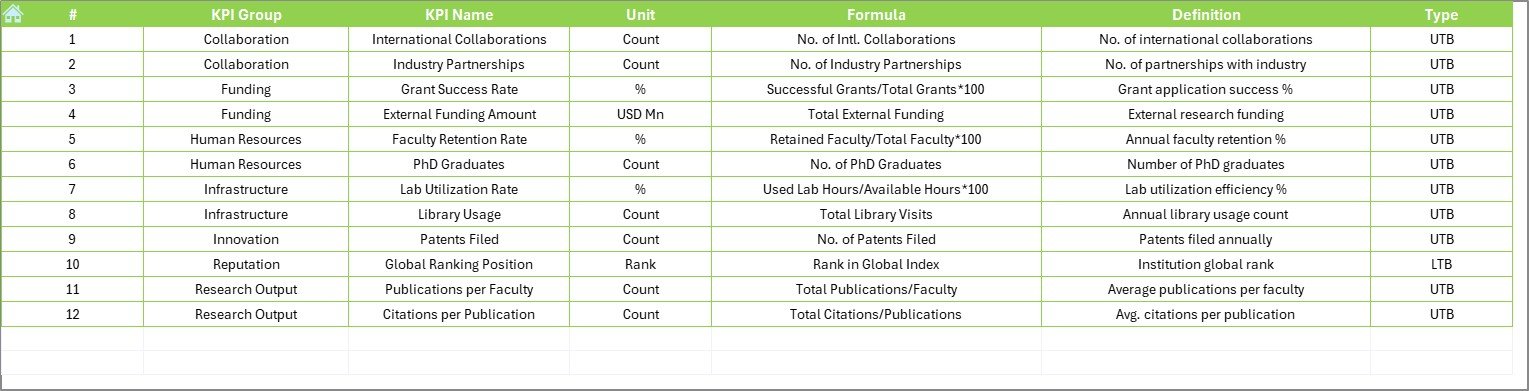
The most important sheet for governance and clarity.
Stores KPI details:
- KPI Name
- KPI Group
- Unit
- Formula
- Definition
-
Clearly defines whether the KPI is UTB or LTB.
This ensures consistency across teams and prevents ambiguity in performance measurement.
Why Research Institutions Need a KPI Dashboard
Research environments are complex, involving projects, people, funding, and outcomes. Tracking all these moving parts without a structured dashboard often leads to:
-
Missed deadlines
-
Underutilized resources
-
Lack of accountability
-
Difficulty in reporting to funding agencies
A KPI Dashboard in Excel addresses these problems by:
-
Centralizing data
-
Automating variance analysis
-
Presenting insights visually
-
Making performance tracking accessible to all stakeholders
Advantages of a Research Institutions KPI Dashboard in Excel
📊 Simplifies Monitoring: Track dozens of KPIs in one place.
🔄 Ensures Consistency: Standard formulas and definitions avoid confusion.
💡 Drives Decisions: Instant access to performance insights helps leaders act quickly.
📅 Improves Time Management: Monthly and yearly trends highlight delays early.
📈 Boosts Transparency: Easy-to-understand dashboards encourage trust among stakeholders.
💸 Saves Costs: Built in Excel, it eliminates the need for expensive BI software.
🔗 Enhances Accountability: Targets and actual values side by side make responsibility clear.
Opportunities for Improvement in KPI Dashboards
Even though Excel dashboards are powerful, research institutions can enhance them further:
⚙️ Automation with VBA: Automating data entry and report generation reduces errors.
🌐 Integration with External Databases: Linking with grant management systems or HR tools keeps data up to date.
📲 Cloud Sharing: Using Excel Online or SharePoint improves collaboration.
🎨 Advanced Visualization: Adding slicers, pivot charts, and conditional formatting enhances clarity.
🔒 Data Security: Adding password protection ensures sensitive research data remains safe.
Best Practices for Using a Research Institutions KPI Dashboard
✅ Define Clear KPIs: Ensure every KPI is measurable, relevant, and time-bound.
✅ Standardize Data Entry: Use dropdowns and pre-defined formats.
✅ Update Regularly: Input actual numbers monthly without fail.
✅ Train Staff: Ensure all team members understand how to read and use the dashboard.
✅ Visualize Trends: Use charts to spot issues before they escalate.
✅ Review Targets Annually: Adjust KPIs and targets to reflect evolving research goals.
✅ Document Everything: Use the KPI Definition sheet to maintain transparency.
How to Implement the Research Institutions KPI Dashboard
-
Set Up KPI Definition: Start by entering KPI names, groups, formulas, and definitions.
-
Enter Historical Data: Fill in previous year’s actual values.
-
Define Targets: Enter realistic MTD and YTD targets for the current year.
-
Update Monthly Actuals: Use the Actual Numbers Input sheet.
-
Monitor Dashboard: Select the current month from the dropdown and analyze trends.
-
Review Annually: Compare year-to-date values with past performance.
Conclusion
The Research Institutions KPI Dashboard in Excel is more than just a reporting tool—it’s a performance compass. It helps institutions align projects, funding, and research outcomes with long-term goals. By centralizing KPIs into a single interactive system, research leaders can improve efficiency, accountability, and transparency.
For institutions looking to strengthen their performance monitoring, this dashboard is a cost-effective and powerful solution.
Frequently Asked Questions (FAQs)
1. What KPIs should research institutions track?
Institutions should track KPIs such as number of active projects, publications, funding utilization, grant approvals, research collaborations, and project completion rates.
2. Can I customize this dashboard for my institution?
Yes. You can add or remove KPIs, change formulas, and even customize visuals depending on your needs.
3. Do I need advanced Excel skills to use it?
No. Basic Excel knowledge is enough. The template is designed to be user-friendly with dropdowns and automated charts.
4. How often should I update the dashboard?
You should update it monthly with actual numbers to maintain accuracy. Annual reviews are also recommended.
5. Can multiple people use this dashboard at the same time?
Yes, if hosted on Excel Online or SharePoint. For offline use, it is best managed by one person to avoid conflicts.
6. What makes this dashboard better than manual tracking?
It automates calculations, reduces errors, and provides instant visual insights, which manual methods cannot achieve.
Visit our YouTube channel to learn step-by-step video tutorials