The healthcare industry is going through rapid digital transformation. From patient care and compliance to financial management and innovation, health organizations need strong systems to track their performance. In such a scenario, HealthTech KPI Dashboards in Excel have become essential tools.
These dashboards allow hospitals, clinics, pharmaceutical companies, and health startups to track progress, measure efficiency, and ensure better decision-making. In this article, we will explore everything you need to know about the HealthTech KPI Dashboard in Excel—its structure, features, advantages, best practices, and more.
Click to Purchase HealthTech KPI Dashboard in Excel
What Is a HealthTech KPI Dashboard in Excel?
A HealthTech KPI Dashboard in Excel is a structured performance monitoring tool built within Microsoft Excel. It helps organizations track key performance indicators (KPIs) across clinical, operational, financial, and compliance areas.
Instead of scattered spreadsheets and manual reporting, the dashboard centralizes all information in one place. Managers and stakeholders can track monthly and yearly trends, compare targets with actuals, and make data-driven decisions to improve healthcare outcomes.
Key Features of the HealthTech KPI Dashboard
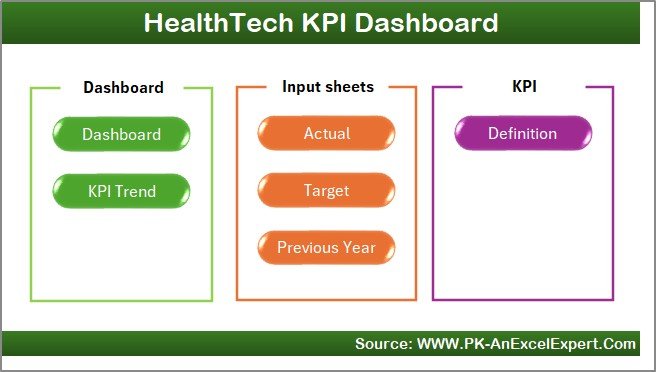
This dashboard comes with seven interactive worksheet tabs, each serving a different function:
1. Home Sheet
-
Serves as an index page with quick navigation buttons.
-
Provides access to all other sheets like Dashboard, KPI Trend, Targets, and more.
-
Helps users save time by avoiding manual scrolling.
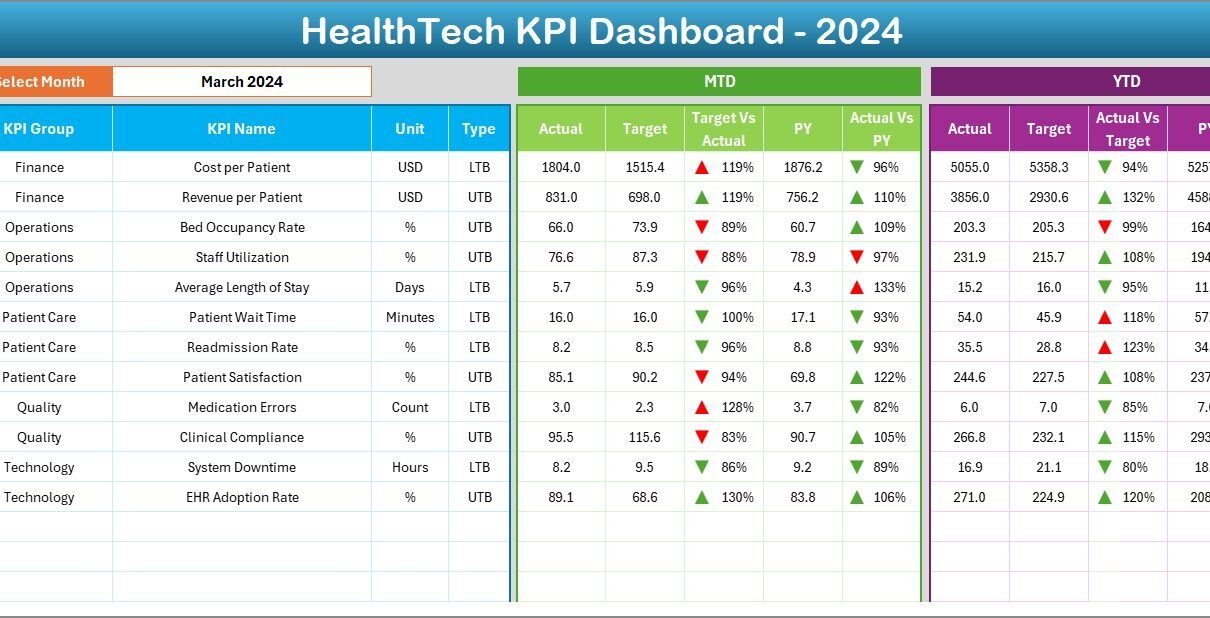
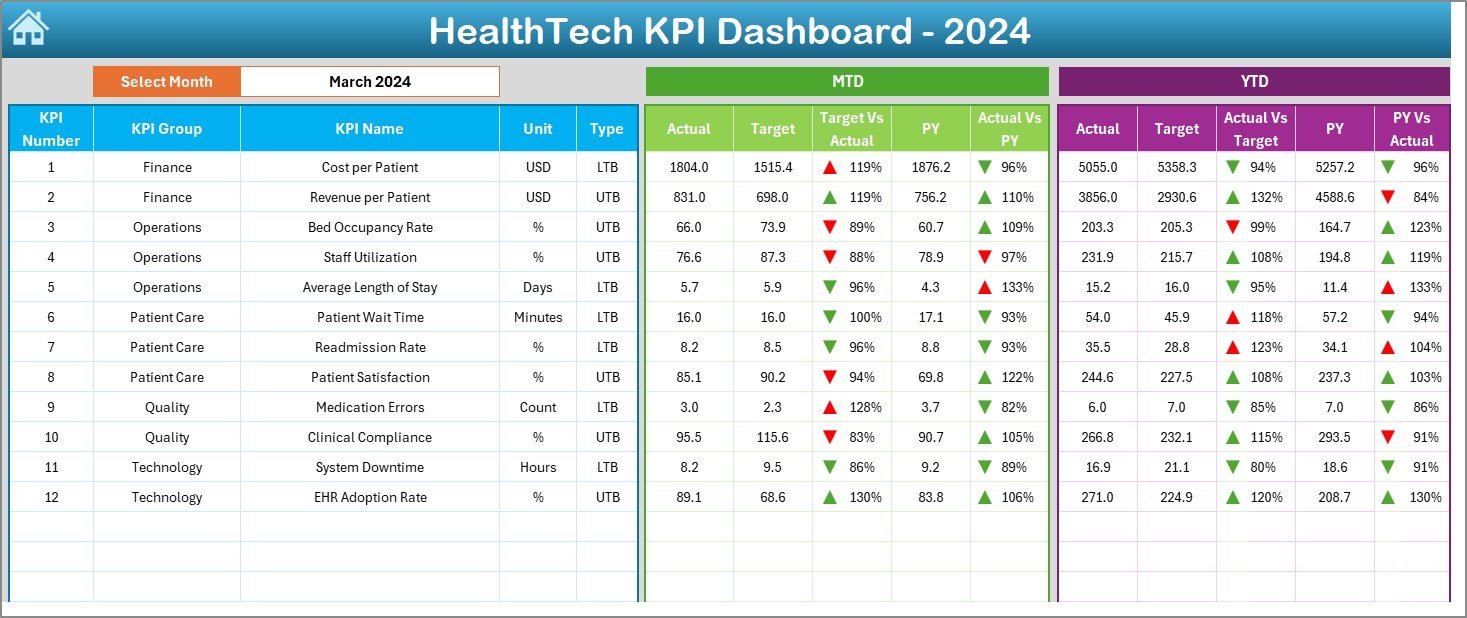
2. Dashboard Sheet Tab
-
Acts as the main reporting page.
-
Includes a month selector (D3) that updates the entire dashboard instantly.
-
Displays:
-
MTD (Month-to-Date): Actual, Target, Previous Year with variance analysis.
-
YTD (Year-to-Date): Actual, Target, Previous Year with variance analysis.
-
-
Uses conditional formatting with up/down arrows to highlight performance.
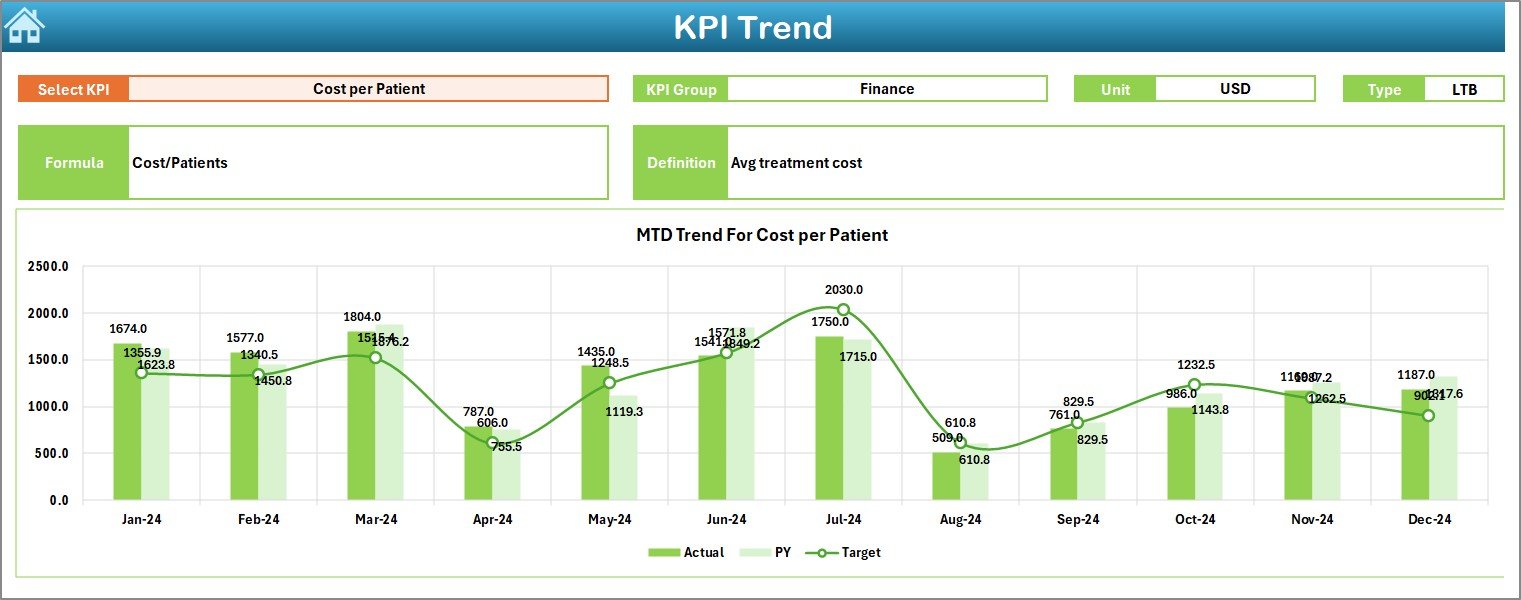
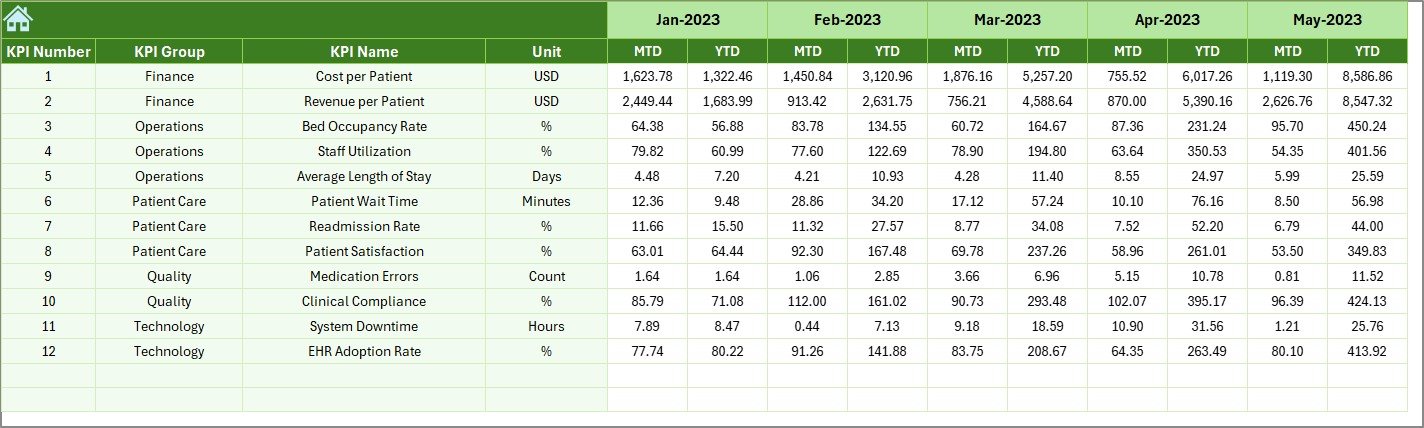
3. KPI Trend Sheet Tab
-
Allows users to select a KPI from a dropdown (C3).
-
Displays:
-
KPI Group, Unit, Type (UTB/LTB), Formula, and Definition.
-
MTD and YTD trend charts for Actual, Target, and Previous Year values.
-
-
Helps in time-series analysis and long-term performance tracking.
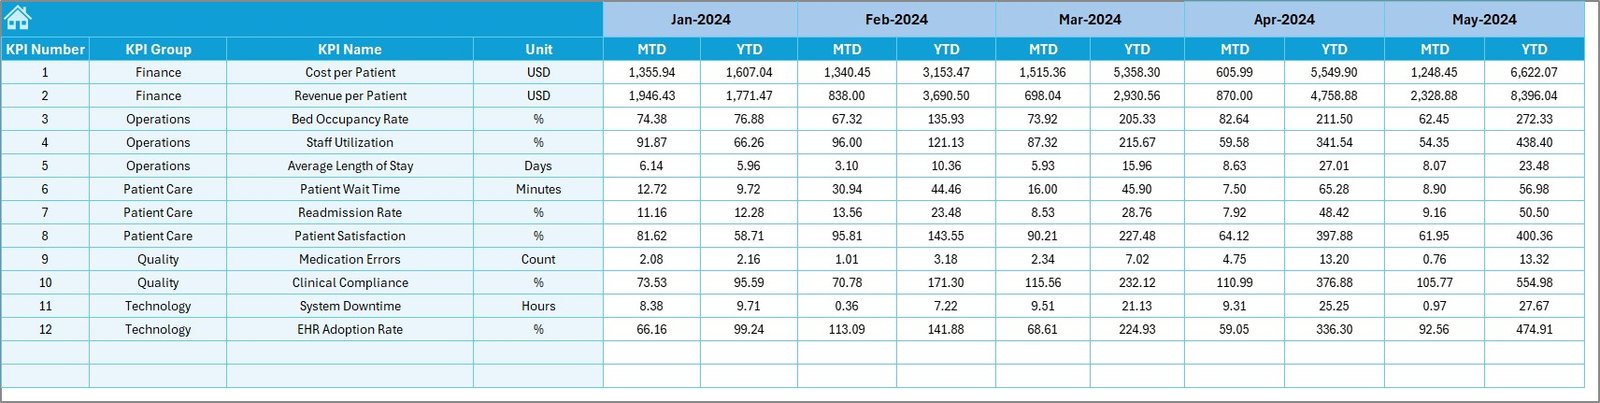
4. Actual Numbers Input Sheet
-
Users enter monthly actuals for each KPI.
-
Contains an input range where the first month of the year is defined (E1).
-
Ensures data consistency and accuracy.
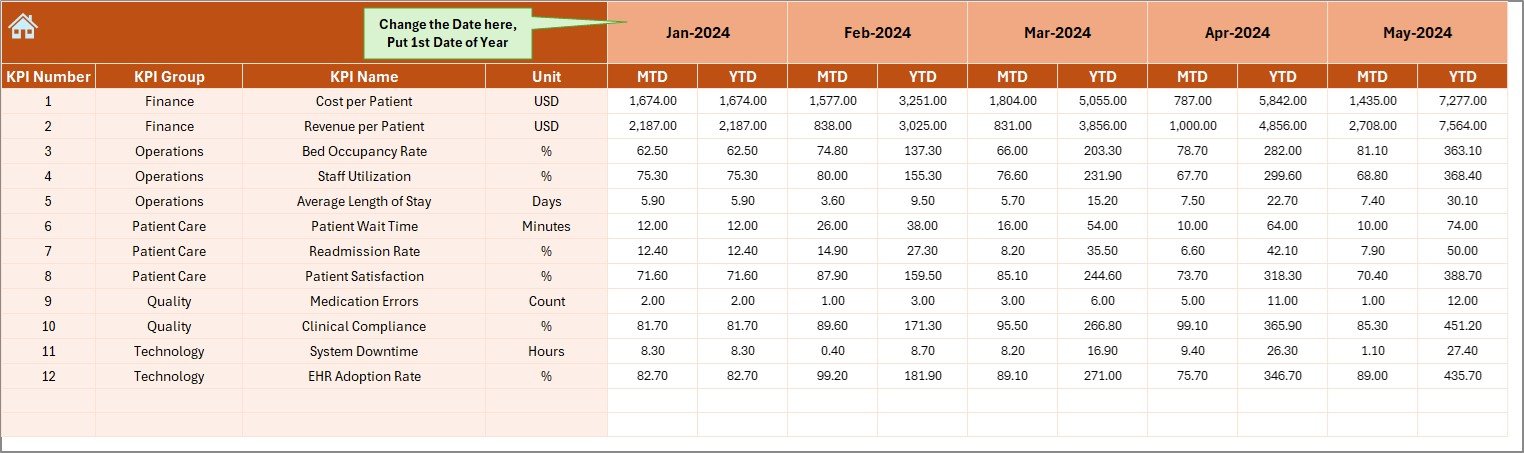
5. Target Sheet Tab
Stores the planned numbers for each KPI.
-
Includes both MTD and YTD targets for easy comparison.
6. Previous Year Numbers Sheet
-
Captures data from the previous year to enable historical comparisons.
-
Helps organizations analyze YoY (Year-over-Year) growth or decline.
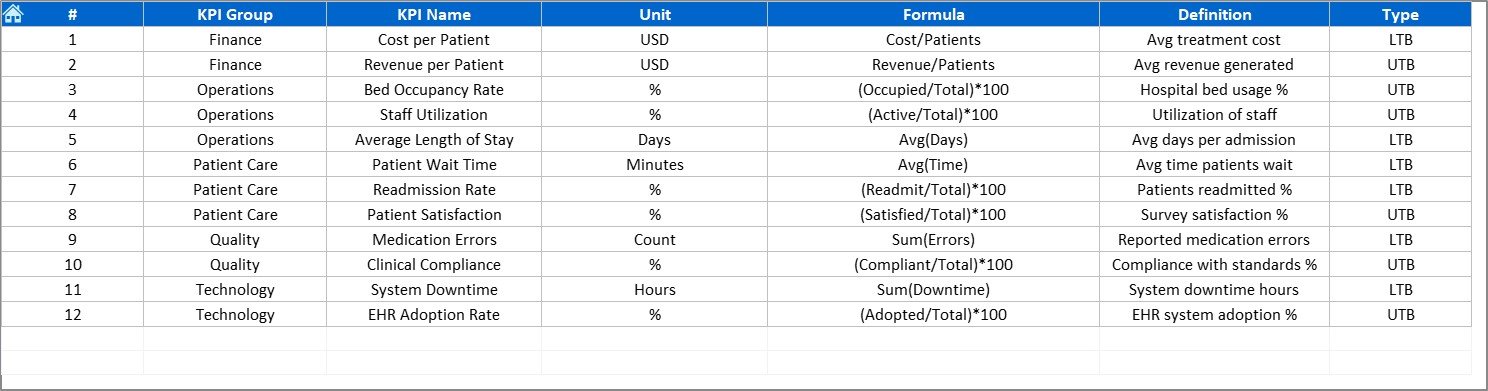
7. KPI Definition Sheet Tab
-
Stores metadata about each KPI:
-
KPI Name
-
KPI Group
-
Unit of Measurement
-
Formula
-
KPI Definition
-
-
Serves as a reference library for stakeholders to understand KPI logic.
Why Do Healthcare Organizations Need a KPI Dashboard?
Healthcare organizations face unique challenges—balancing patient safety, compliance, cost efficiency, and innovation. A KPI dashboard helps by:
-
Tracking patient outcomes and satisfaction.
-
Monitoring regulatory compliance.
-
Measuring financial performance.
-
Identifying operational inefficiencies.
-
Supporting evidence-based decision-making.
Advantages of a HealthTech KPI Dashboard in Excel
Here are some key benefits of implementing this dashboard:
✅ Centralized Reporting – All KPIs are tracked in one place.
✅ Real-Time Insights – Monthly and yearly views update instantly.
✅ Visual Representation – Charts and conditional formatting improve clarity.
✅ Historical Analysis – Compare with previous year performance.
✅ Customization – Easily add or modify KPIs as per organizational needs.
✅ Cost-Effective – Built in Excel, no extra software required.
✅ User-Friendly – Requires minimal training to operate.
Opportunities for Improvement in HealthTech KPI Dashboards
While Excel dashboards are powerful, they can be improved further:
🔹 Automation – Linking the dashboard with hospital databases or EMRs can reduce manual entry.
🔹 Advanced Visualization – Integration with Power BI or Tableau for more interactive analysis.
🔹 Predictive Analytics – Adding AI-driven forecasting to anticipate patient loads or cost spikes.
🔹 Collaboration – Moving dashboards to cloud platforms like Google Sheets or Office 365 for real-time collaboration.
🔹 Data Security – Ensuring HIPAA/GDPR compliance for patient-related KPIs.
Best Practices for Using the HealthTech KPI Dashboard
To get maximum benefits from the dashboard, follow these best practices:
📊 Define Clear KPIs – Ensure KPIs are aligned with business and patient-care goals.
📅 Update Data Regularly – Enter actuals monthly to avoid reporting delays.
🔄 Validate Data – Cross-check numbers against source systems.
📈 Use Trend Analysis – Always review multi-month patterns, not just a single month.
👥 Engage Stakeholders – Share dashboard insights with management, doctors, and staff.
🔐 Protect Data – Lock formulas and sensitive sheets to avoid accidental edits.
⚡ Leverage Excel Features – Use slicers, pivot tables, and dynamic charts for interactive analysis.
How to Build a HealthTech KPI Dashboard in Excel
Here’s a step-by-step overview:
-
List KPIs – Define clinical, operational, financial, and compliance metrics.
-
Create Input Sheets – Add separate sheets for Actuals, Targets, and Previous Year data.
-
Set Up Definitions – Store KPI metadata for transparency.
-
Design Dashboard Layout – Use cards, charts, and conditional formatting for quick insights.
-
Add Interactivity – Include dropdowns for month/KPI selection.
-
Test and Validate – Ensure numbers are accurate before deploying.
-
Train Users – Educate staff on how to use and update the dashboard.
Examples of KPIs in HealthTech Dashboards
Some common KPIs include:
-
Patient Care KPIs
-
Average Waiting Time (Lower the Better)
-
Patient Satisfaction Score (Upper the Better)
-
Readmission Rate (Lower the Better)
-
-
Operational KPIs
-
Bed Occupancy Rate
-
Appointment No-Show %
-
Equipment Utilization
-
-
Financial KPIs
-
Revenue per Patient
-
Operating Margin %
-
Cost per Procedure
-
-
Compliance KPIs
-
% Staff Trained on Safety Protocols
-
Audit Findings Count
-
Incident Reporting Time
-
Conclusion
The HealthTech KPI Dashboard in Excel is a game-changer for healthcare organizations. It provides clear, structured, and data-driven insights that support better decisions. By tracking patient outcomes, financial efficiency, and compliance, healthcare providers can ensure sustainable growth while delivering high-quality care.
However, organizations must continuously improve their dashboards by automating data, adopting predictive analytics, and ensuring data security. When used with best practices, this dashboard can be a reliable backbone for healthcare management.
Click to Purchase HealthTech KPI Dashboard in Excel
Frequently Asked Questions (FAQs)
1. What is a HealthTech KPI Dashboard in Excel?
It is a structured Excel-based tool used to monitor healthcare KPIs such as patient satisfaction, cost efficiency, and compliance.
2. Who can use this dashboard?
Hospitals, clinics, pharmaceutical companies, diagnostic labs, and health startups can all use this dashboard.
3. How often should I update the dashboard?
You should update it monthly with actual numbers and compare them against targets.
4. Can I customize the KPIs?
Yes, you can add, remove, or modify KPIs in the KPI Definition sheet.
5. Is this dashboard better than Power BI?
For small to mid-sized healthcare organizations, Excel dashboards are sufficient. Larger organizations may prefer Power BI for advanced analytics.
6. Does this dashboard support compliance tracking?
Yes, you can include KPIs related to audits, staff training, and regulatory adherence.
7. What makes this dashboard cost-effective?
It is built entirely in Excel, requiring no additional licenses or expensive software.
Visit our YouTube channel to learn step-by-step video tutorials
Click to Purchase HealthTech KPI Dashboard in Excel
Watch the step-by-step video tutorial: